Better than Relative Strength? Bet your beliefs

This is in the category of machine learning and I understand that can get a little technical. I won’t show the Python code or any equations but still….

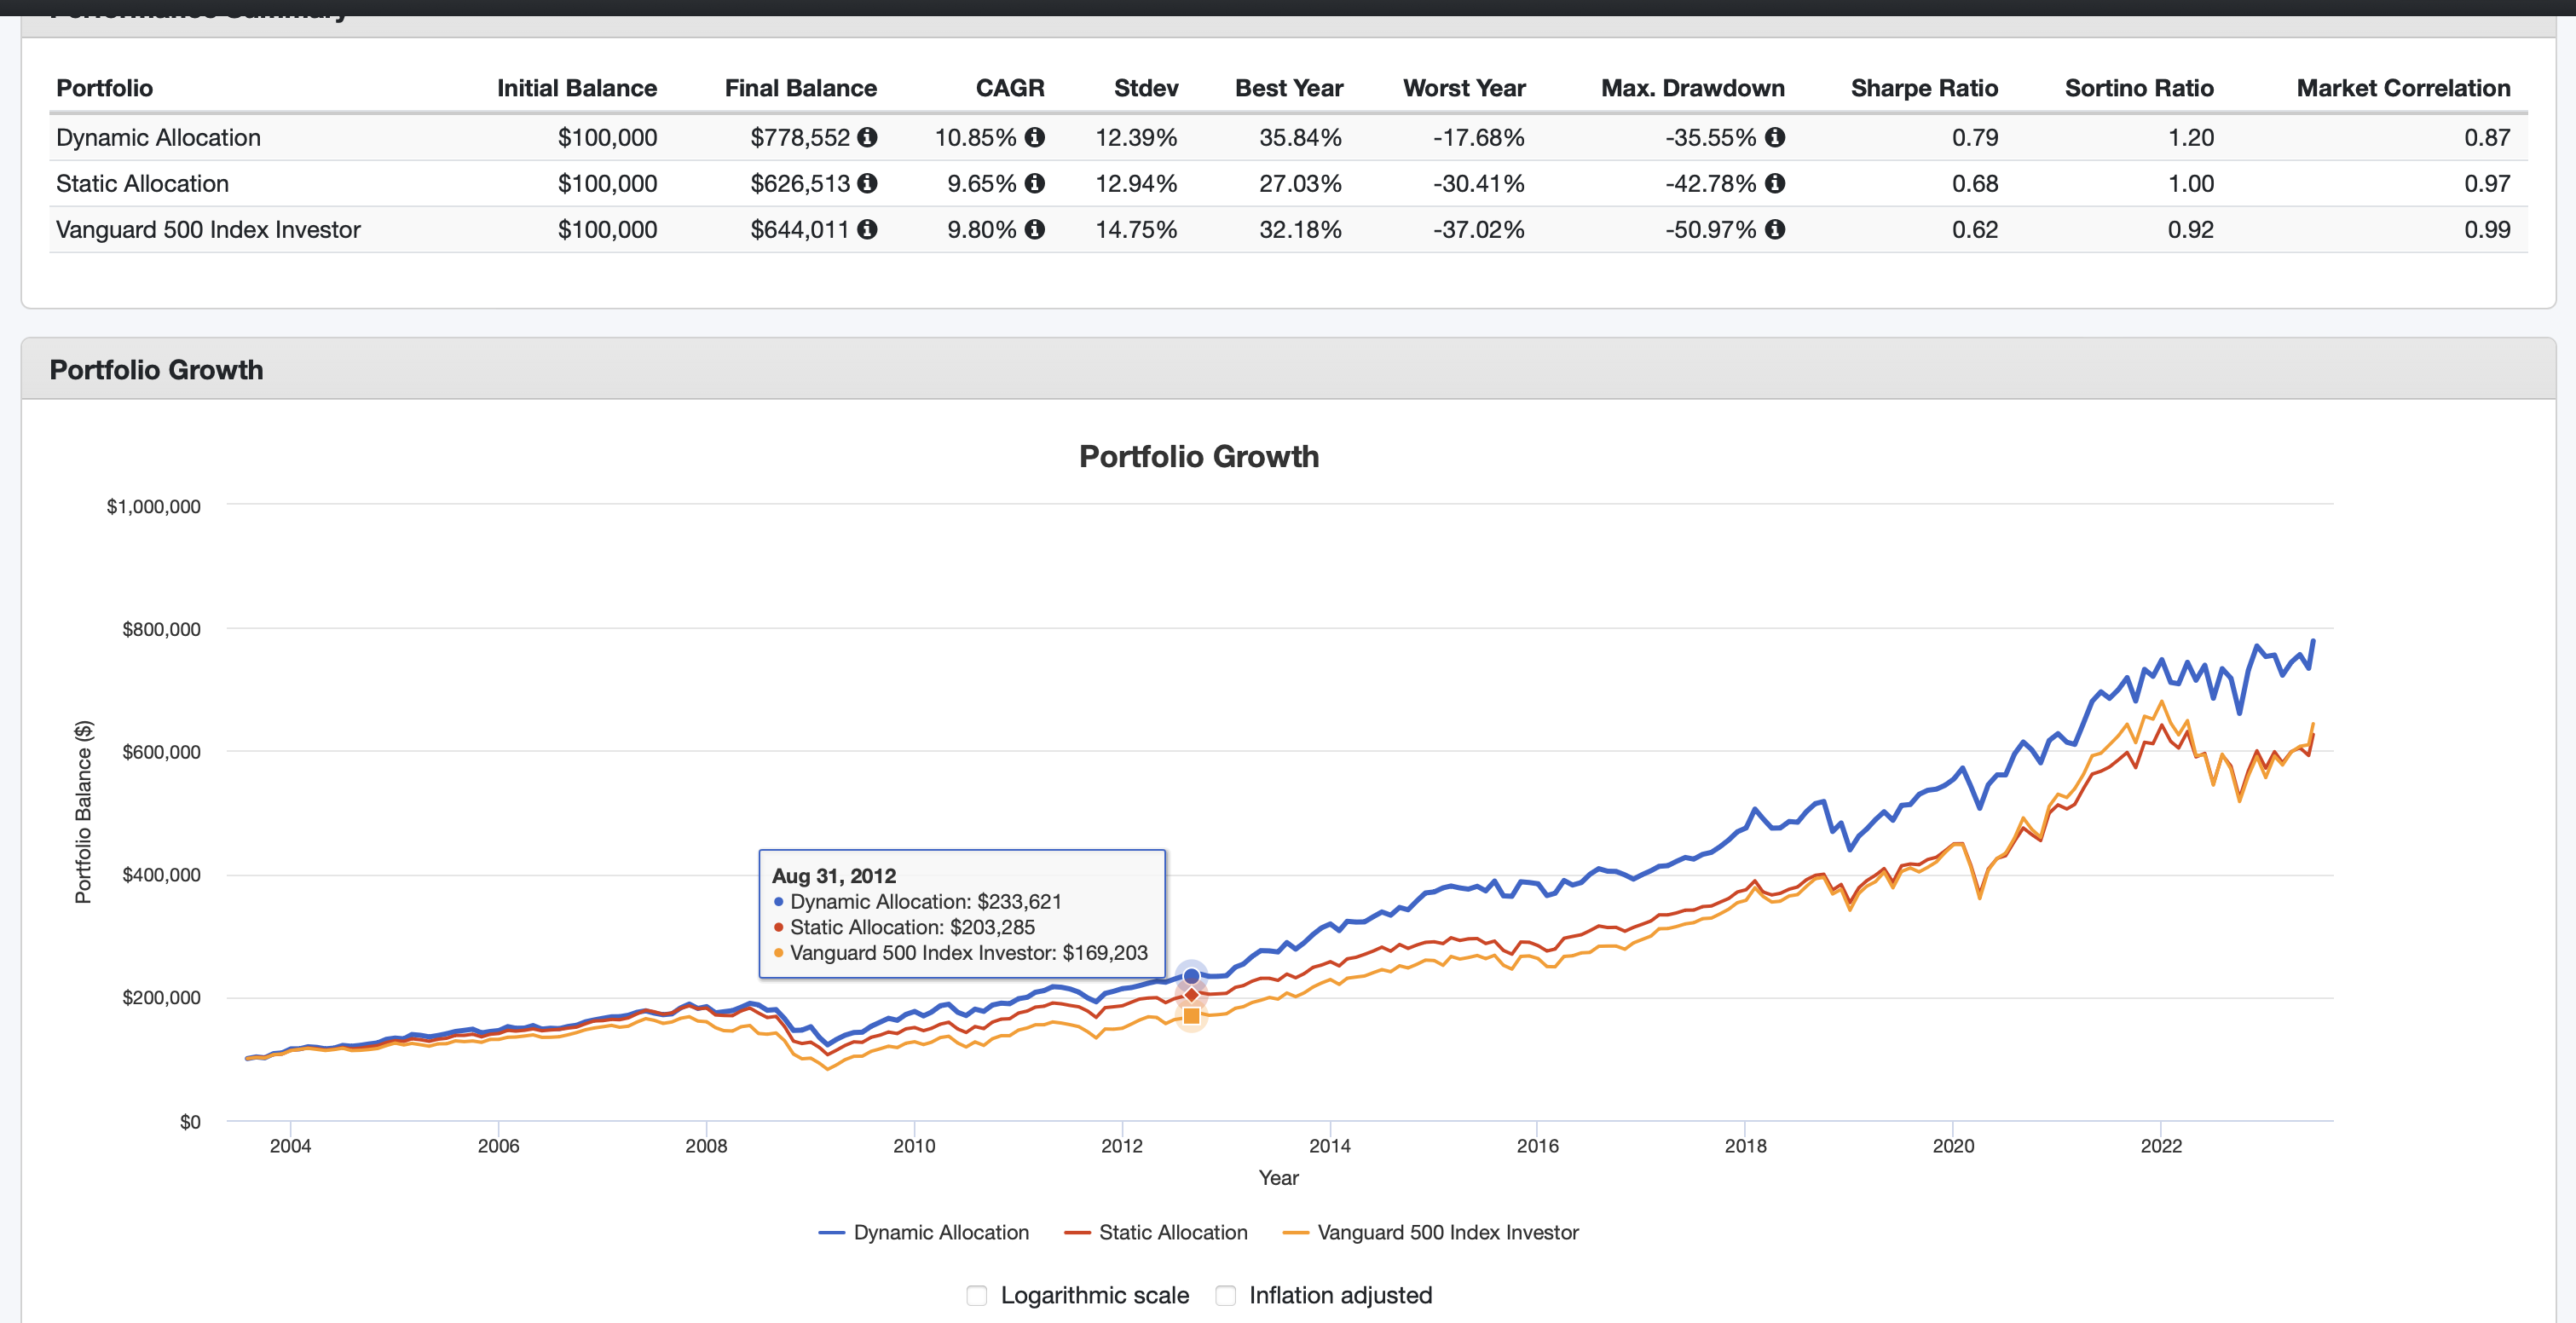
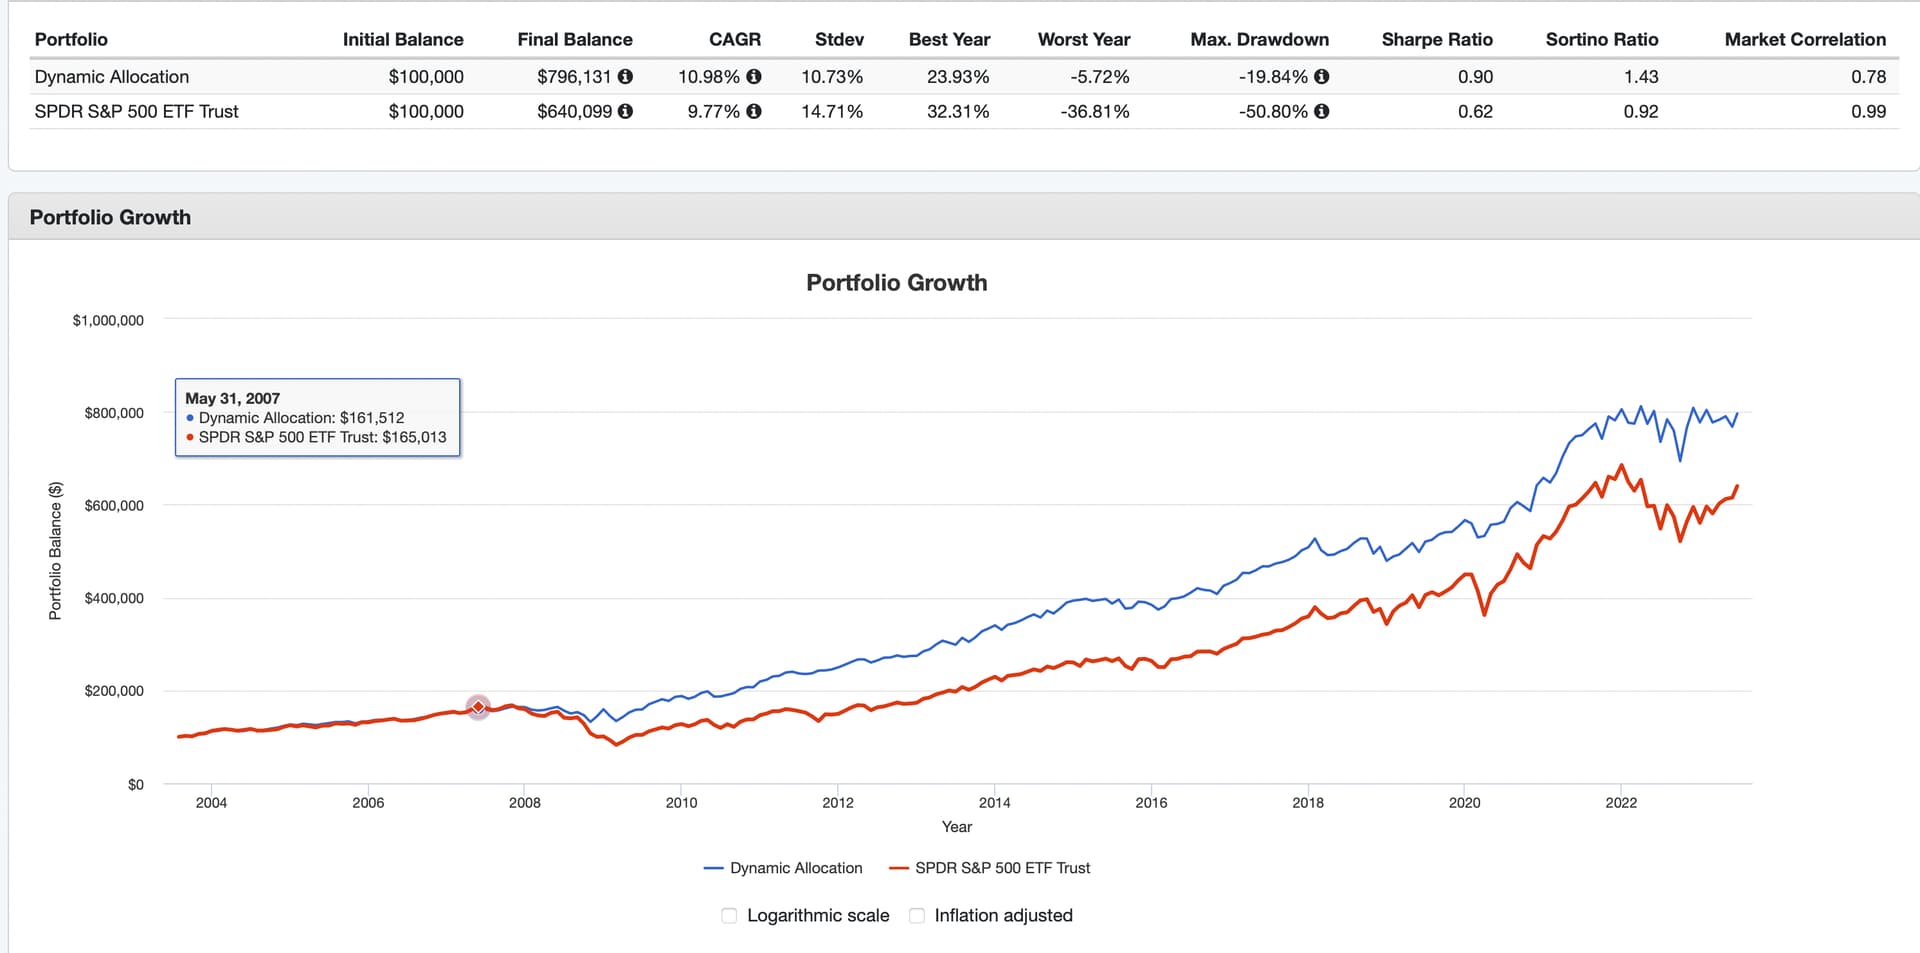
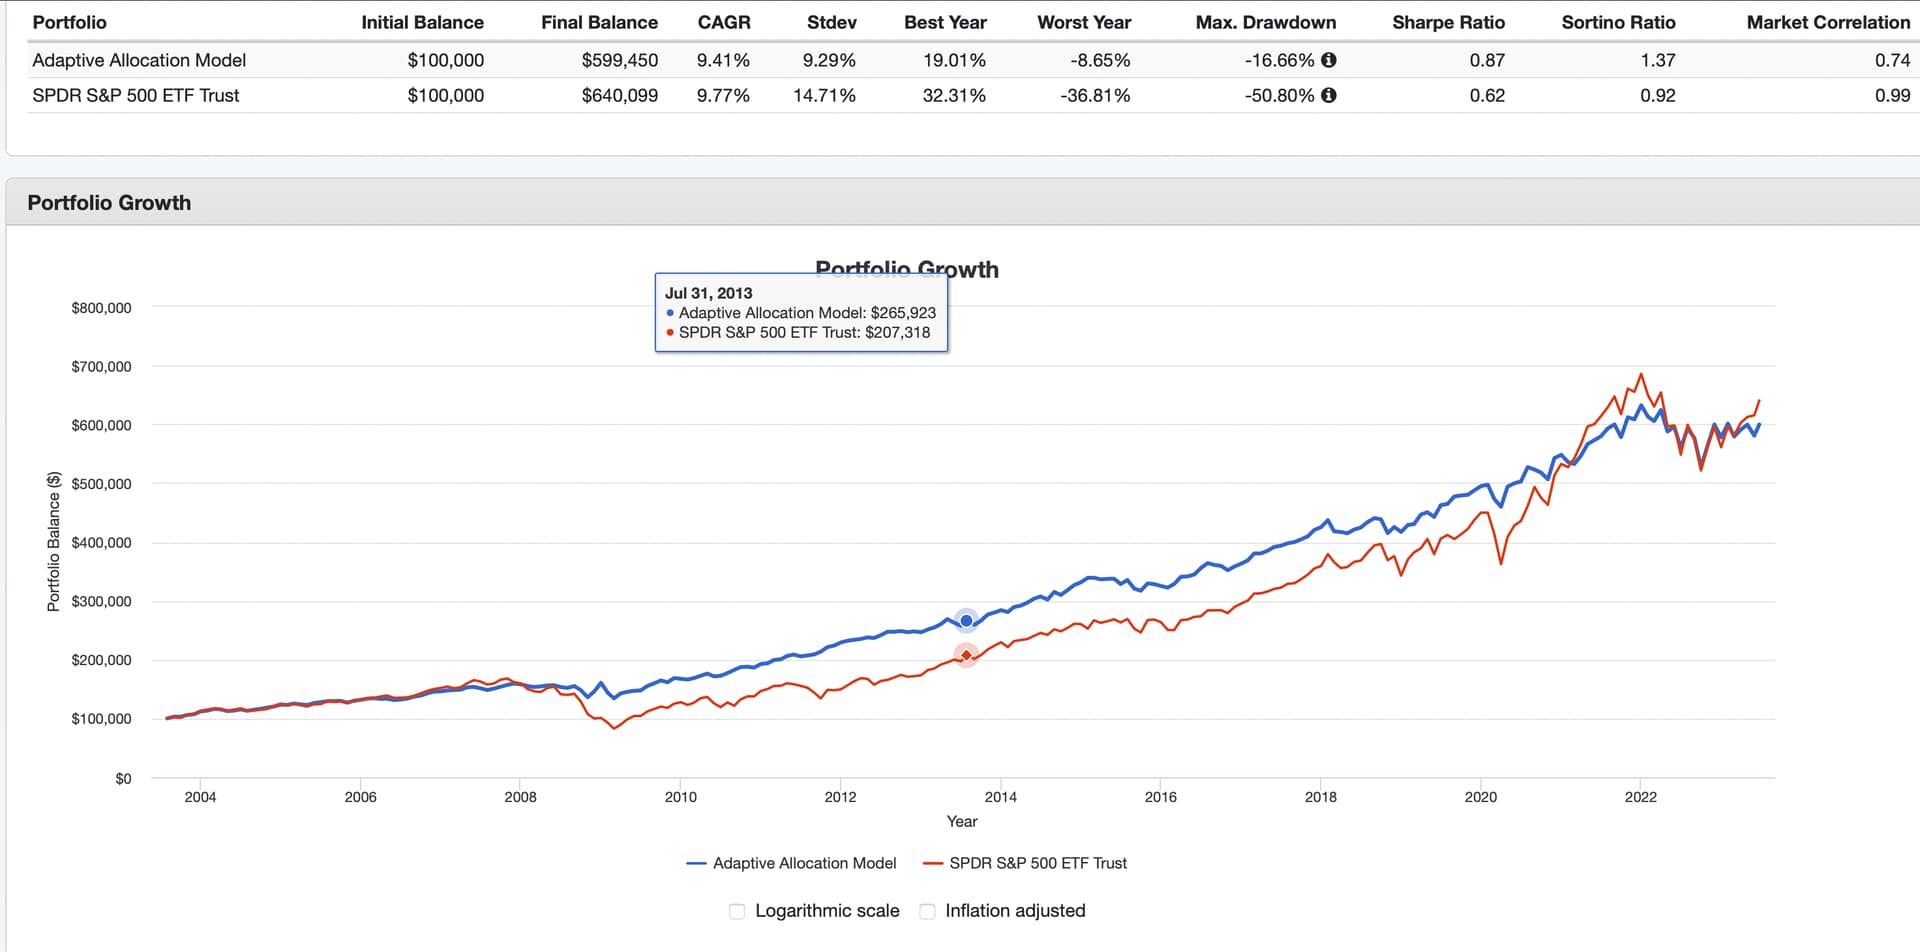
I have to wonder if one of the methods that is easily available at Portfolio Visualizer cannot be improved. One can backtest strategies (or even walk-forward a cross-validation) at Portfolio Visualizer that uses Relative Strength. And one can then weight the assets with the best relative strength using risk parity, minimum-variance or other strategies.

Nice! But I have concerns. This is an all-or-nothiing strategy. TLT might have adequate relative strength one month (if you rebalance monthly) and be included and it might disappear from your portfolio the next month. Wouldn’t it be better if it gradually disappeared assuming you did not have a dramatic shift in your opinion?

Also, IMHO, moving averages are prime for over-fitting. Maybe just me.

TL;DR: is there a better way?

ChatGPT has been stealing some of my ideas as we go along and has suggested (or maybe it was my idea) that I bootstrap the history of an ETF (over variable look-back periods) and essentially get a “probability that an ETF” will give a positive return going forward.

And even better, one can do this with the effect size (i.e, the return/recent standard deviation for the returns).

I have been playing with this and if you want to look at this, one year seems to be optimal (I would have guess 3 months based on what I have done with Portfolio Visualizer).

I then weight each bet (remember this will give a probability between 0 and 1) by using risk parity. When this is done it really begins to resemble Kelly-betting.

Initially, Kelly talked about betting money on every single horses in a horse race. You would bet according to your calculated probability for each horse. If (and only if) your probabilities were better than the what the bookies were put up as odd you would win over the long-term.

So to the extent that the relative strength (or bootstrapped calculation of the odds) gives you an edge you win.

Honestly, I do not think there is a better way to get a less overfit, robust estimation of the odds WITH JUST PRICE DATA. I think it does give an edge. But full disclosure: the large-cap portion of the market is pretty efficient even if you do not fully subscribe to the efficient market hypothesis for smaller-caps.

BTW, I am not saying relative strength does not work and if anyone wants to show a backtested moving-average or relative strength strategy: GREAT!!! I have used relative strength myself.

Jim

So I actually tested this in a walk-forward study of pure relative strength without risk parity weighting (equal weights are used here).

The first is relative strength based on bootstrapped results (one year window). The second is pure relative strength (not bootstrapped) with a 3-month window.

TL;DR: While I am not sure why different windows are optimal for the different methods, the bootstrapping performed marginally better (including a better alpha. 3.38% and 2.60% respectively). Possibly because the in-sample results were less overfit and therefore less prone to errors from outliers etc.

I can say this: The one-year bootstrapped window is fairly responsive to recent events (e.g., TLT adjusts pretty rapidly in the 2008 recession). This may not be too surprising if one reflects on the non-parametric nature of bootstrapping but mainly, I still have questions about this!!!

The assets were: XLE XLU XLK XLP XLB XLY XLI XLV XLF TLT. The 5 best performing ETFs (again, equally weighted) were selected for each method. Bootstrapped version first (blue for Portfolio Visualizer).

Also consider whether Vanguard 500 Index Investor is the best benchmark for a portfolio containing a bond fund. But nice that in outperformed anyway.

Even if you stick with the easier method of relative strength (with whatever assets or windows you happen to prefer) the success of the bootstrapping lends SOME support for the idea of relative strength or momentum strategies still being effective at times (again, with your own parameters and assets).

I hope I am not overemphasizing the importance of this one study and I would hope no one uses this without looking at it themselves and making some adjustments of their own. I am not investing in this strategy but I am looking to draw more general conclusions about momentum strategies and the usefulness of bootstrapping (without overfitting by trying a lot of different ETFs initially).

So I tested this with a walk-forward validation using a 60-day rolling window. I would call it a success.

Not as impressive as some backtests I have seen. Maybe I will take a moments to consider how much influence overfitting has on some of these tests—including mine. Hmmm…okay, it will take more than a moment. It is a complex question with different answers depending on what is being presented. What is being presented here being no exception.

But also, results can be so good that they should be rejected out-of-hand. If you stick with the idea of Kelly-Betting, there is only so much information in the market that has not already been discovered and arbitraged away. In other words, it is a pretty efficient market. The only question being how few anomalies still exist. AND how much information is actually present in each abnormality!!!

Anyway, here it is. I will spare you the math and the programming. Decide for yourself. The first is with my algorithmic calculation of my beliefs about postive return probabilities and the second is pure risk parity (no consideration of returns or probability of positive returns):

Conclusion: this seem to be a pattern. Adding your beliefs seems to increase returns without affecting the Sharpe ratio much. Maybe I will take it: the same risk adjusted returns with better returns. That is simple enough

FWIW.

Jim