It is not much of a simplification to say a t-test looks at the 95% confidence interval of 2 samples. Full stop.
A t-test COULD be okay to use with financial data because of the central limit theorem. Probably, most of the time maybe……uh if the tails are not too big. Uh,……what about kurtosis?
For anyone who likes some statistics and wants to get beyond the hand-waving that using a t-test entails, and wants some pretty simple code that runs fast on any machine, I have the code to bootstrap the 95% confidence intervals for a sim run with random() rank and the same sim run with your ranking system. I.E. the 2 samples of a classic t-test.
If the upper confidence-bound for a random() ranking system is ABOVE the lower confidence-bound for the sim with a ranking system that you have developed: DO NOT FUND IT!!! Simple.
I think even those who do not love statistics might agree with me on the last as a prudent rule of thumb—especially if you decide to keep it at the 95% confidence interval.
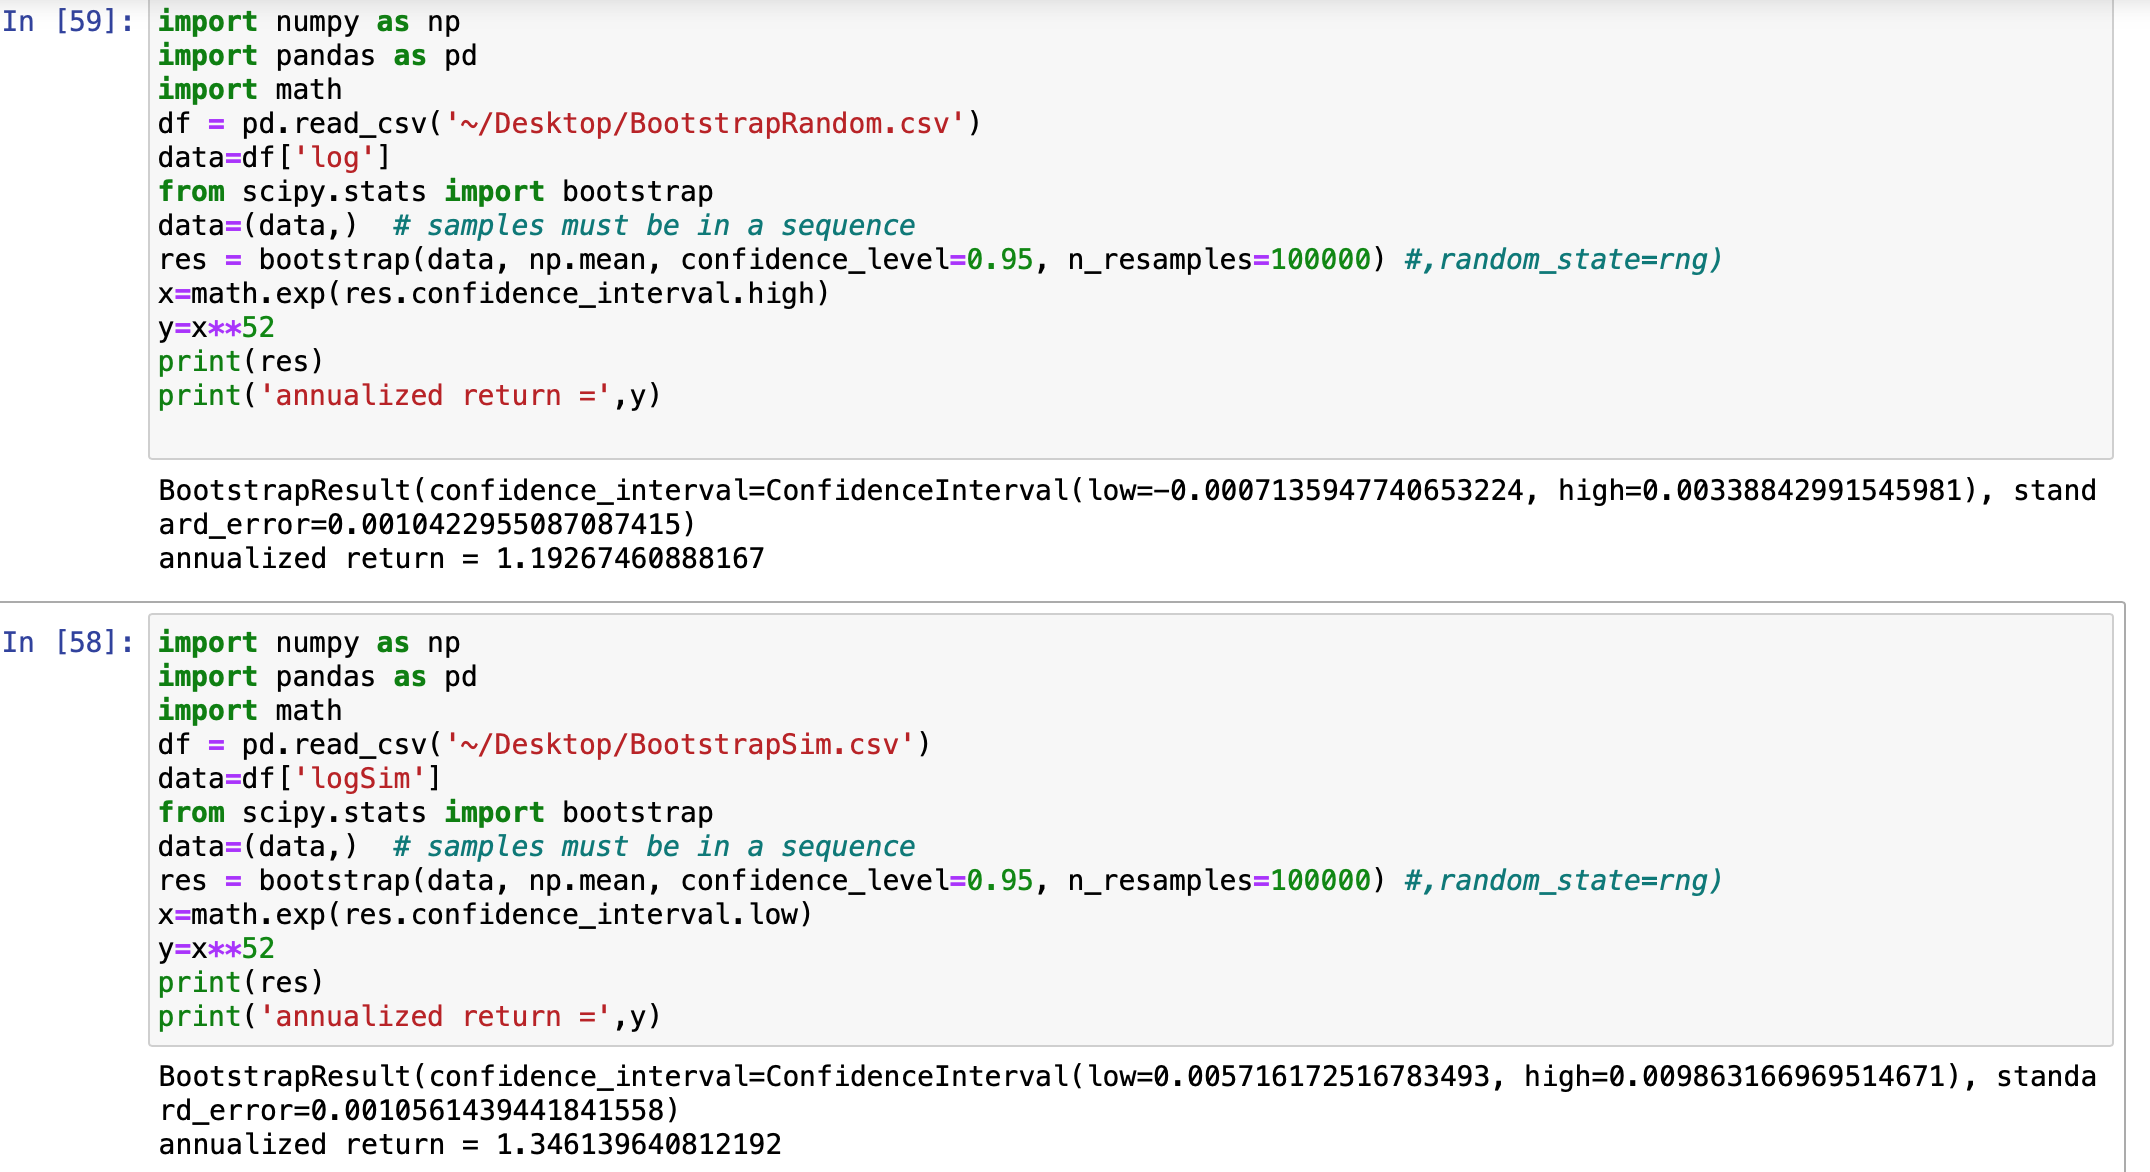
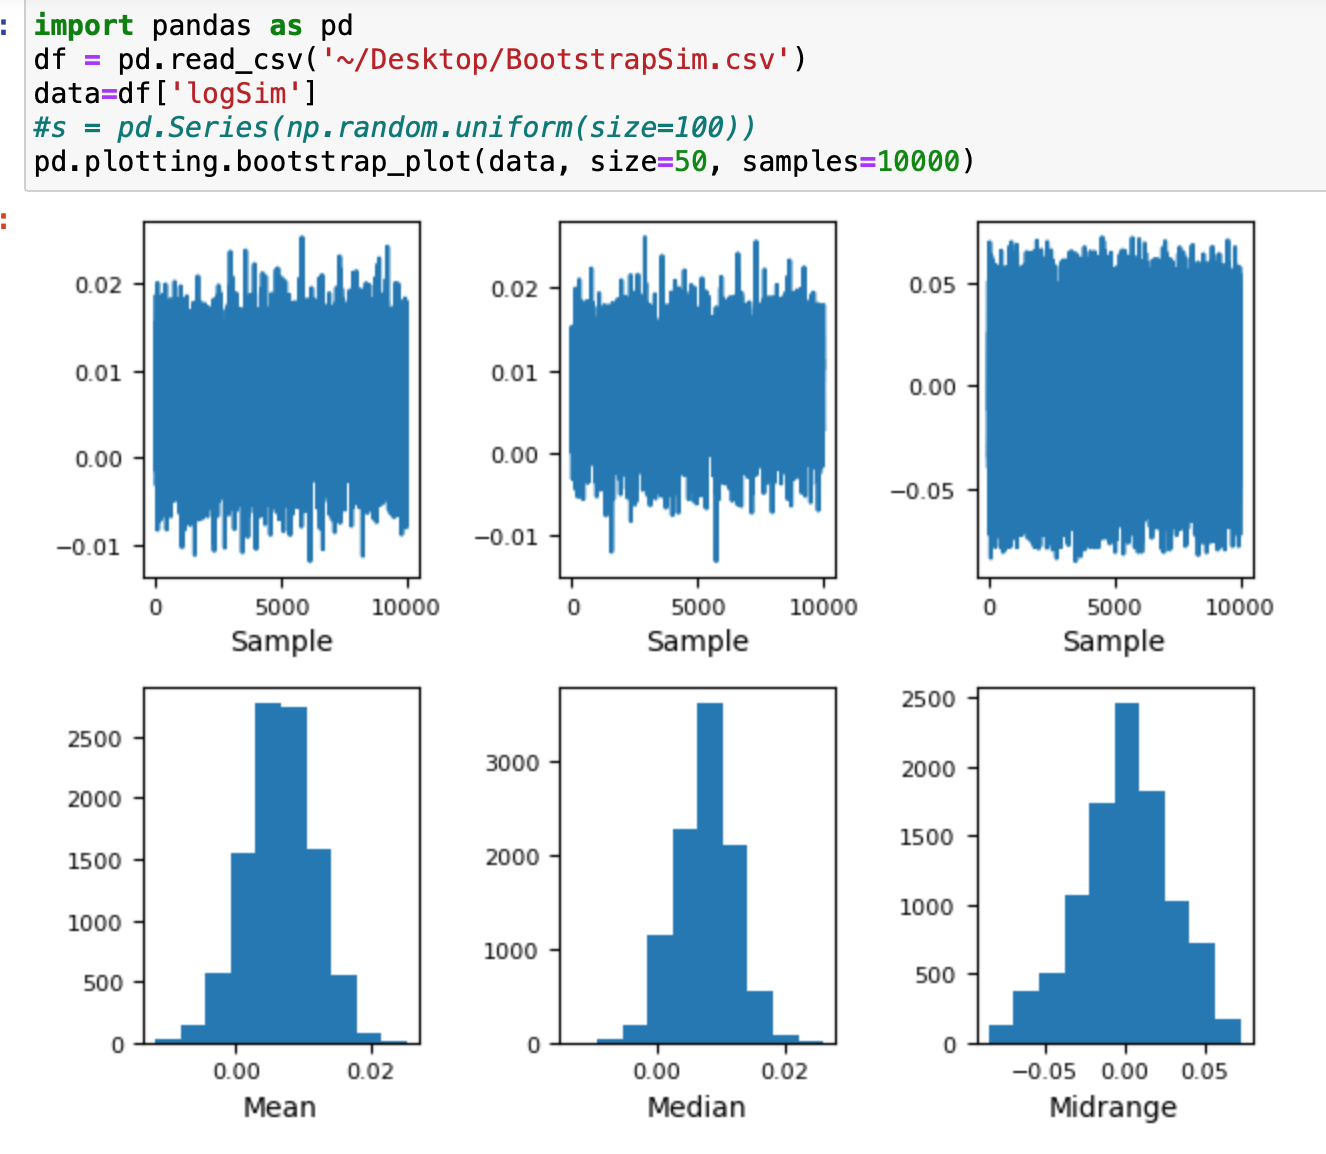
Here is the code with an example. The top code in the image is for the random sim which gives 19% annualized return and the bottom code is for the same sim with a real ranking system which gives 35% annualized return (both are bootstrapped results). The lower confidence-bound for my sim was above the upper confidence-bound for a random ranking system which can be said to be not-a-bad-thing. This does not imply the sim is any good obviously. Port results—including designer models–would be more realistic for a lot of reasons! I do not just agree with that but I assert it here. This sim just did not fail this particular test. Set your own confidence intervals (e.g., use a Bonferroni correction with multiples tests) and add your own tests if you use this:
Edit: We should ask P123 to keep track of how many designer models are opened (including any later closed).
We could then use a Bonferroni correction (and the Bootstrapped T) to determine which models are statistically superior using any machine at home–even if the laptop I am now using lasts. Or not. Maybe I will just use my own models (which I can test thoroughly: see above for an example of one test I have already run). BTW, I already get it. I need wider confidence intervals for my own models.
Weren’t we able to upload spreadsheets at one time? Here are some screenshots.
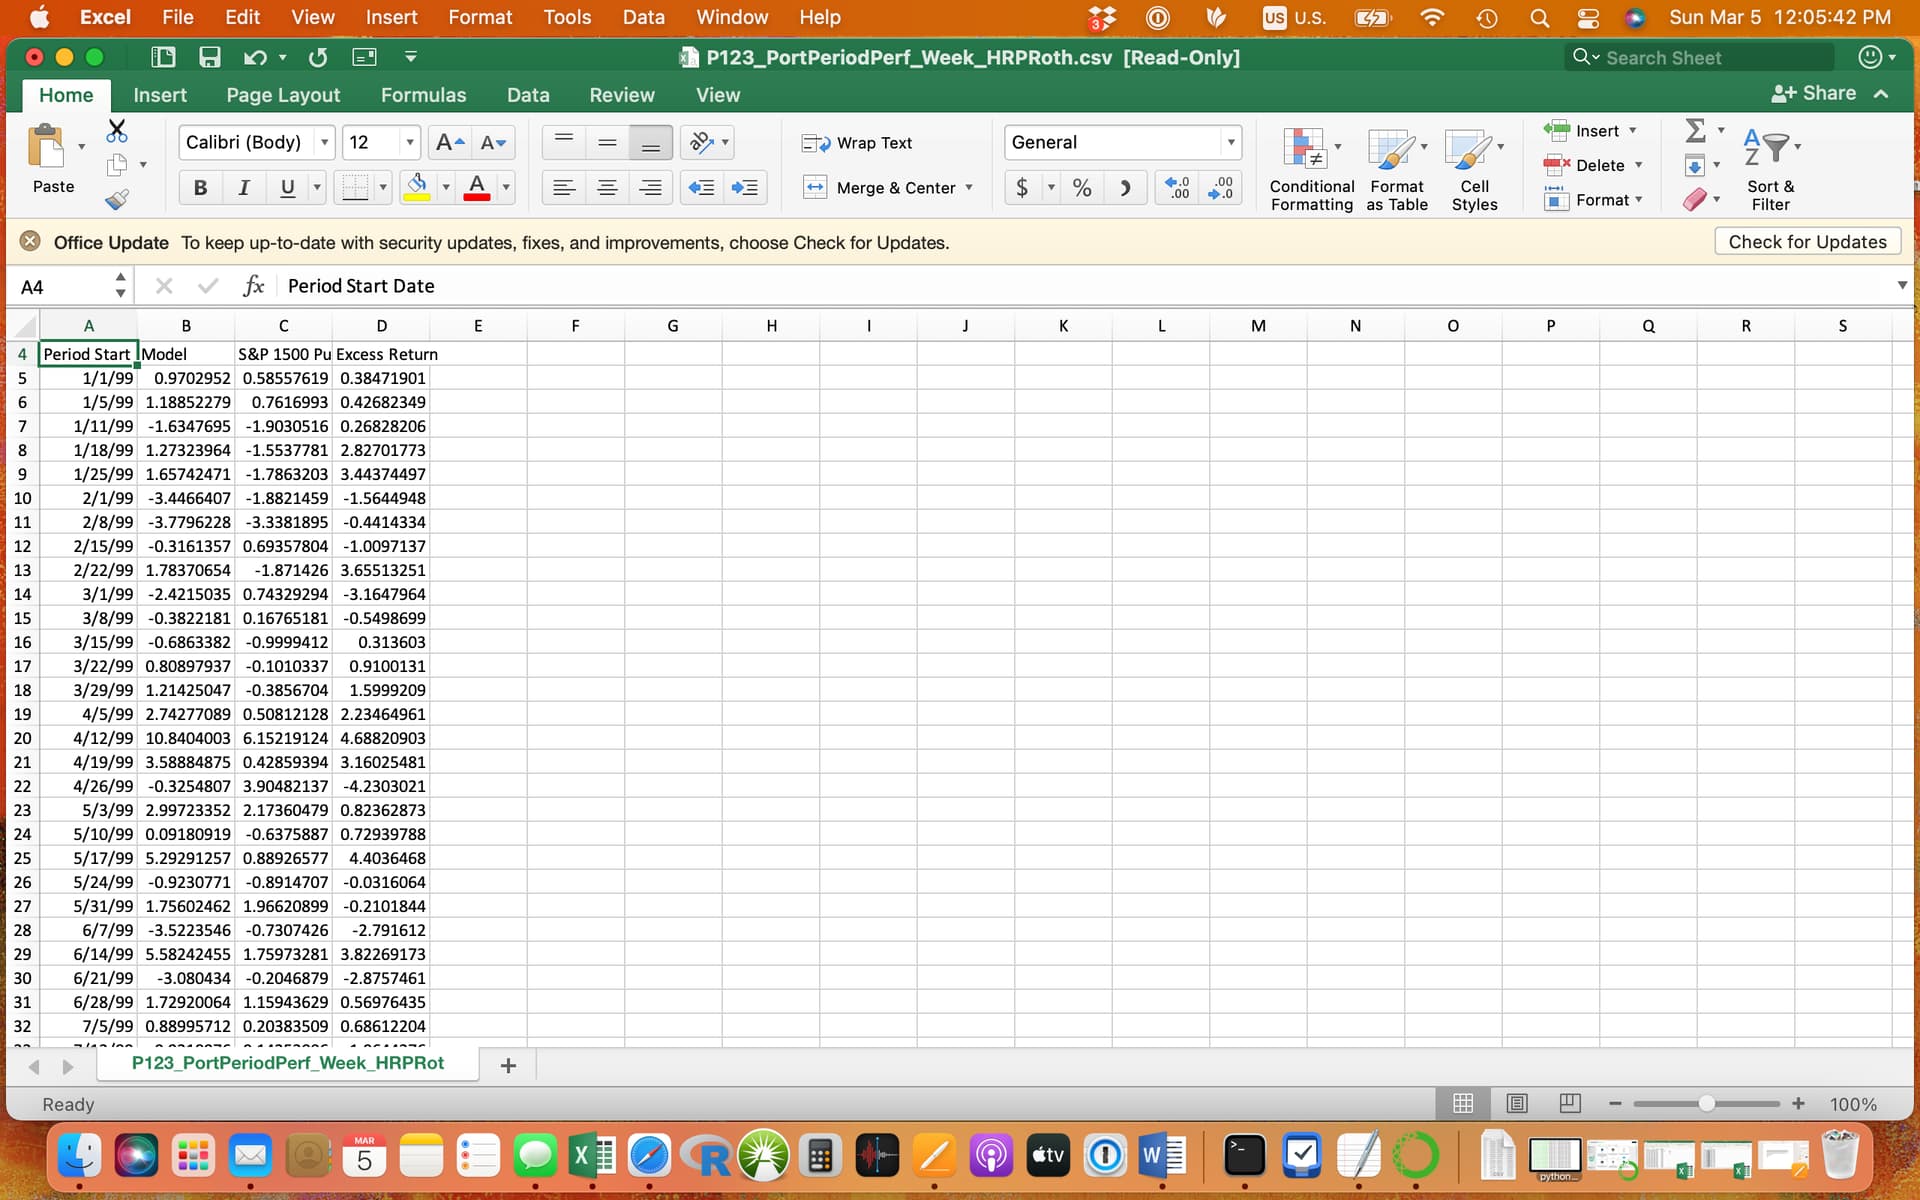
First, I just went here under “statistics” for my sim if you can find that and clicked the download button (I used weekly data that gives over 1200 rows which may not be bad I think). You can download daily data at a different place.
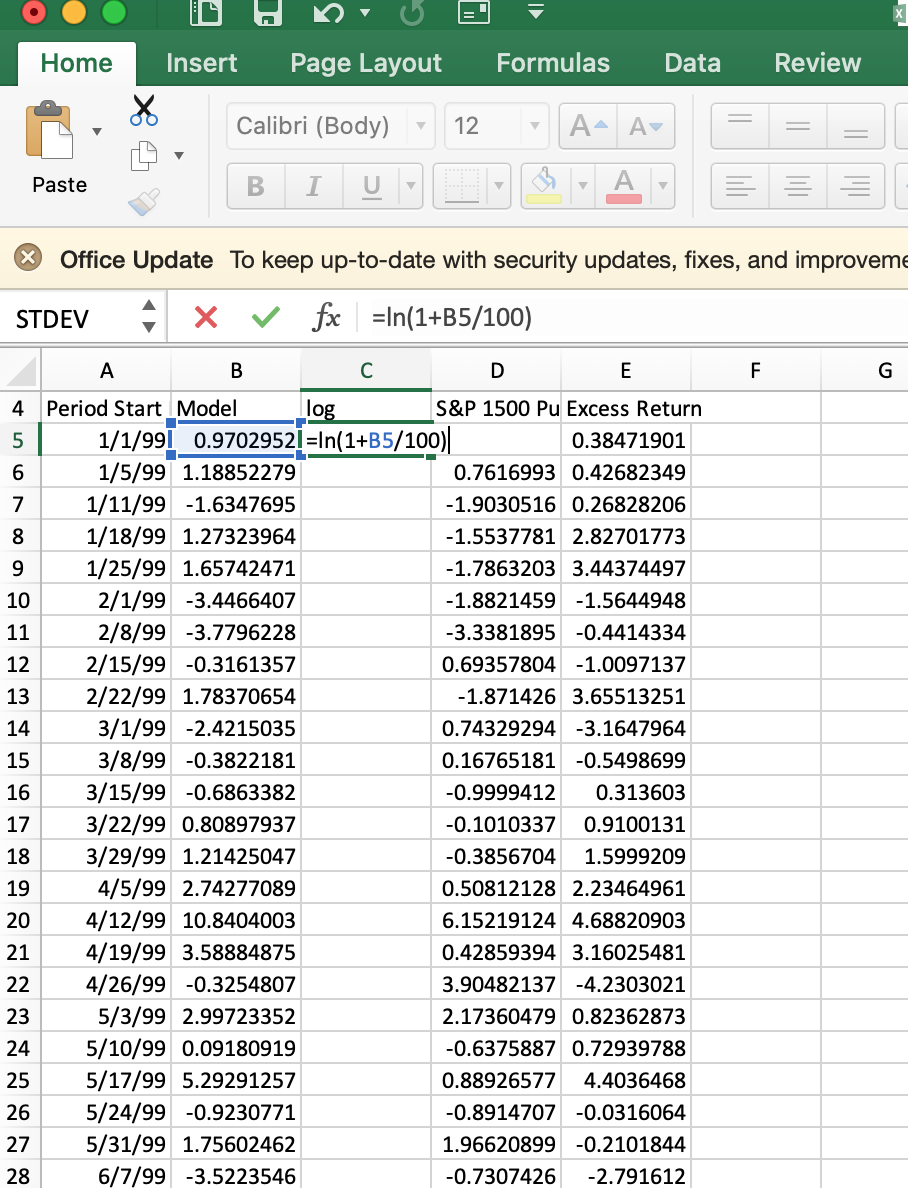
I make a new column with the header ‘log’ or ‘logSim’ in the example for the random ranking system and the one with the real ranking system respectively. This screenshot is the spreadsheet for the real ranking system. This spreadsheet has the equation in the log column. I think the download returns are in percent which explains dividing the B5 cell by 100:
Save it in the appropriate directory for your Python code. That is BootstrapRandom for the random ranking system and BootstrapSim for the sim with the real ranking system on my computer.
Run the Jupyter notebook. Simple maybe but that is how bootstrapping is done, as you know. It is probably better than t-tests for financial data. It gives one a dose of reality, if nothing else. And it is clearly superior to believing that the idea that your backtests are likely to continue unabated into the future has any scientific basis whatsoever.
And if you make the confidence interval large enough you will be right for sure
Easier I guess. But if you have an M2 Max chip why would you do that?
I often use 300 stocks in the screener for some things (in other words I like you idea a large number of stocks e.g., 200 stocks). More stocks does stabilize the statistics. The model I use for most of my money has 30 stocks which is separate thing supporting your idea of using a large number of stocks to get something realistic.
When I was looking at boosting (not bootstrapping) it took 500-600 minimum leaf size to get something stable (kind of unheard of). Again, supporting your idea.
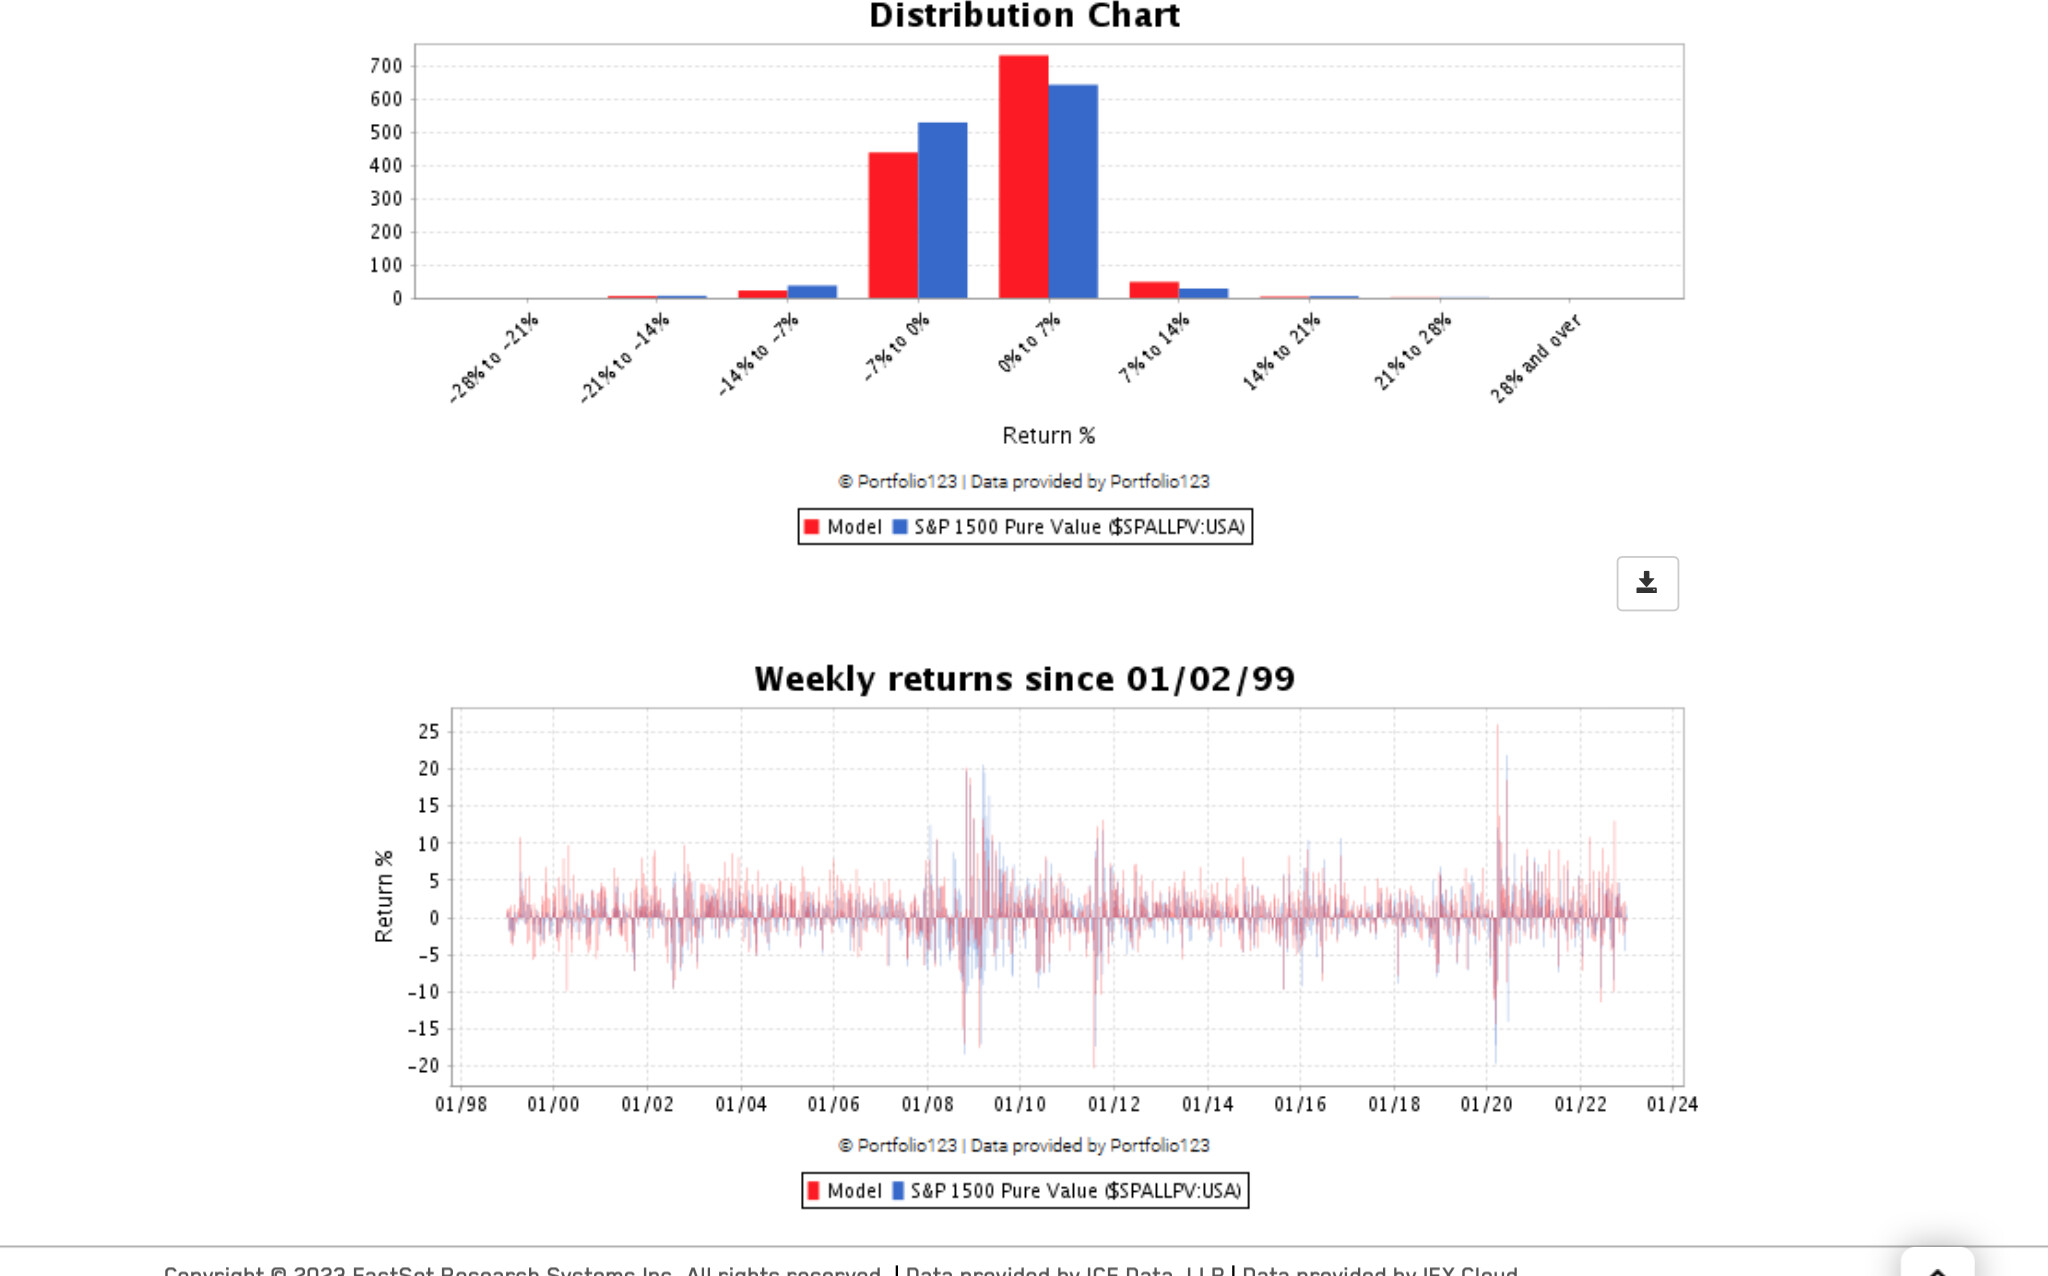
For those interested the bootstrapped samples can be plotted in a histogram with this code. I do think this is an accurate representation of what one can expect out-of-sample—even over long periods—with the lower range being more likely in optimized models. This is a 30 stock model: