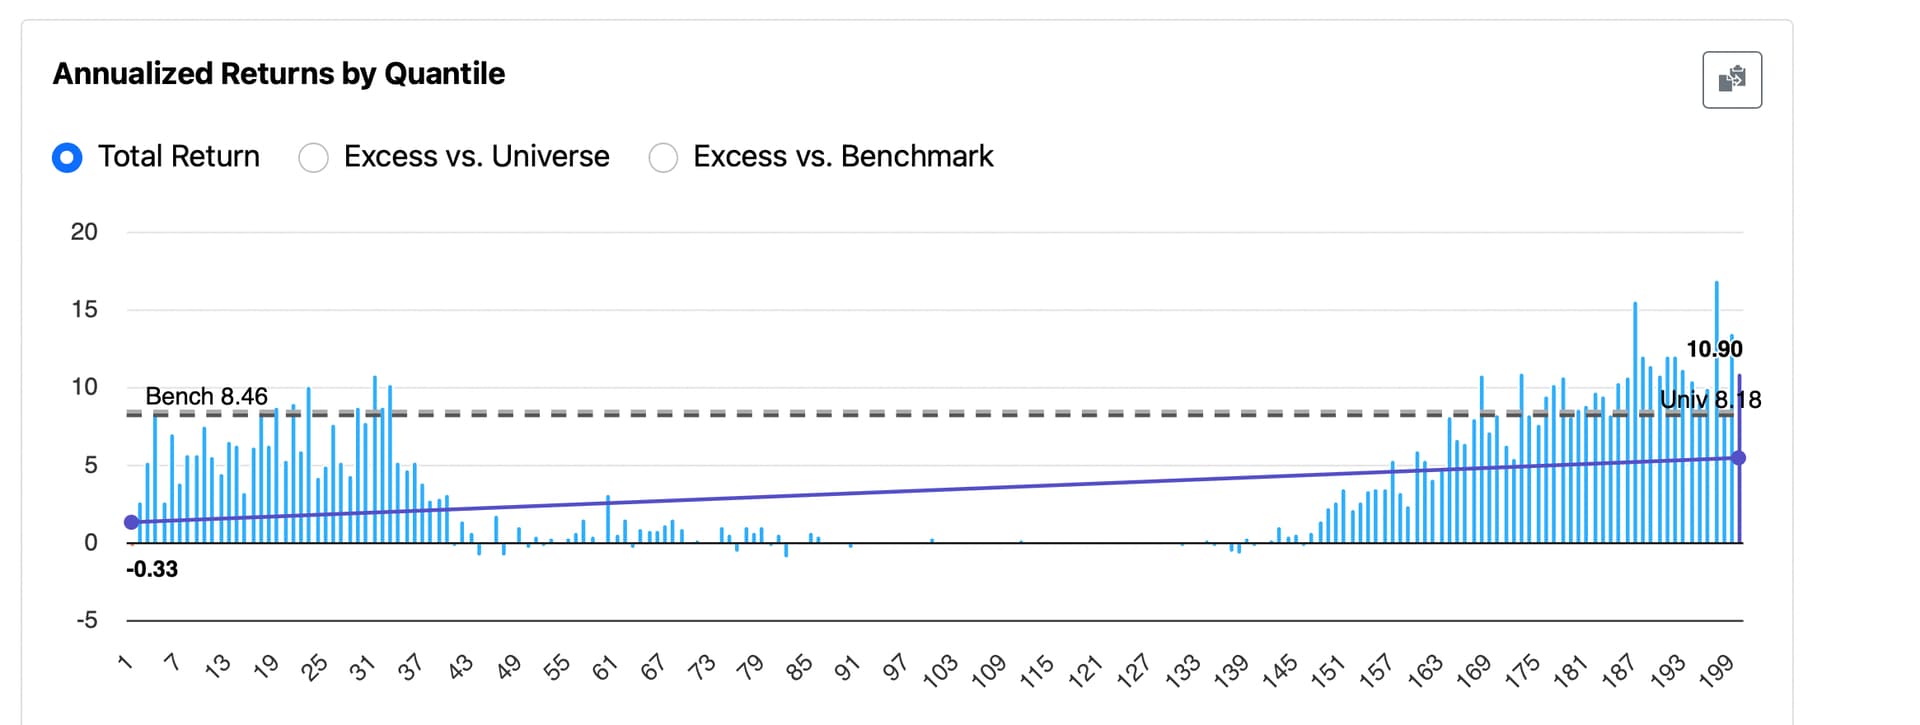
I’ve been trying to understand why certain features show performance like this in the Rank Performance Test. Here’s an example for “Changes in Recommendation” (from P123’s Core Ranking System):
The top-ranked buckets appear to perform well, but when I use ElasticNet regression or other ML methods, the feature gets discarded—likely due to non-linearity and bias (usually skewed negative).
Now I think I understand why.
Some buckets have zero stocks during certain rebalance periods. Here’s Bucket 40, for example—highlighted is the stock count at the final rebalance, showing zero stocks:
That may be due to a high proportion of NAs in the feature. It also helps explain why middle buckets sometimes show anomalously flat or zero returns—those buckets can simply be empty.
P123 can certainly keep the current setup if they wish. For my purposes, I can now work around this with dithering—and potentially improve it further with more decimal precision (to ensure the dithering doesn’t shift true rank order).
Thanks to @yuvaltaylor for this post, which helped clarify the cause for me:
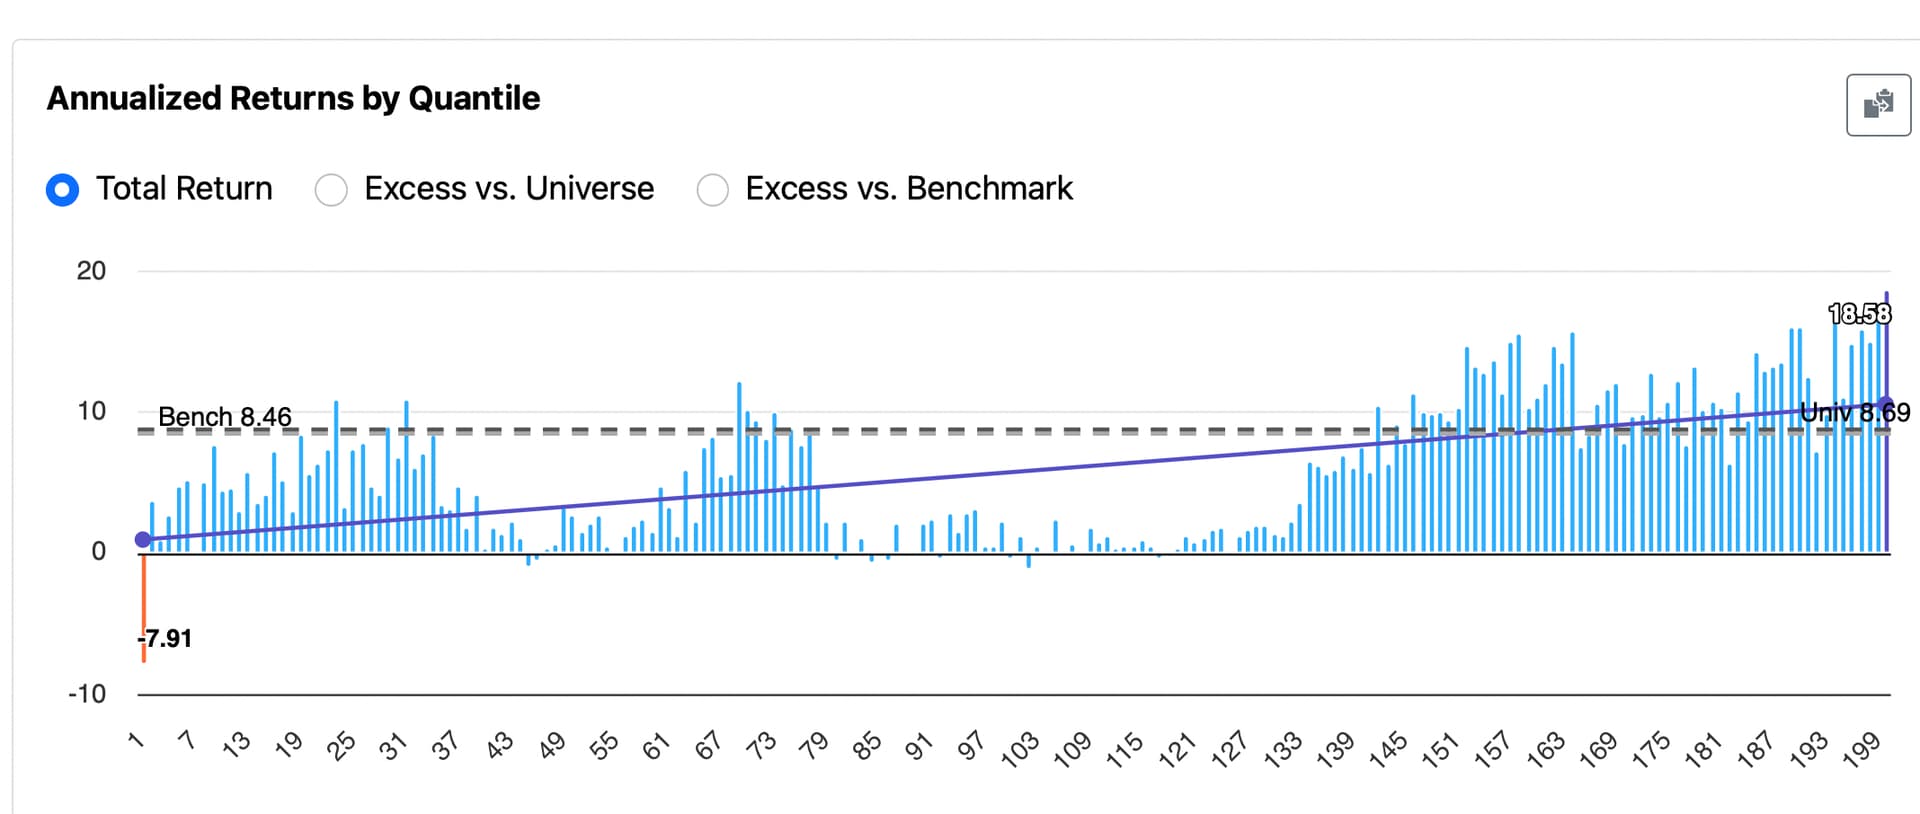
BTW, here is the Changes in Recommendation feature dithered:
Yes this happens with a number of factors. sometimes it is NA but often it is just that there are no changes or it is data that for example refreshes monthly.
I’ve looked into this more deeply and agree with SZ: ties frequently occur—even when there are no NAs. For example, features based on earnings revisions can result in many identical raw values when estimates haven’t changed, leading to large tie groups.
To address this, here’s an example of a formula that breaks ties deterministically:
FRank("pr52w%chgind", #All, #DESC, #NANeutral, #Neutral) + Mod(stockID,997)/9000000000
You can experiment with different Mod() values, but using a larger number helps reduce the number of “lucky Mod() ties.” The divisor should also be sufficiently large to ensure that the adjustment doesn’t interfere with the natural rank order, while staying within P123’s internal precision limits.
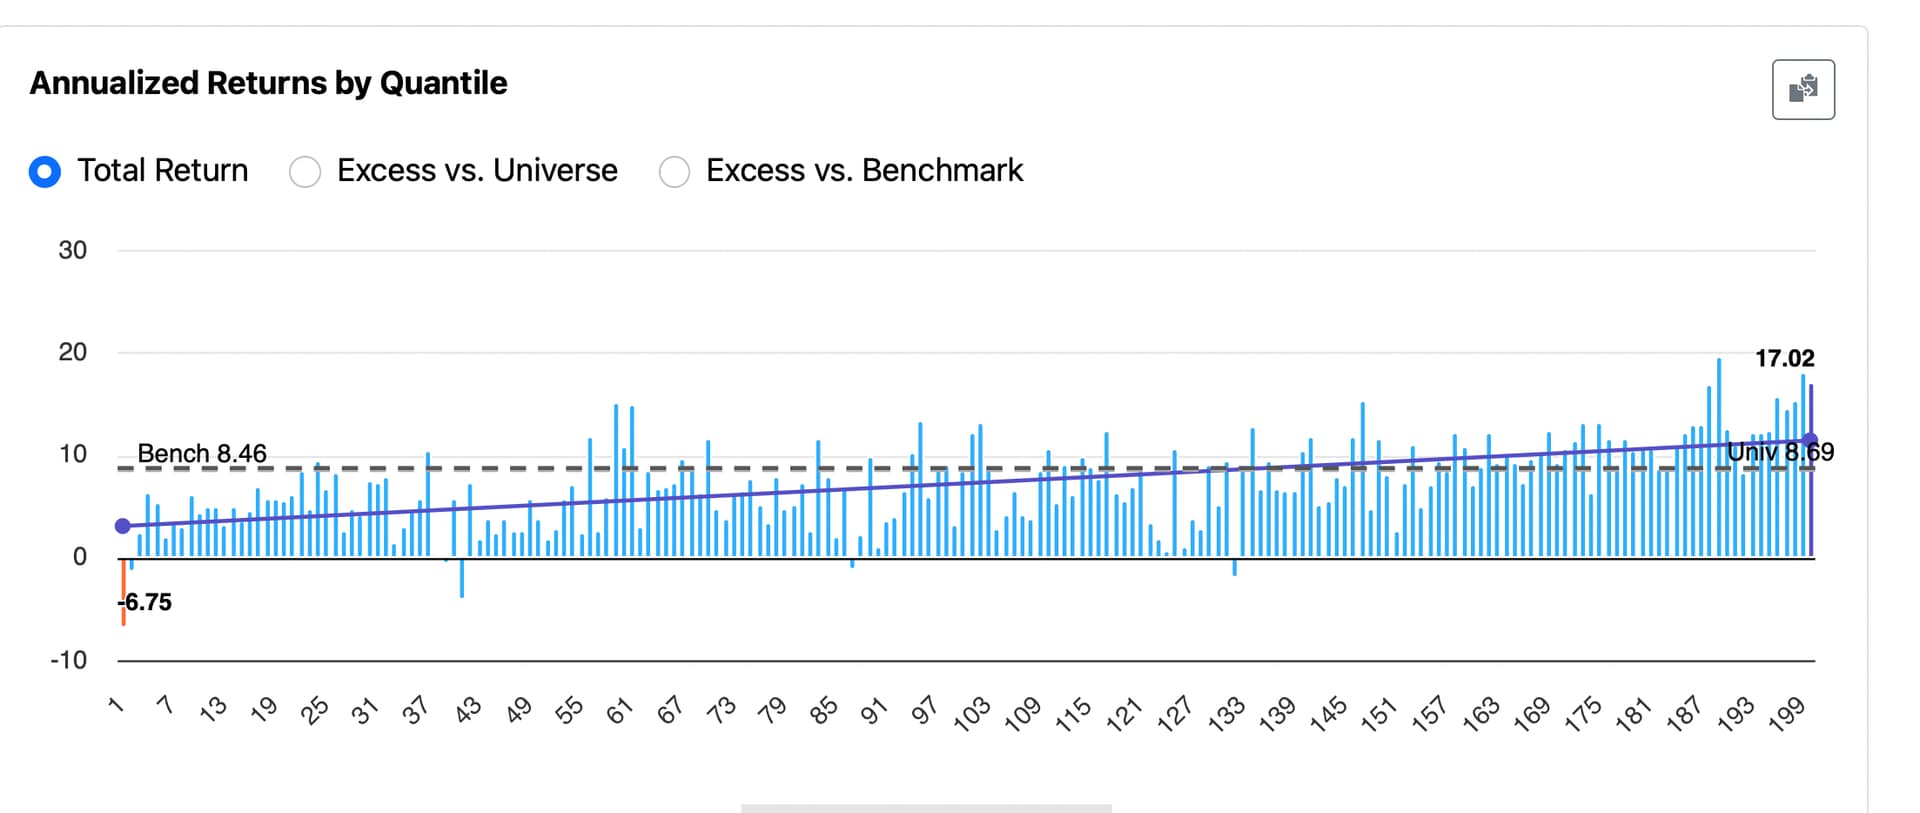
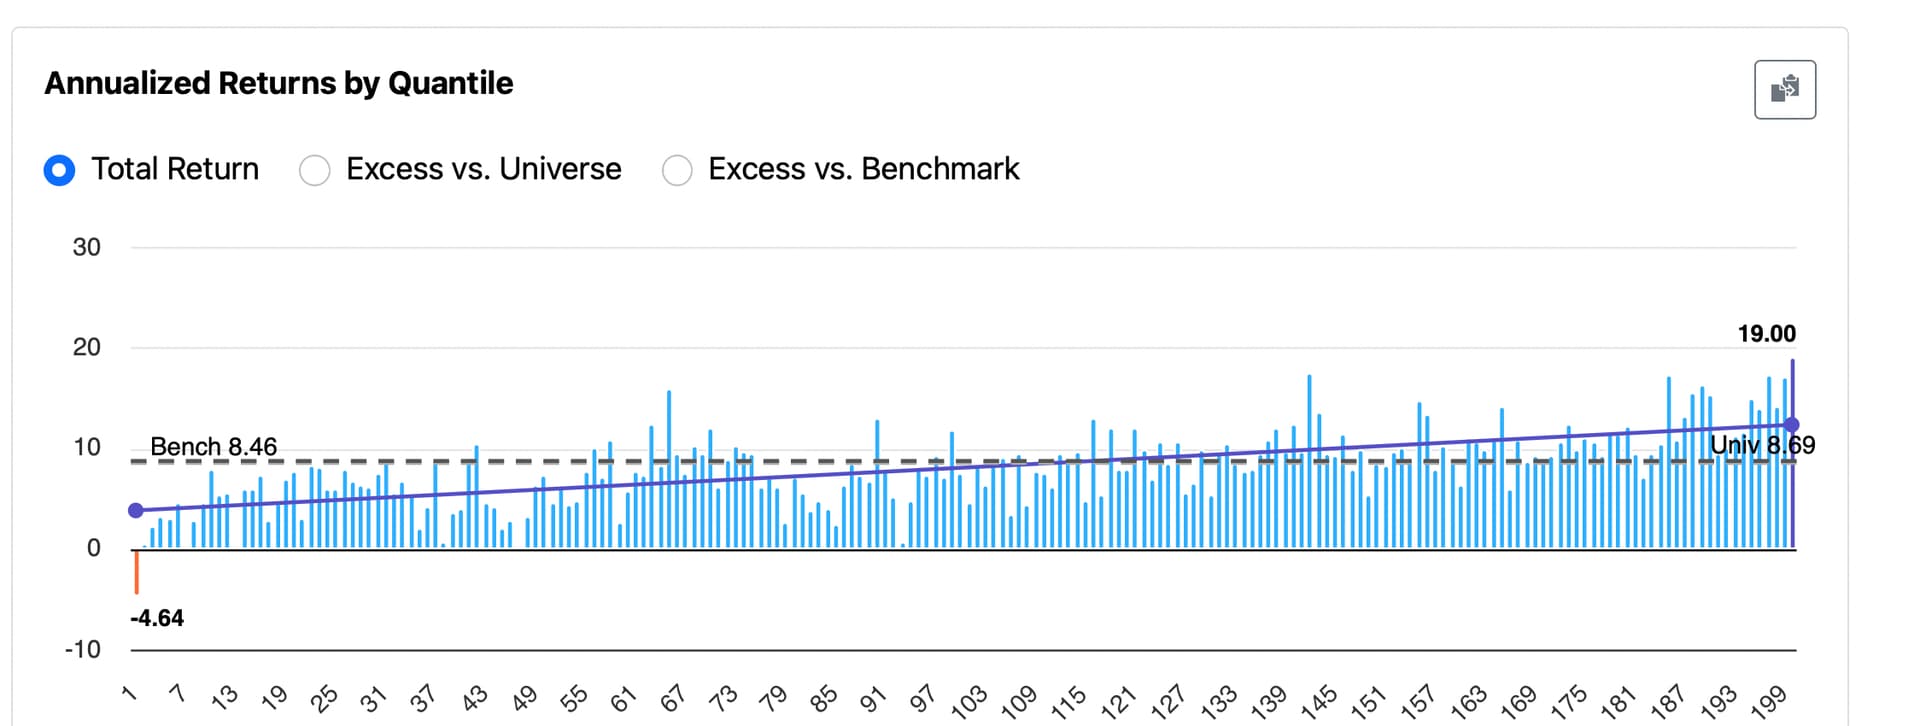
By applying Mod() to stockID, we can go from this (clumped ranks due to ties):
BTW, each buckets has close to an equal number of stocks if that is desirable for anyone.
Important note: This issue primarily affects the rank performance test, where zero-stock buckets can distort compounding due to tied ranks or NAs. It does not impact AI/ML model training or the underlying quality of stock selection in P123 Classic.
Ties can also influence the reproducibility of simulations and ports. However, tied stocks are equivalent in quality—based on the ranking system—so random selection among them does not affect model validity.
This is a non-issue for P123’s AI/ML, which remains highly effective and unaffected by any of this.
Thanks, what is the benefit of smoothing the results in practice? It always made sense to me in theory that there would be a lot of ties with unchanged data and NAs with some factors and when I see that in the results it makes sense to me as is. What are the issues with leaving it as is? I think this is also affecting some boolean setups for obvious reasons. Wonder if I should test something like this for some of my boolean tests.
Many users rely on the slope from the Rank Performance Test to gauge a feature’s usefulness. But ties and NAs can lead to buckets with zero stocks, which produce artificially low compounded returns and misleading slopes.
By applying a simple smoothing method—like FRank(...) + Mod(...)—you get a cleaner, more meaningful slope that better reflects the true relationship between rank and return.
If you’re using machine learning, these smoothed slopes will typically be closer to the coefficients you’d get from a multivariate regression without regularization, such as in P123’s AI/ML tools.
Even if you’re not using P123’s AI/ML, you can approximate this kind of feature weighting manually:
Set all feature weights in your ranking system to equal. Record the baseline results.
For each feature, apply the smoothing method and run the Rank Performance Test.
Record the slope for each feature.
Reweight your ranking system using these slopes.
Re-test the system.
This isn’t a replacement for ElasticNet—it doesn’t regularize or handle multicollinearity—but it’s a simple, effective way to apply ML logic directly within P123 Classic.
Importantly, it helps correct spurious outlier values caused by zero-return buckets. These aren’t just outliers—they’re spurious data points when interpreting slope as a regression estimate in the rank performance test. If you’re already taking steps like winsorizing to remove outliers, this is another useful tool to remove spurious noise from the Rank Performance Test.
Let me know if you try it—or if you’ve used Rank Performance Test slopes in other ways. I’d love to hear what you find.
Let's say you're just testing one factor, for example, FCFYield. Then in the universe you're using in the Rank Performance tool, add the line FCFYield != NA. If you're using a pre-built universe, you'll need to create your own universe with that rule. Then, when you want to test another factor, you'll have to change the rule in the universe.
Yuval, thank you! I’ll look into removing NAs—but is that all I need to do?
I think this is the simplest way to frame my core question:
If I download the rank performance results (which I can easily do) and want to run a regression of return vs. bucket, would I be better off:
Removing the zero-return buckets before running the regression?
Imputing the median return of the universe for those buckets and including them in the regression?
Or is there a better option I haven’t considered?
This cuts through the complexity (jittering, dithering, etc.) and gets to the heart of the issue. It can all be done after removing NAs or applying any other data cleanup steps, which may be side issues if zero-return buckets still remain.
I’m happy to implement the final solution myself—just looking for any additional ideas on how to get the most accurate and reliable slope calculation.
To help start the discussion, here’s the last comment I got from ChatGPT on this:
Just to clarify: the zero-return buckets in the rank performance test don’t correspond to actual stocks—they’re simply empty bins. But during live trading, a stock could fall into that rank range. Removing those buckets may bias the slope upward by ignoring rank regions that typically produce average (rather than extreme) returns. Imputing the median return for those buckets might be a more conservative and realistic approach that avoids overstating expected return. That’s our current thinking—but definitely open to other perspectives or refinements if anyone sees it differently.
That seems similar to what dithering does, but in a more complex way. If ChatGPT’s reasoning above is correct (and it may not be), the only real advantage of dithering might be to reduce the manual workflow required for extracting the slope from the rank performance test. Imputing median returns may be a simpler and more intuitive way to handle it—at least for some—if it turns out to be the most appropriate method among the three listed above.
I'd say it all depends on what the purpose of running a rank performance test of a single factor is. I think if you take different purposes you'll come up with different answers. In some cases it might be best to keep the NAs in there, even though you get empty buckets, because then you favor factors with few NAs (since empty buckets will tend to lower the slope). On the other hand, if you're looking at the effectiveness of analyst-related factors, there's no point in including a bunch of stocks that aren't covered by analysts. I like the approach of using median return for empty buckets too, which would certainly fit certain scenarios well. This brings up another question: how much work do you want to do, and is the work worthwhile? So there's no easy answer to your questions.
I had good results so far with classic NA_negative handling in my multifactor rankings. This way I make it more difficult for stocks with a lot of NA's e.g. in analyst data to get into the portfolio while still considering them. This is worth gold especially in Europe Microcaps. In my ExUS strategy, many stocks withou analyst coverage make it through but they always are on closer watch. Excluding them caused problems due to - let's call it - universe noise...
And currently - if I recall correctly - the tie handling in this case will assign RankMax, meaning:
If only 30% of stocks have data in this factor, they get ranked 100 to 70 and all NA's get ranked 70. I like that because it adds a layer of "benefit of the doubt" depending on the completeness of the dataset. Still would be nice to have other options here to test (assigning 35 (median) or 0 (min) in the example).
Either way, I was also not amused at first seeing the NA/tie handling in ranks but imo that's mainly a problem of single metrics ranking. In composites, I actually am not sure if I would want jittering of single subrank metrics.
If you don’t want to use RankMax, you can override that behavior like this:
Instead of using [your feature] directly in a node, wrap it with: FRank("[your feature]", #All, #DESC, #NANeutral, #Neutral)
There are lots of ways to approach this. One alternative is to download the Rank Performance Test results, remove the zero-return buckets, and average the returns of the remaining buckets that contain stocks. Annualize that of course and impute that value. Get the slope in Excel. That might give you the insight you’re looking for: even if a bucket is often empty, when it does contain stocks, this is the most likely return.
That said, there are other great approaches I’m still exploring.