When you click on the “pick any date range” icon and try to select dates the charts don’t work in both portfolios and books live and simulations.
It has been like this for a while and weird that no one else has complained. I tried in both IE and Chrome.
I just noticed it yesterday. It’s definitely broken.
Walter
Confirmed. Thanks
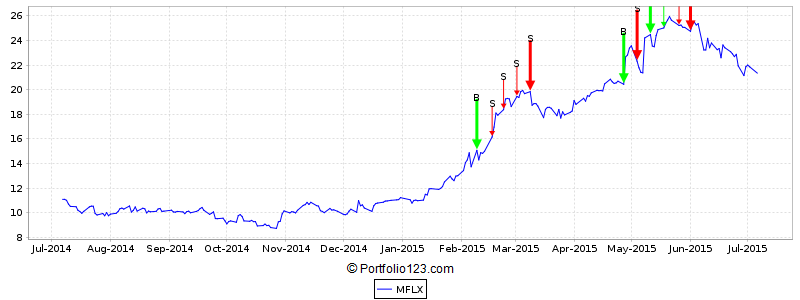
While on this subject, the red and green arrows indicating buy and sell points on the pop up charts are still broken (since the UI redesign) as well…
The arrows seem ok. If very old transaction you may need to click on a 3Y period or even MAX. If that doesn’t work please show us an example. Thanks
Probably too much trouble to fix the clipping. I’ll ask the programmers.
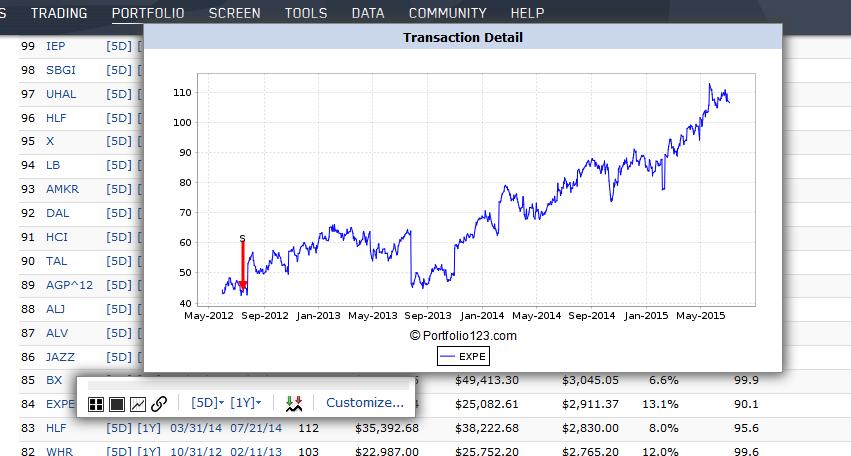
The missing arrow… which port?
I set up a sim- “JanuaryEffect - Arrows Bug”
See Transactions Realized → symbol “WHR” for instance, hover mouse cursor over the graph+arrows symbol & click.
Btw, I am using Firefox 38.05 under windows 7 home premium Svc pack 1.
Click on 3Y and you will see the buy arrow. The chart (and the popup chart) do not adjust for efficiency reasons.
Is there an ETA for this bug?
Thanks,
Walter
custom range is back
Confirmed that it works as expects.
Thanks,
Walter
Charts are not working when you try to select dates using the calendar icon. Preset 1yr, 3yr etc work.
Hi, The dev group has been informed. Thanks for reporting.
Which charts?
Charts in Live and Simulated strategies and books are the only ones I have checked, but they all have this issue.
Problem was fixed. Not sure it's live. tomorrow for sure.
Currently we're working on fixing the AI Factor issues.
Thanks for reporting it