Is there an easy way to extract my historical transactions and then get the close of the day before the transaction took place for example (without doing them one by one)? Basically I want to compare cost I paid versus last close to assess if the slippage I am assuming is realistic or not.
Not an easy way, no, but there is a complicated way. First, download all your transactions into an Excel file. Then create a .csv file with dates, values, and tickers and upload it as an imported stock factor. For each buy on each trade date assign the ticker a value of 1; for each sell assign it a value of 2; then add 1 to every single date and assign all the tickers a value of 0 on those dates. Then run a simulation using "Previous close" as the price for each transaction with a daily rebalance. Let's say your imported stock factor is called $$trans. Then your buy rule would be $$trans=1 and your sell rule would be $$trans=2. Your transaction record for the sim should match the closing prices on the dates prior to the transactions.
I haven't tried this myself but I think it should work if you want to put in the effort. If something about this is unclear, please reply and I'll try to clarify.
I use an Excel add-on called XLQ that lets you retrieve data for a given date and ticker. $159 to buy then $59/yr. But there are complications like dealing with splits which requires the more expensive xlq2 to get the split ratio or find an XLQ data provider that has split ratios.
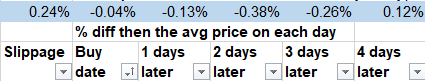
I download my transactions from a live Research strategy into Excel. These are my actual, accurate trade prices. Then I use XLQ to retrieve the Close price for the day before my trade date and the Open,High,Low and Close for the day of the trade and the next 4 days so I can determine the slippage on my trade vs the prior close and if prices generally move up over the next few days.
I did this last week using 5 years of Buy transactions from one of my live small cap strategies. I use .25 as the Slippage setting in my sims, so I was happy to see that my actual slippage on buy transactions was .24.
I think creating a tool on the site that analyzes past trades and provides this slippage analysis would be useful. It would read transactions directly from a live strategy (Research or Manage) OR user could import from a csv file in the event their strategies do not have their actual trade prices. I'll create a request internally, but please speak up if you think this is a high priority project.
This would be an incredibly useful project. I currently use TCA reports from my broker (IBKR) but they have significant limitations (don’t separate different algo parameterizations, can’t breakout by different p123 strategies in the same account).
Even just an option to download a transaction csv joined with configurable market data fields, e.g. the current quote, future returns, volume, etc, would go a long way and make excel/python analysis easier.
Thank you. However I am not very clear. I imported the excel file in factor and it gives me an excel with 4 columns (date, ticker, value, uid). I do not understand what is meant by: "For each buy on each trade date assign the ticker a value of 1; for each sell assign it a value of 2; then add 1 to every single date and assign all the tickers a value of 0 on those dates.". How should I do that?
Create a new .csv file. In column A put all the dates and in column B put all the tickers. Then copy those and below them put all the dates and the tickers again except this time add 1 day to all the dates. In column C put the values: 1 for buys, 2 for sells. And in the second half of the column, the one with the augmented dates, assign values of 0 to all of those. Then import that .csv file as a new imported stock factor. Does that make sense?