Another interesting thing about the #NOTE3YR series is that it is a monthly series; not a daily series like stock prices. That means that Close(63,#NOTE3YR) represents what interest rates were 63 months ago. 63 months is more than five years. There must be a reason why this simulation worked. If we figure it out why it worked in the past then we may have a clue if it will continue to work.
EDIT: Looking at a Macro chart of #NOTE2YR, change compared to 63 bars ago here, we see some correlation between short term interest rates and equity prices. Perhaps it’s a risk on risk off signal. The signal is not perfect but there seems to be some correlation.
Can somebody explain where the number 24182 comes from in Close(0,24182)/Close(63,24182). This should be a series in Close(barsAgo [,series]).
Also #NOTE3YR does not work for a 5 year backtest.
Where did you get the custom code for TLT? Same question as Geov. I have always used tickers, but this is a useful trick to get around formula nesting problems.
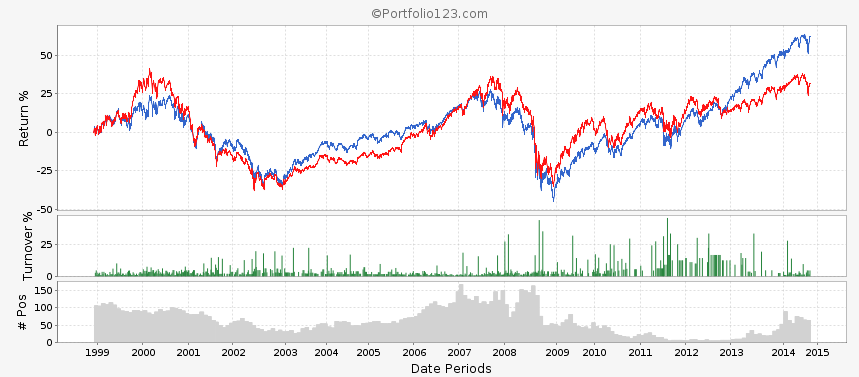
Just turn on rule 4 and then run and can see that the 3 Yr. Yield tended to track stock index movements until 2/2009. Then is stopped. Historically, we know that bond/stock correlations have varied widely over different subperiods. This is an expression of that.
If you turn on rule 1, can see the difference between the average SP500 stock and the 5 Year yield change in 3 year note. Anytime it’s positive it would be ‘long.’ Can go through and check this sector by sector (i.e. industrials, util, etc).
If turn on rule 5 only, get a potential market timing rule (3 month change of 10 year note vs. 3 month change of average stocks). Would have to play with it, but this is one way of ranking the market (likely smoothed with longer term average).
Rule six is a variation on the timing rule that looks at 3 month average SP500 change vs. 3 month synthetic 10 year note change.
wwasilev, many–if not most–great discoveries happened by accident including antibiotics and rubber.
George and Tom, you can find the series ID of any series by using ShowVar in the screener.
After sleeping on it, I realized a few things:
The second version (and wwasilev modification with #NOTE3YR) needed updated rules because of the changed RS. I corrected my public simulation. The corrected version has better drawdown but lower returns. The corrected version of wwasilev’s system is here.
A chart of Close(0,#NOTE3YR)/Close(63,#NOTE3YR) in the screener (the # of stocks in the chart below) shows that it happened to spike during the financial crisis. That may explain a lot. The bar was set much higher just at the right time. Any good hedge timing system would probably have done well.
(Parenthetically, it is interesting that short term rates spiked when they were needed to go down. That needs more investigation.)
Tom’s Custom Series is useful for new research but (I think) that it uses the daily time series of the interest rates which is not directly useful to analyze why the simulation worked.
I shared my results. If you discover anything directly from this research please let us know. Thank you.
I would not use a comparison of an ETF’s 2 month movement with the 5 year change in the yield on the 3 year note for much of anything. It’s a spurious correlation. There is no reason to expect this to be an effective short-term timing mechanism moving forward.
Can look up bond / stock correlations, I’ve posted these before. These aren’t stable over periods. The above is much less causally related then stock/bond pairings.
There are many timers you can build with the series I shared that at least have a stronger conceptual foundation. You can reset rebalance to weekly. These are the same data series the eval rule in your sim is using. You can look at them directly here.
Tom, I wouldn’t either. But for the purpose of taking apart the simulation and studying why it happened it was useful to me to study the original data. That’s how I learned that most of the value of that benchmark came from hedging the financial crisis, which points the way towards further improvements.
Stock/bond correlations vary. I did some research on this. Off the top of my head I seem to remember that stocks/Treasury bonds had negative correlations during bear markets and market corrections since 1987 but before that it was gold that was negatively correlated to stocks (my data goes back to the late 1960’s).
I played with this for an hour or two. I got to 15.5% returns with no buy rules and just the ‘risk on’, ‘risk off’ original ranking you had (comparing 3 months of LT treasuries to 3 months of everything else and using this as the ‘macro’ riskon, risky off switch. There is also something funky going on in the end of the month that your sell rule captures - that contributes a few % to the returns.
I actually did add one buy rule related to this.
So…this version has no signals with 3 Year note at all. This is much closer to tradable.
At first I thought that the ST interest rate surges (as price fell), were giving a nice ‘hurdle’ for every other equity instrument to have to be above - so a dynamic ‘momentum’ threshhold that makes it harder and harder to buy an ETF as the market surgest. However, this didn’t really prove to be the case.
I still think it’s a ‘spurious correlation’ type deal.