Companies that pay less income tax

Hi all,

I've been playing around with ways to test the hypothesis that companies that pay less (or more) tax outperform companies that pay more (or less), given the same level of profitability.

The way I approached this was to create 5 universes out of the Easy to Trade Universe as follows.

Frank("NetIncBXorTTM / asttotttm") >= 80
IncTaxExpTTM/ asttotttm

Basically, this looks at the 20% of companies with the highest net income relative to their assets and excludes companies for which income tax to assets is unavailable.

Then I would do the same for the next 20% of companies as follows.

Frank("NetIncBXorTTM / asttotttm") < 80
Frank("NetIncBXorTTM / asttotttm") >= 60
IncTaxExpTTM/ asttotttm

And similarly for the other 3 subuniverses.

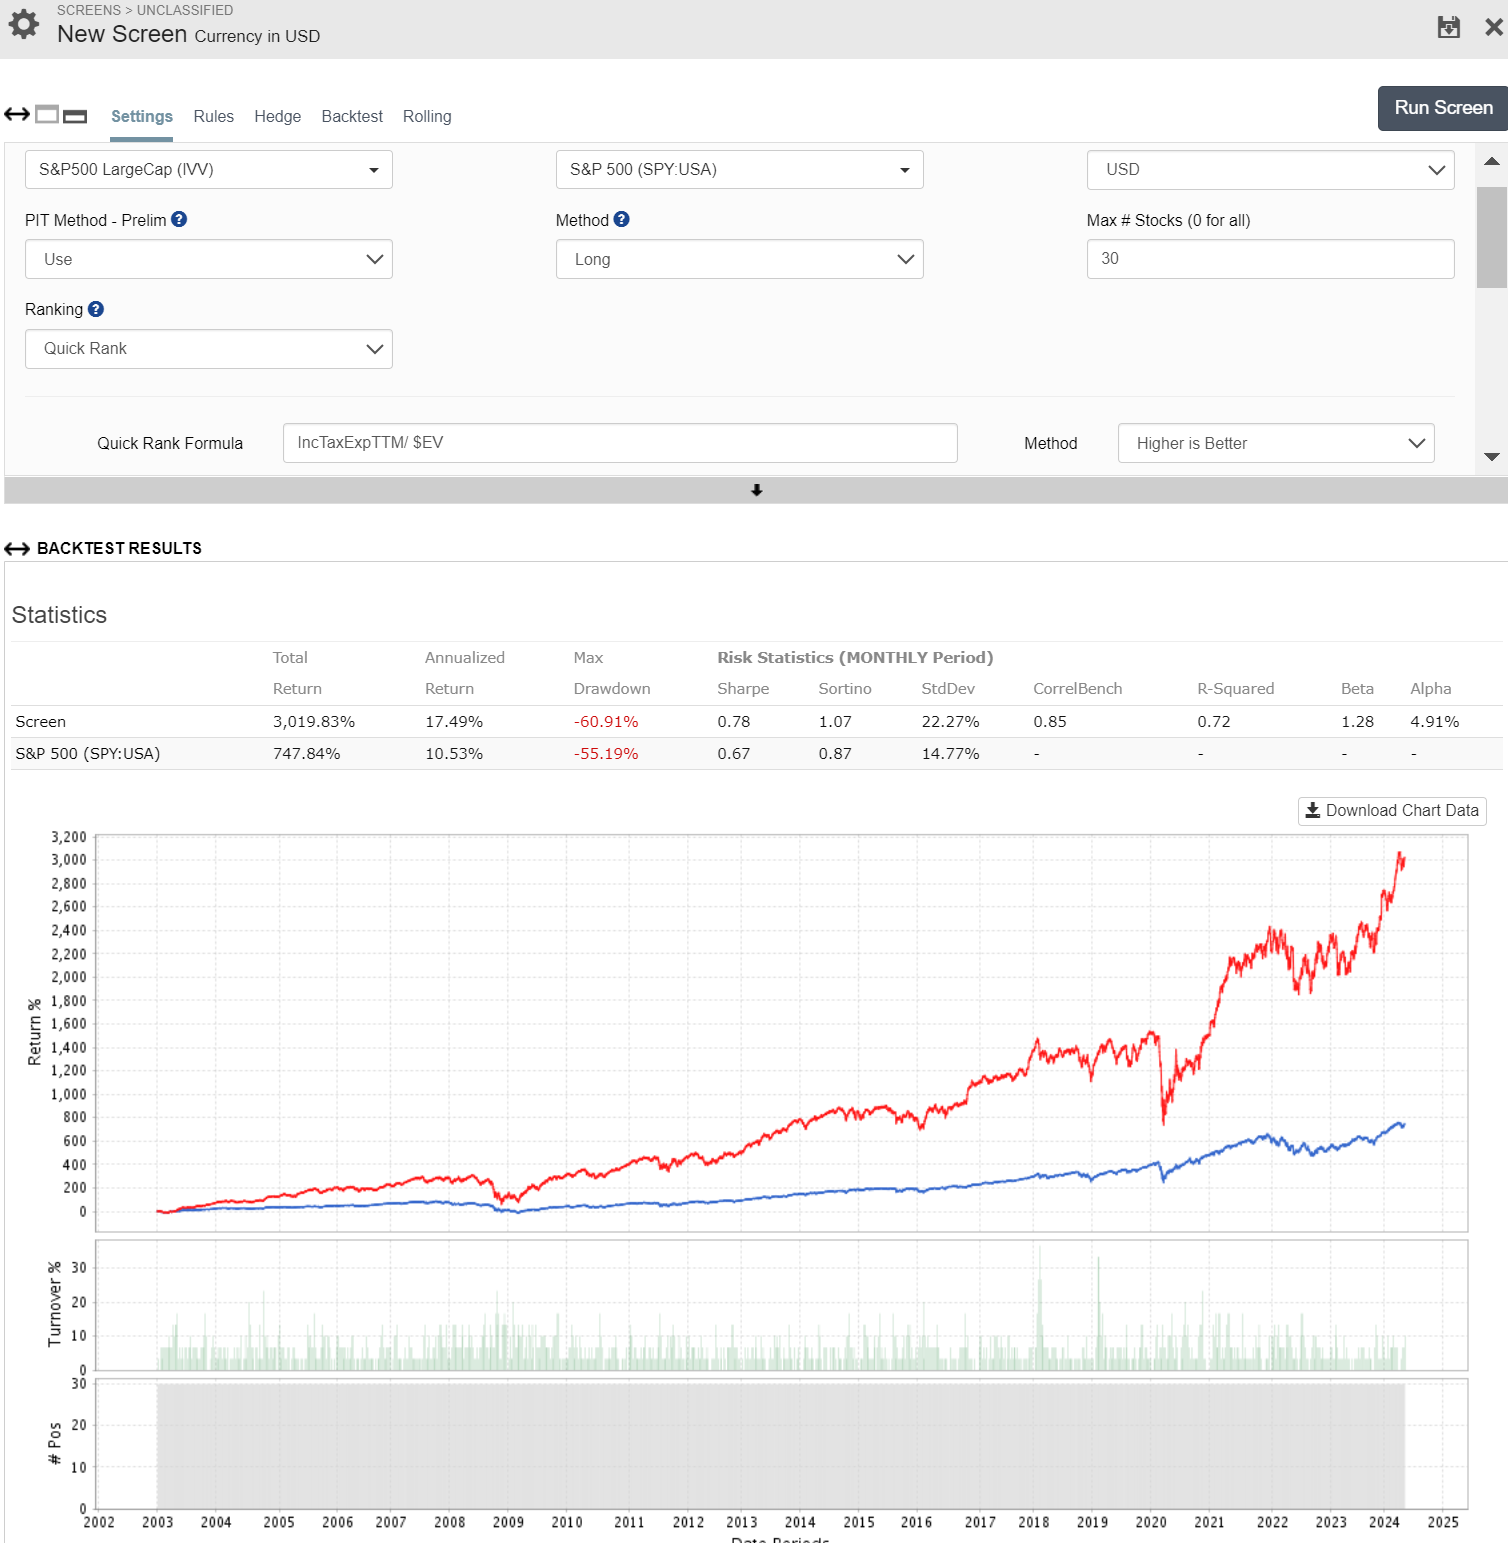
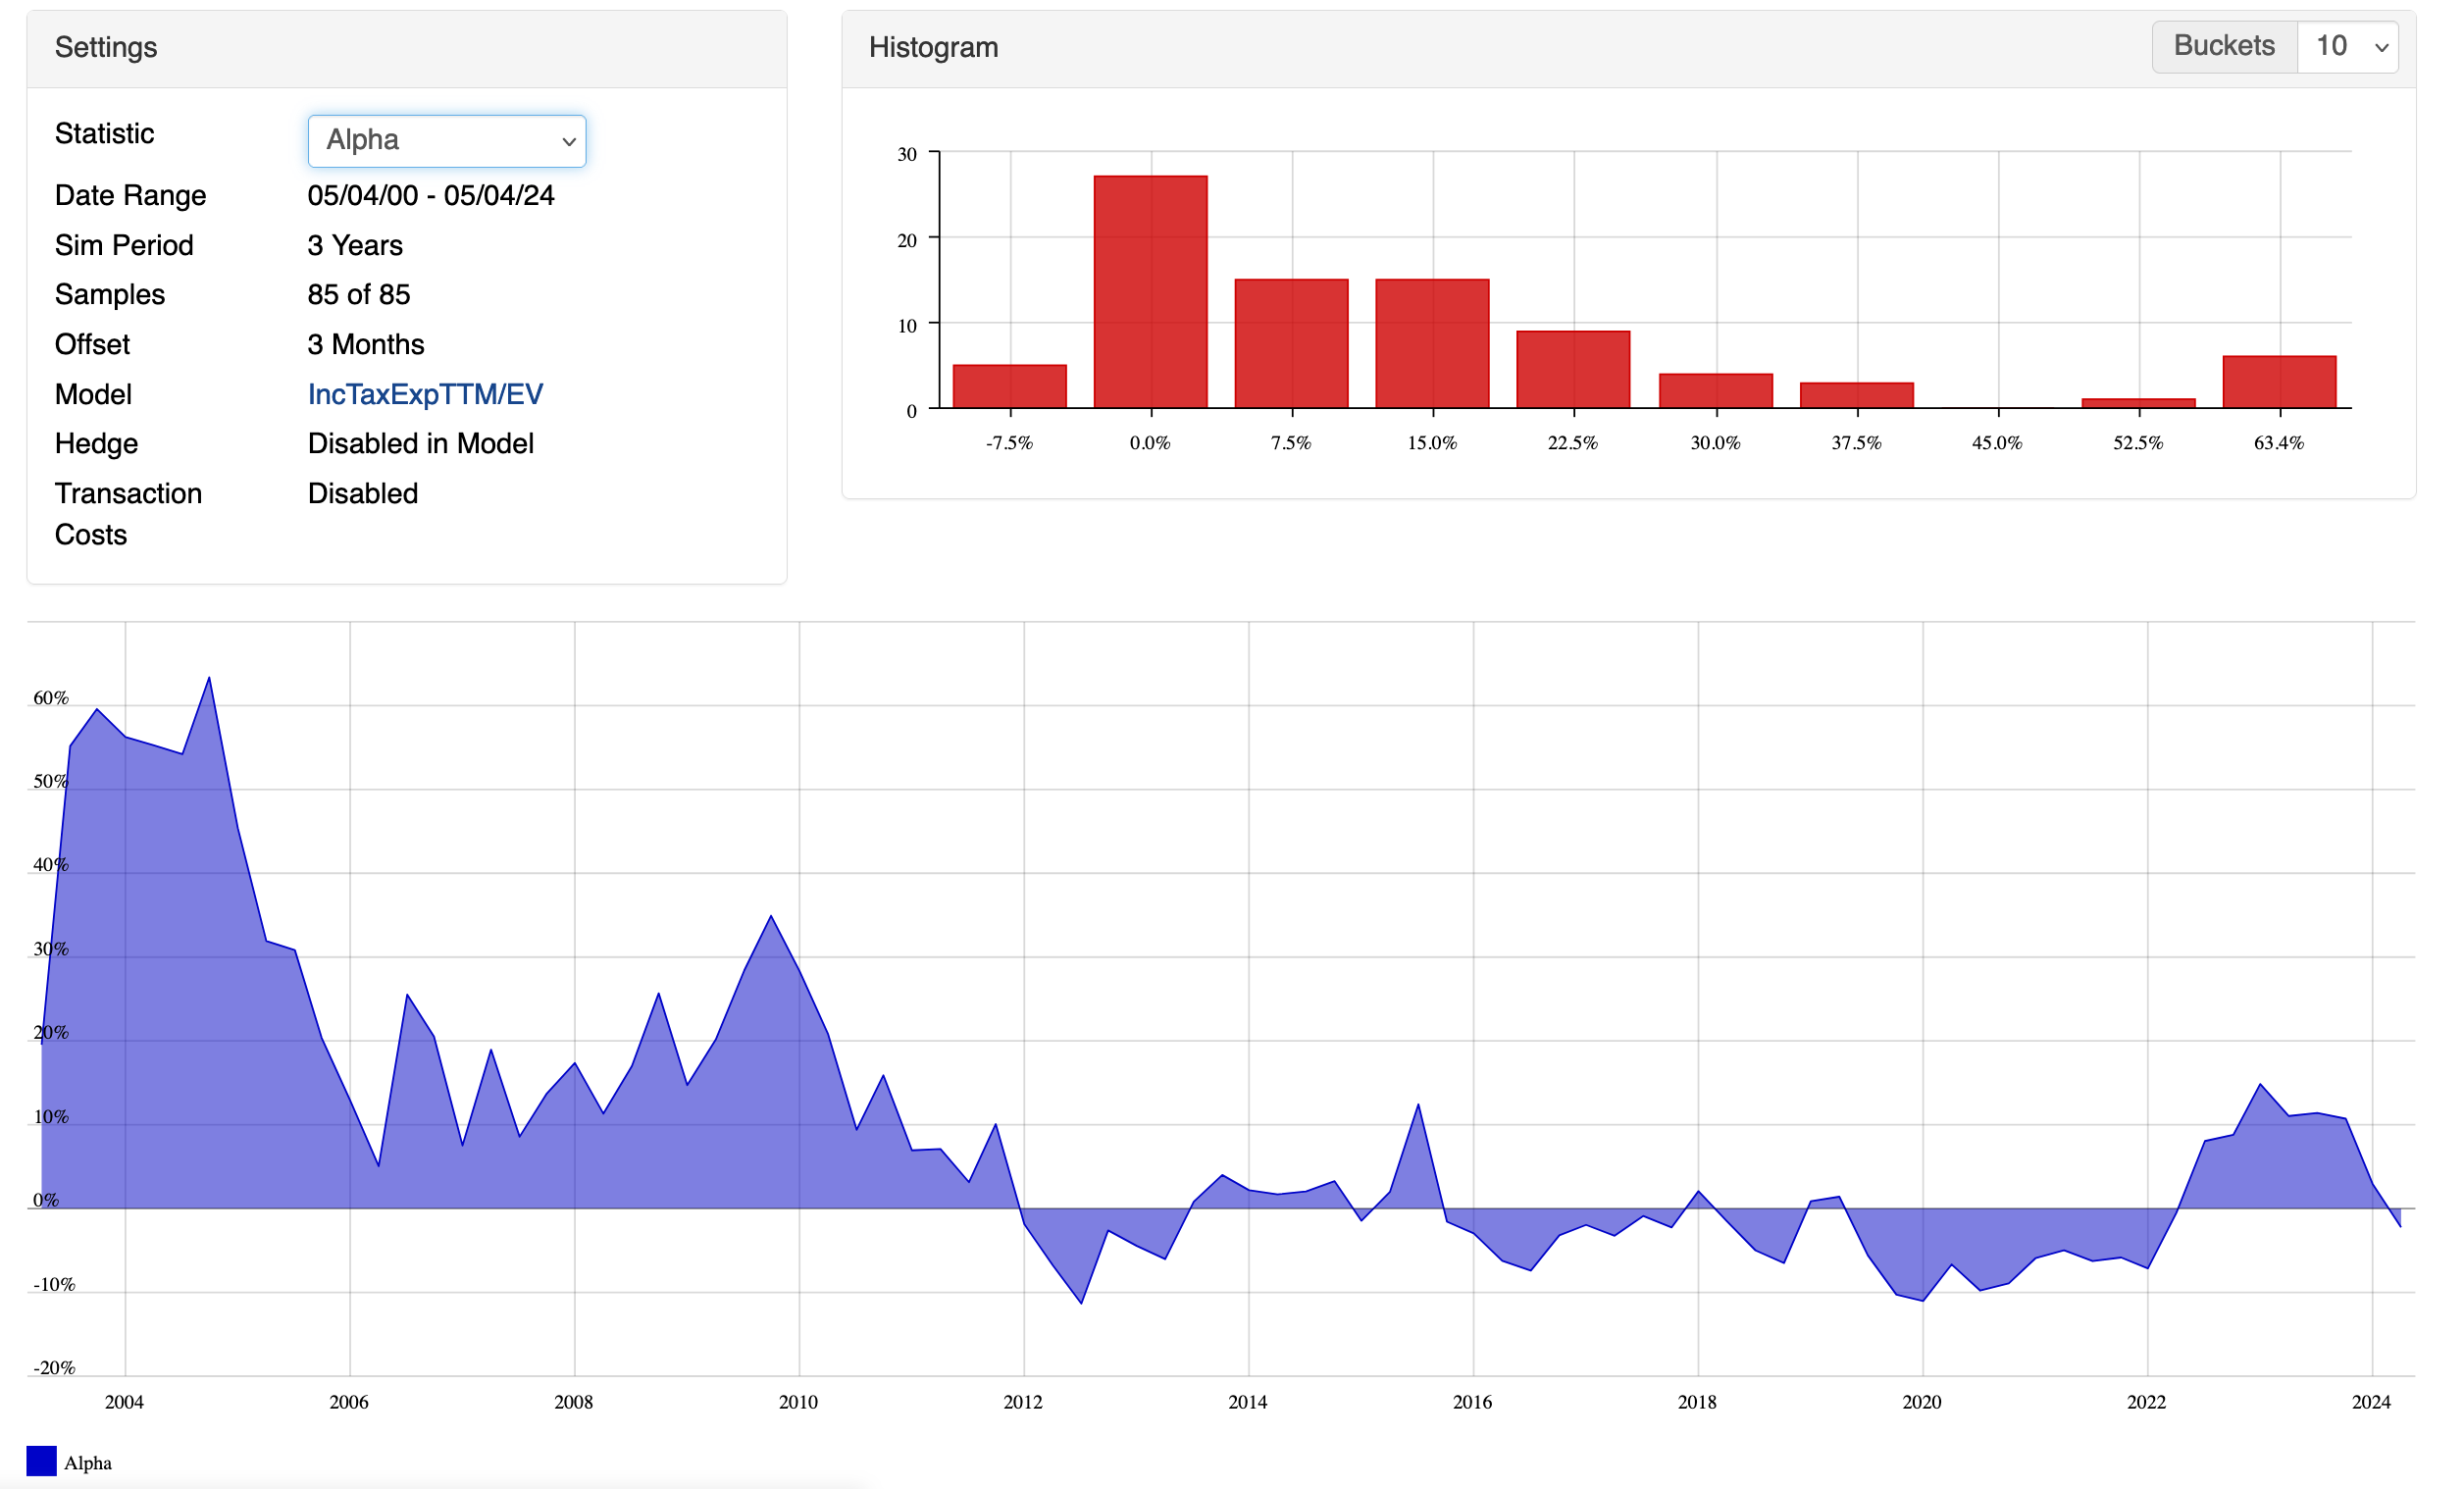
I then rank the companies in each subuniverse by IncTaxExpTTM/ asttotttm against companies in the same industry, lower is better. Hence, favouring companies that pay little tax relative to their peers.

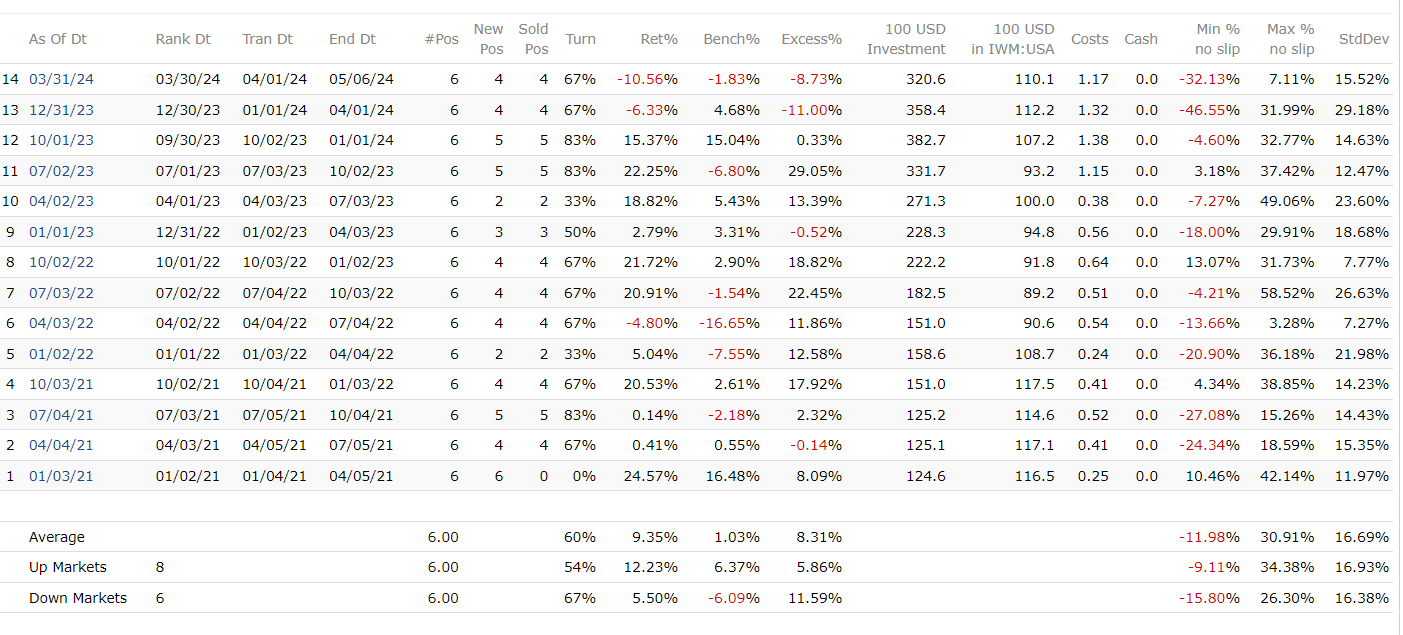
For example, for companies in the subuniverse with the highest net income to assets, I found the following:

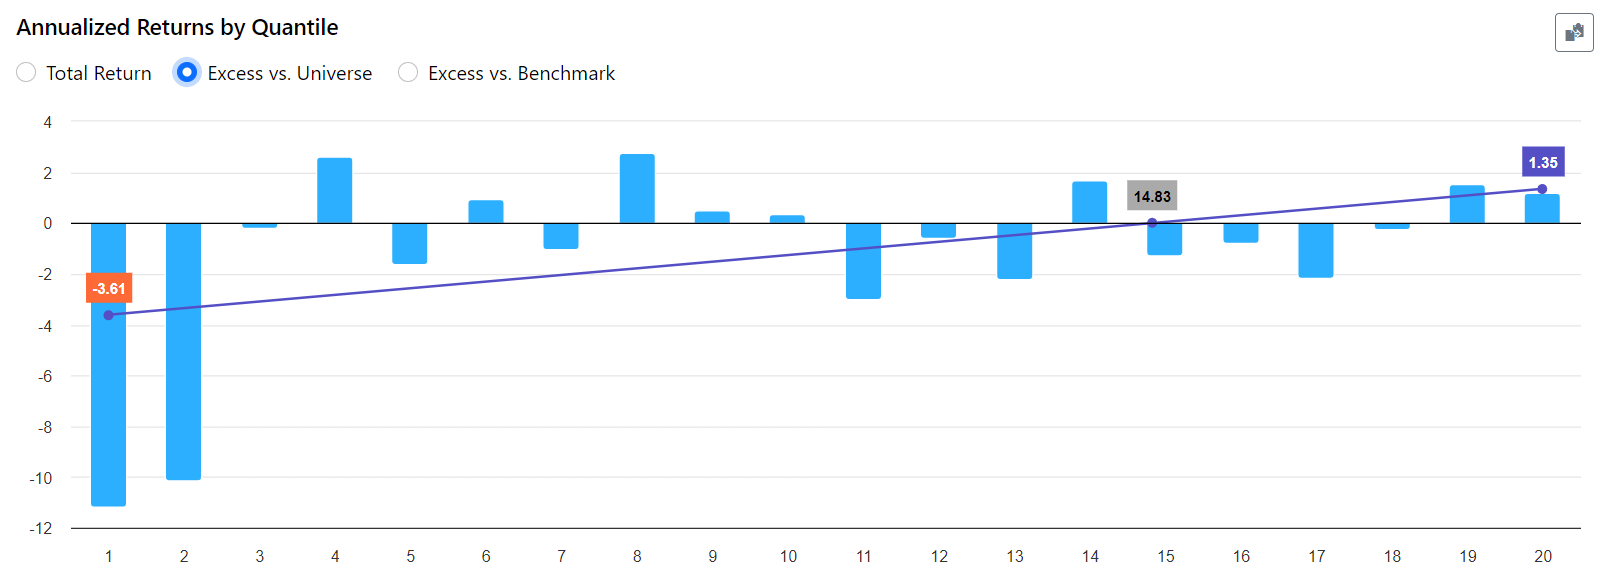
For the second highest, I found this:

This would indeed seem to validate that companies that pay high taxes given their profits should probably be avoided.

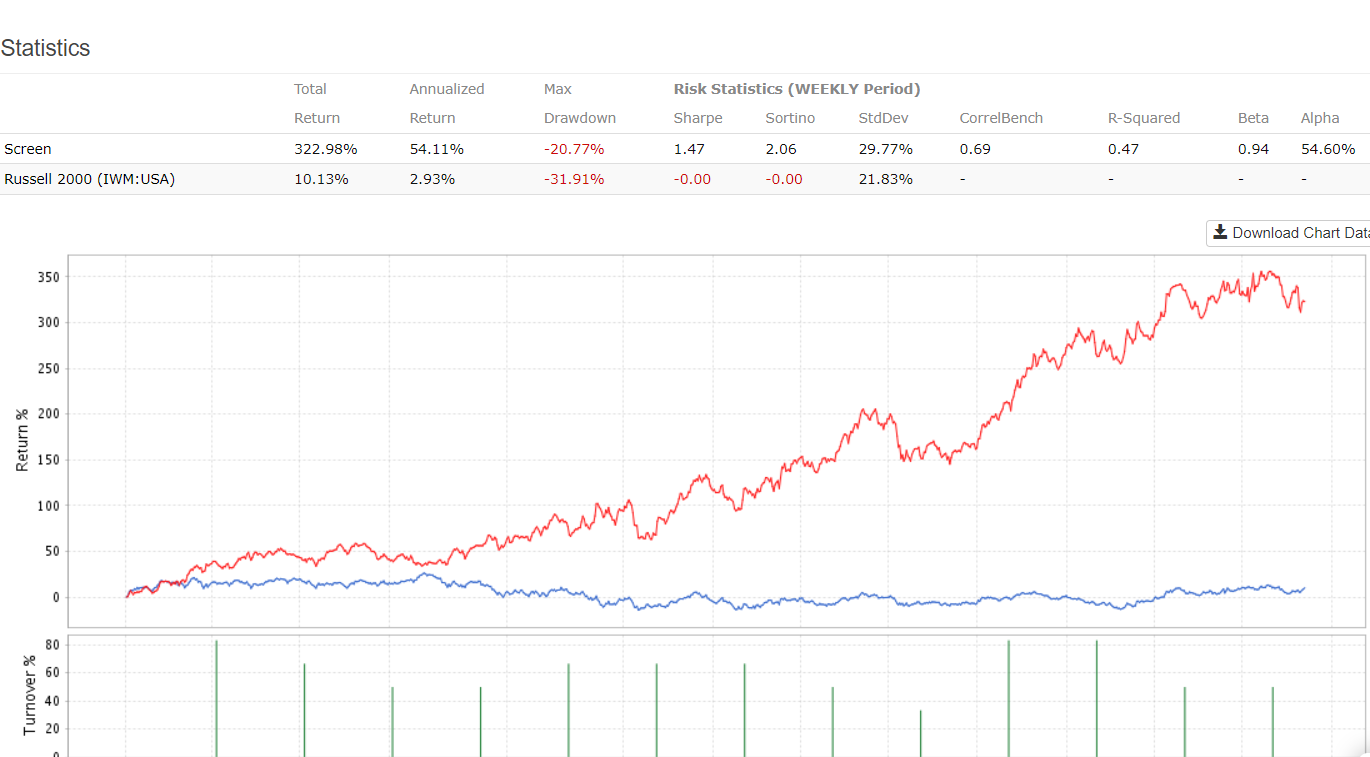
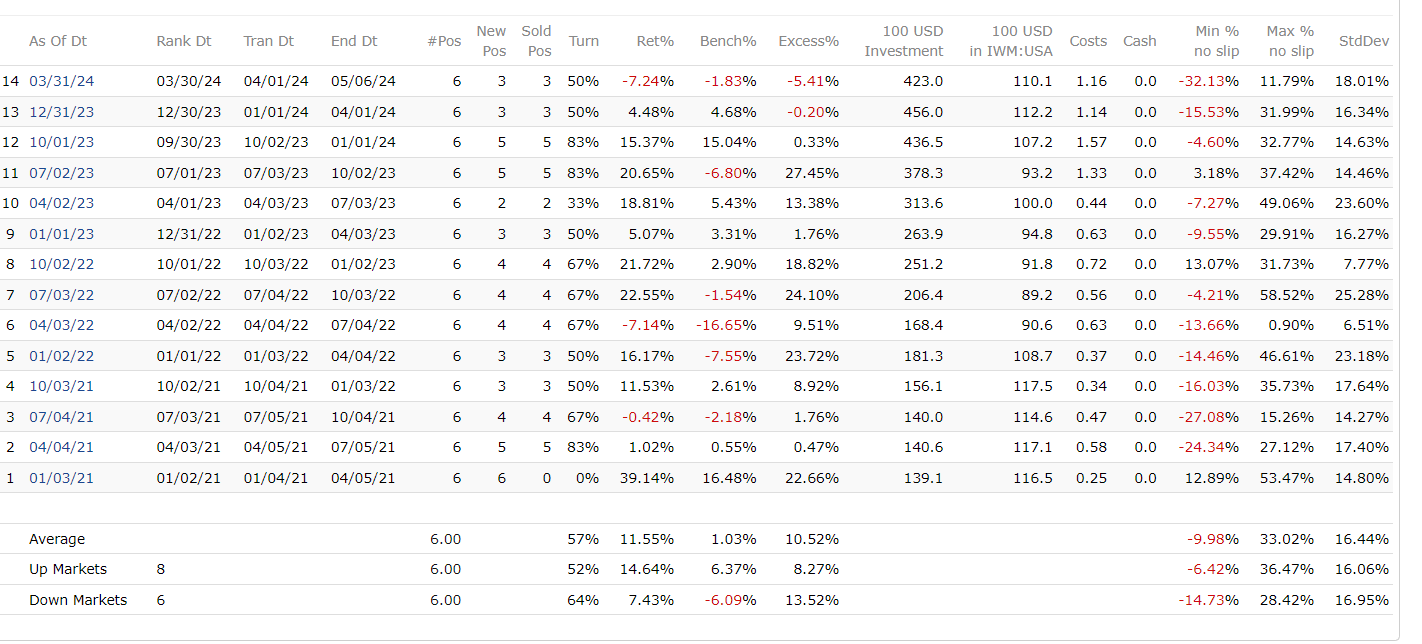
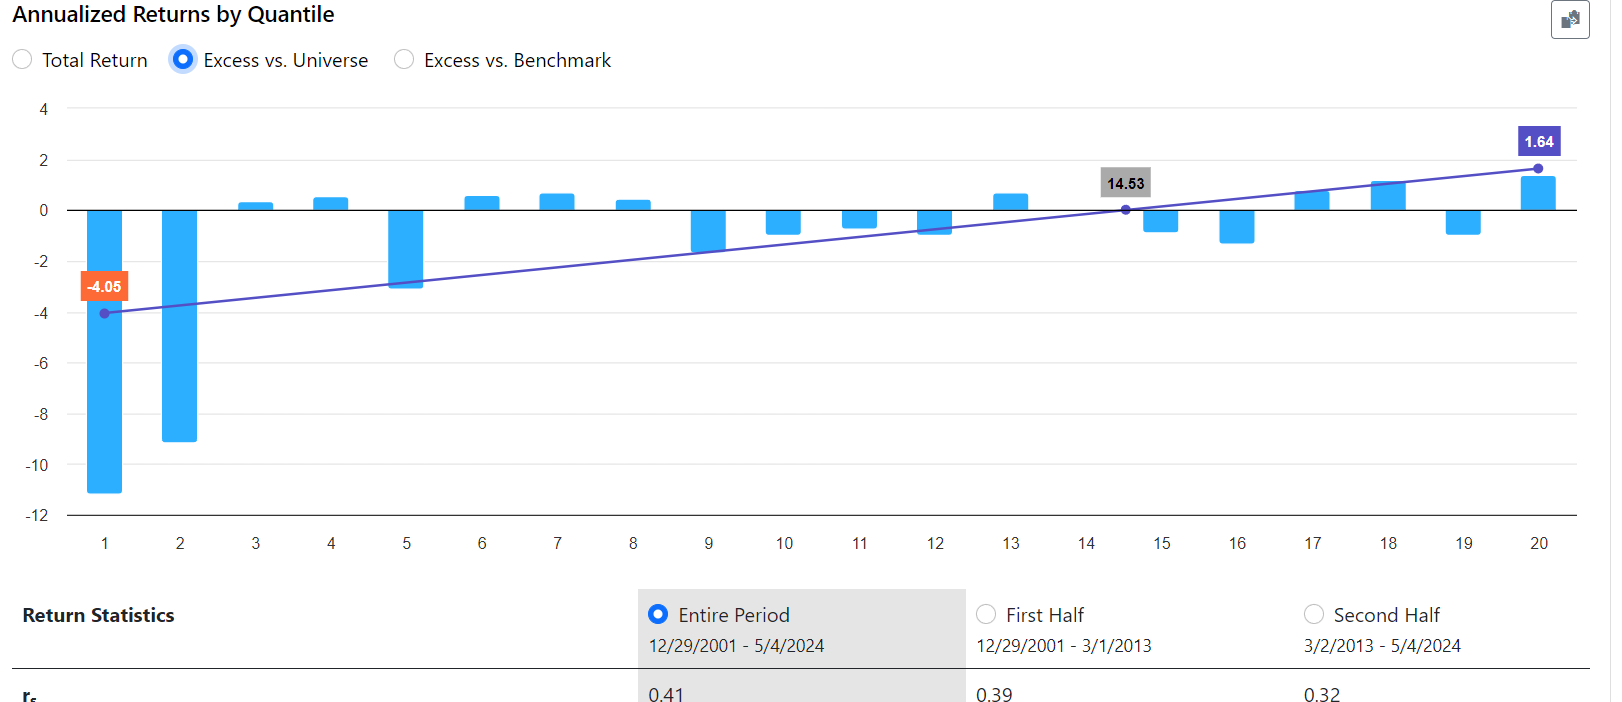
However, flipping the factor to higher is better (and actually favouring companies that pay high tax relative to their peers with similar profits), I obtain this for the top quantile:

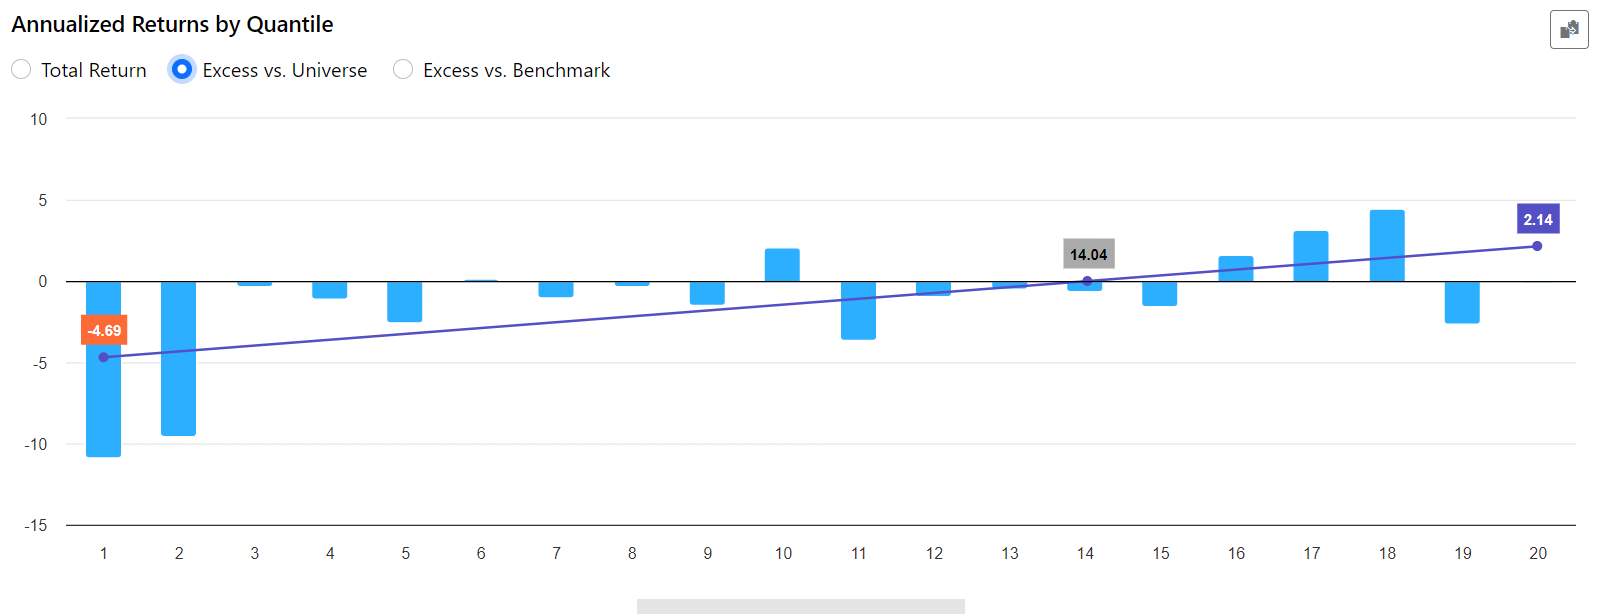
and this for the second highest quantile:

... which would actually be more of a validation of the contrary.

This leads me to two questions:

  • First of all, why does this happen and what do I make of this?
  • Secondly, what would be a 'better' way to test this idea?

Best,

Victor

As far as reasons why higher taxes might be better, it has been postulated that the company is forced to be more honest—or has less flexibility—about profits with the IRS than with public announcements. Seems plausible but not something I know much about.

I.e., maybe the profits are more real or sustainable without any accounting gimmicks.

Ducktruck linked to a publication showing that there is an edge investing in companies paying high taxes. I use a few (high) tax nodes in one ranking system.

Could be that I have been unclear in my previous post.

I tested both higher is better ánd lower is better for the same factor and in both cases I got upward sloping buckets. What is happening under the hood of these rankings tests is unclear to me.

1 Like

Don't know what universe you are testing against, but maybe you are using NA as negative and all you NA's has a terrible performance?

I used NA's neutral. Universe is Easy to Trade US with the addition of the filters I described above (e.g. Frank("NetIncBXorTTM / asttotttm") >= 80 and IncTaxExpTTM/ asttotttm).

So that's not it.

EDIT: made them public.

Ranking is here:
https://www.portfolio123.com/app/ranking-system/465405

Universes:
https://www.portfolio123.com/app/universe/summary/295759?st=1&mt=7
https://www.portfolio123.com/app/universe/summary/295741?st=1&mt=7

Looks like the bottom bucket is empty and distort the slope, not sure why. Probably related to that you are using industry and there is not enough stocks in that industry... :person_shrugging:

IncTaxExpTTM/ asttotttm

This will filter out stocks with "negative" income tax. Use !IncTaxExpTTM=NA as filter instead.

Thanks a lot. Going to try that. :slight_smile:

Had to go back and test one of my Tax nodes. Quite impressive how well it works over the whole range from micro to mega caps.


Here screener on SP500

Here's some information on the types of companies paying out more of their earnings in taxes. Last September there was a Forum thread on higher tax rates which triggered some research which developed a screen I funded. The tax related logic is:

SetVar(@IncTaxChg,(Frank("((IncBTaxTTM-IncAftTaxTTM)/MktCap)", #PREVIOUS, #DESC, #InclNA)))
Between(@IncTaxChg,96,100)=TRUE

The Universe is liquidity constrained NOOTC based (3,000+ holdings). The secondary rules manipulate Short Interest. The RS is Core: Value. Six selected and a 13 week holding period.

One difference in the formula is using MktCap in the denominator and not Total Assets. This is done to replace the Accounting value of the company with the Market. What is left is a Tax Yield.

The companies surfaced are very much in asset intensive industries which the market does not value highly such as Oil & Gas Production, Oil Refining, Home Building, Forest Products, Distribution, Transportation, Chemicals, Banking, Insurance, and Utilities. There is also a good dose of non US companies.

What prompted me to fund the screen is the high number of periods (153/166 Rolling Backtest) with positive excess returns which averaged almost 13% per 3 month period.

A screen shot of the results of my production query is below. Cheers,
Rich

1 Like

I think (IncBTaxTTM-IncAftTaxTTM)/MktCap is a sort proxy of income yield, because taxes are proportional to net income. As earnings yield works well, I would expect the same for income tax to marketcap as it is basically an adjustment to a conventional factor.

I'm still somewhat confused by my own ranking system outputs. I even added

Fcount("IncTaxExpTTM/asttotttm!=NA and Frank(`NetIncBXorTTM / asttotttm`) >= 80 and !IncTaxExpTTM=NA", #industry) > 5

to try to filter out the industries for which there is no data, but still I got a flat line for the first percentile.

Hope someone can point me in the right direction.

When these things happen, I start to doubt any other rankings that I run.

Looks like alpha disappeared in 2012. That's against the SP500 universe.

I decided to investigate the assertion that tax yield is a proxy for earnings yield (at least with this screen). I've run two addition screen versions with before and after tax income.

The before tax earnings yield had a total return of 322.98%. The rolling backtest had an average 3-month excess return of 10.04% with 28 periods having negative excess returns. Backtest results are:

The after tax earnings yield had a total return of 220.60%. The rolling backtest had an average 3-month excess return of 9.31% with 35 periods having negative excess returns. Backtest results are:

Recalling the tax yield metrics the total return is 640.19%. The rolling backtest had an average 3-month excess return of 12.91% with 13 periods having negative excess returns.

Given the metrics differences we need to conclude that tax yield is not a reasonable proxy for either before tax or after tax earnings yield with a 2X and 3X better total returns than those respectively.

Looking into the stocks selected there is significant overlap, but less than a majority. When looking at the stock ranks from "Core: Value" the two earning yield screens draw from the top one half to one percent (99.00+) while the tax yield rank reaches down almost to 98.00. It looks like getting beyond the "very best" is fruitful.

Cheers,
Rich