I have a correlation formula setup, Correl(1,62,$SP500). I then loaded that formula to show as a field in an existing ETF Screen report whereby I'm trying to display the Correlation of that ETF to the SP500. However, the results don't make sense. For example, the correlation value shown for SPY = 0.51. The largest value in a screen list of >300 ETFs is 0.59. Am I setup improperly or is this a system issue? Thanks, David
1 Like
It looks like there's an issue with the weekday series for index series, whicn includes $SP500, so the samples are being misaligned across holidays. I've corrected the issue so it gives you the expected value now.
Confirmed, data looks as expected. Thank you! David
Aaron, does this problem also exist with ##UST10YR? I have a correlation formula, Correl(1,62,##UST10YR), setup to ascertain the ETF's interest rate sensitivity, but getting similar odd readings when comparing to bond ETF such as IEF. David
The series seem to have an inverse relationship.
I added IEF and ##UST10YR to Multi Chart to see each series together:
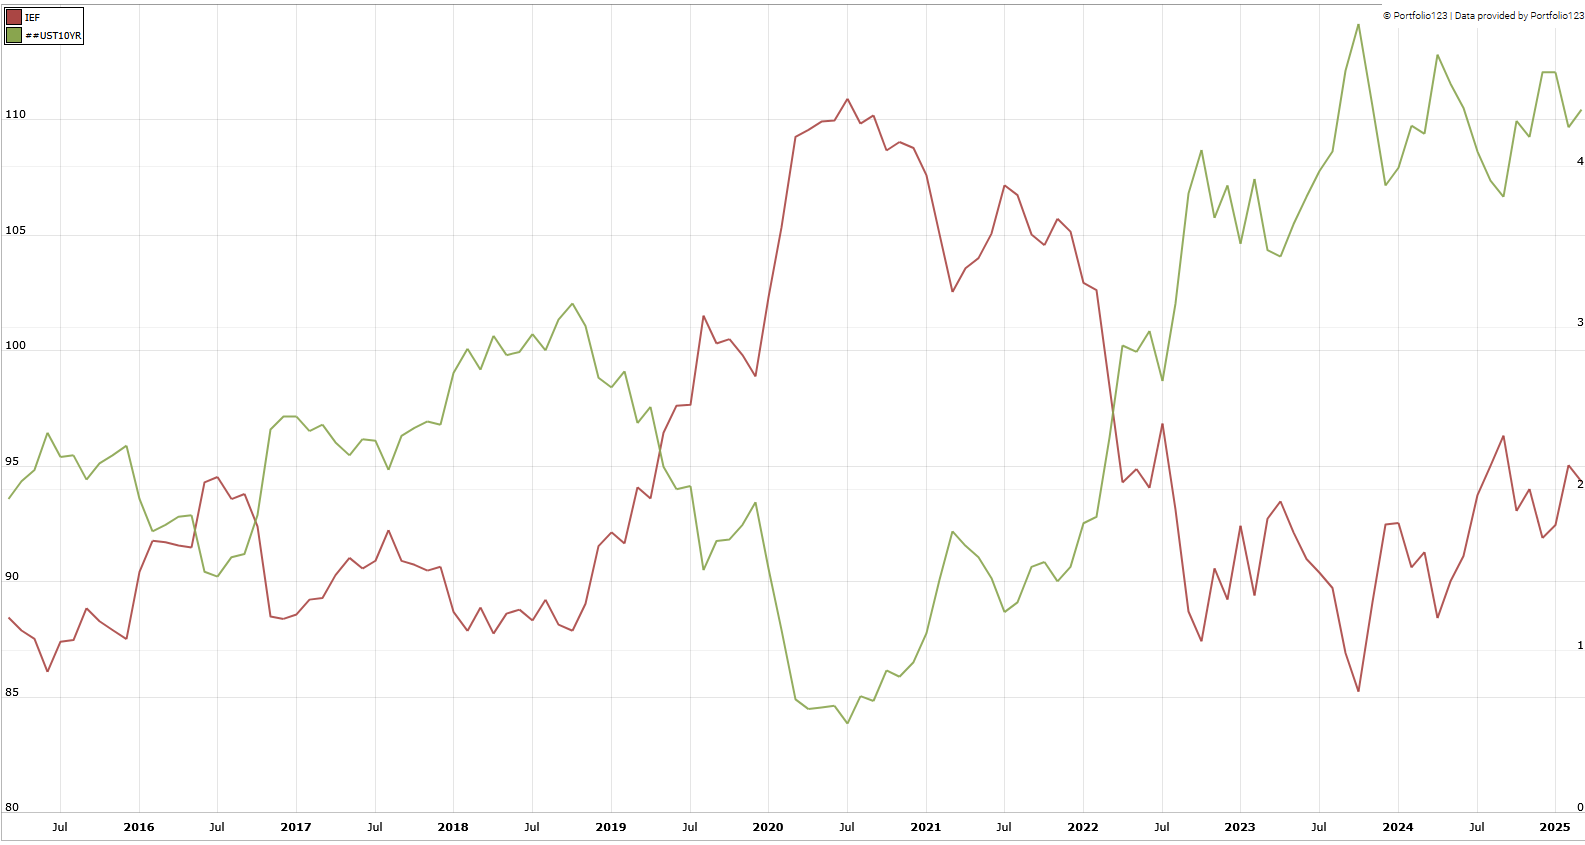
Yes, your chart showing a negative correlation makes sense to me.. as the US10YR goes up, the bond price of IEF should go down. What is confusing to me is that my formula Correl(1,62,##UST10YR) for IEF is showing a value of 0.19 which would indicate a positive correlation (albeit very small). I was expecting to see a negative correlation value which would be representative of the chart you showed. That's why I was wondering if the ##UST10YR series had the same issue as the one you found for the index series $SP500.
I see the problem. The latest value on the ##UST10YR series is behind by a day, so the samples are misaligned by a day when you run it on a current screen.
You can work around this by either changing the as of date on a screen or by using FHist to push evaluation back to a date where it will always have a value:
FHist("Correl(1, 62, ##UST10YR)", 1)
Thanks Aaron. Using the FHist formula is a step in the right direction. The correlation value for IEF is now -0.44. Your time series chart above would suggest a much stronger negative correlation value (-0.7 to -1.0). This value as-is only suggests a moderate correlation. Of the 382 ETFs I track, the Min correlation value I now get is -0.53 for BAB, Taxable Municipal Bonds. The Max value I get is +0.53 for PFIX, Interest Rate Hedge. Perhaps there's another issue at play?
Just as a follow-up, if I run the 62 day correlation between the UST10YR and IEF in Stockcharts, it comes up with a correlation value of -0.99 which would mean an almost perfect inverse correlation closely resembling your series chart.
I suspect it's the the use of weekday series (as a means of aligning when there are different holidays) that's throwing it off. Rather than falling back to the latest trading day, it opts to represent holidays as 0% implicitly, which inflates correlations positively, especially with a 1-bar period. Using fallbacks instead of weekday series would also handle the series lag we see on ##UST10YR.