I'd like to share a project I've been working on: Dashboard123, a free, open-source desktop dashboard for monitoring your Portfolio123 strategies, screens, and rankings in real time. Even if you have not used Python before, please continue to read, one day you will have to install Python on your computer — it will be as common as Excel has been.
It runs locally on your computer as a web app (via Streamlit + Python), so your API keys and data never leave your machine.
I originally started building Dashboard123 to learn Streamlit (pretty much all vibe-coded), since P123 has hinted that Streamlit is the platform they intend to use for their upcoming "App Store." Along the way I kept adding features I found useful for my own daily workflow, and it grew into the full dashboard I use daily.
I'm sharing it because I think others might find it useful too — and more importantly, I want to encourage people to fork it and make it their own. With today's AI tools (Claude, ChatGPT, Cursor, etc.), it's incredibly easy to tweak and extend a working app even if you're not a developer. Use this as a base, add the features you want, change the layout — go wild.


What It Does
Dashboard123 pulls together everything I wanted to see at a glance without switching between browser tabs:
-
Strategy & Screen Holdings — See all your P123 strategy and screen holdings in one sidebar, with daily performance, 1M/3M returns, RSI, SMA distances, and relative volume (configurable per group)
-
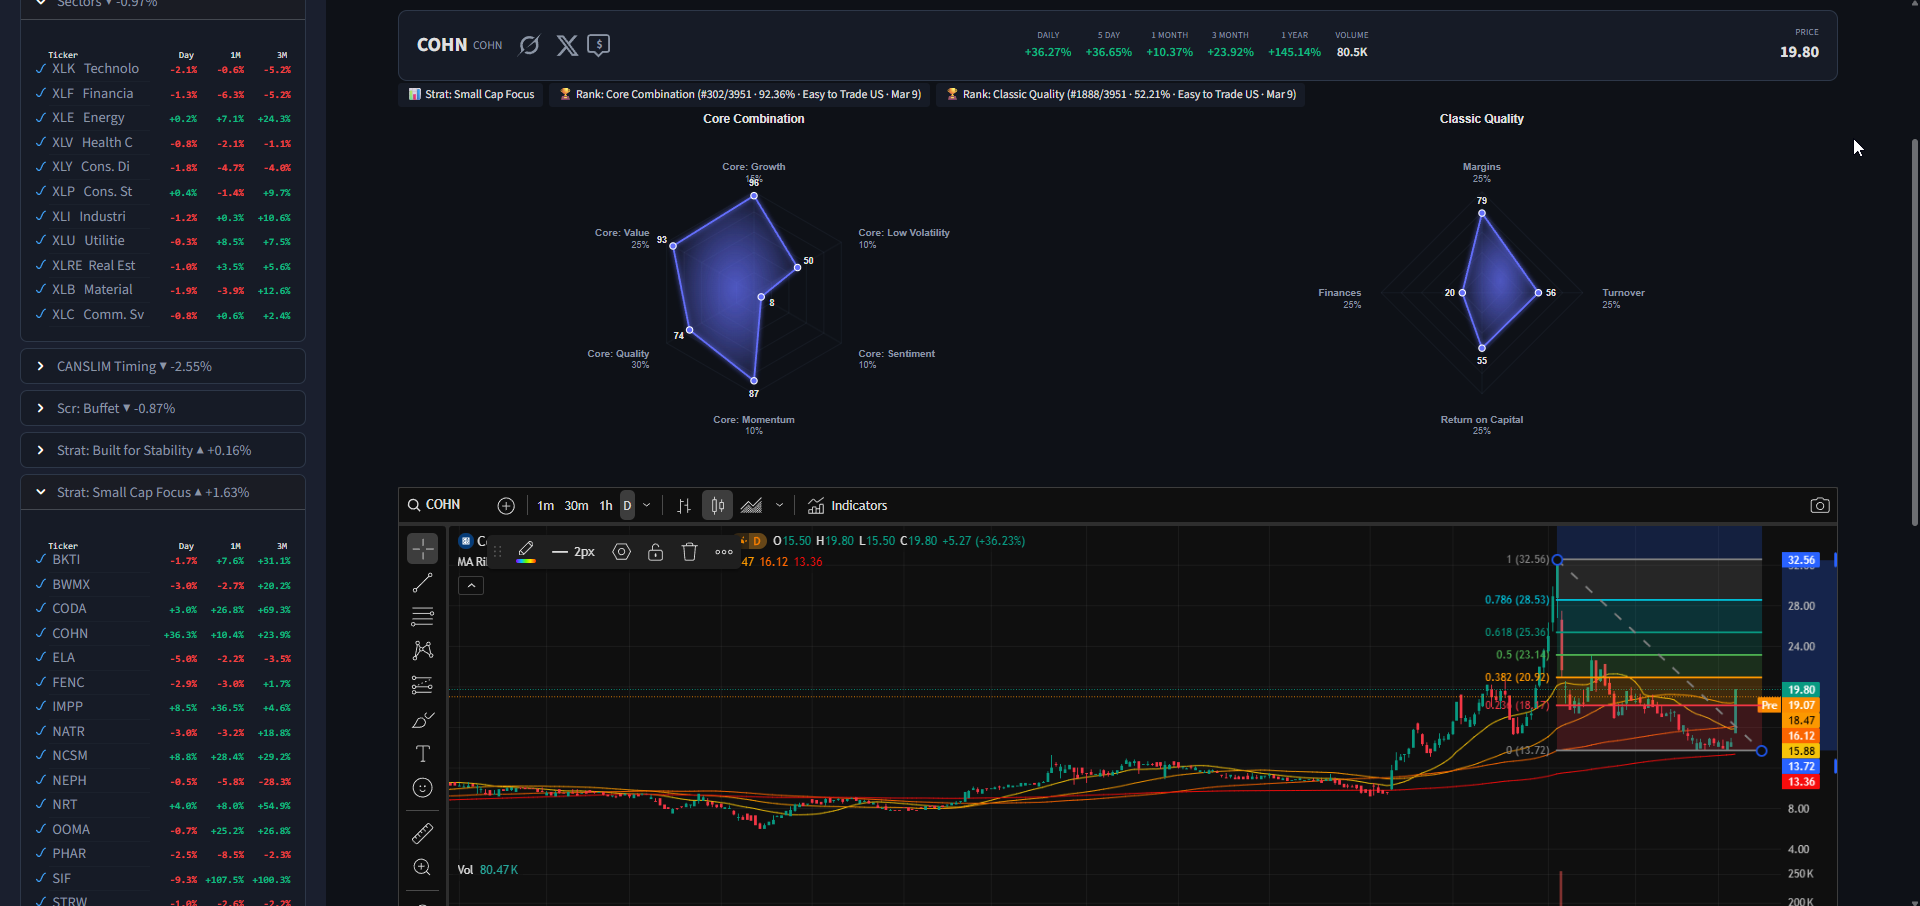
Ranking System Radar Charts — Spider web visualizations showing how a stock scores across your ranking system's top-level nodes (Value, Growth, Momentum, etc.)
-
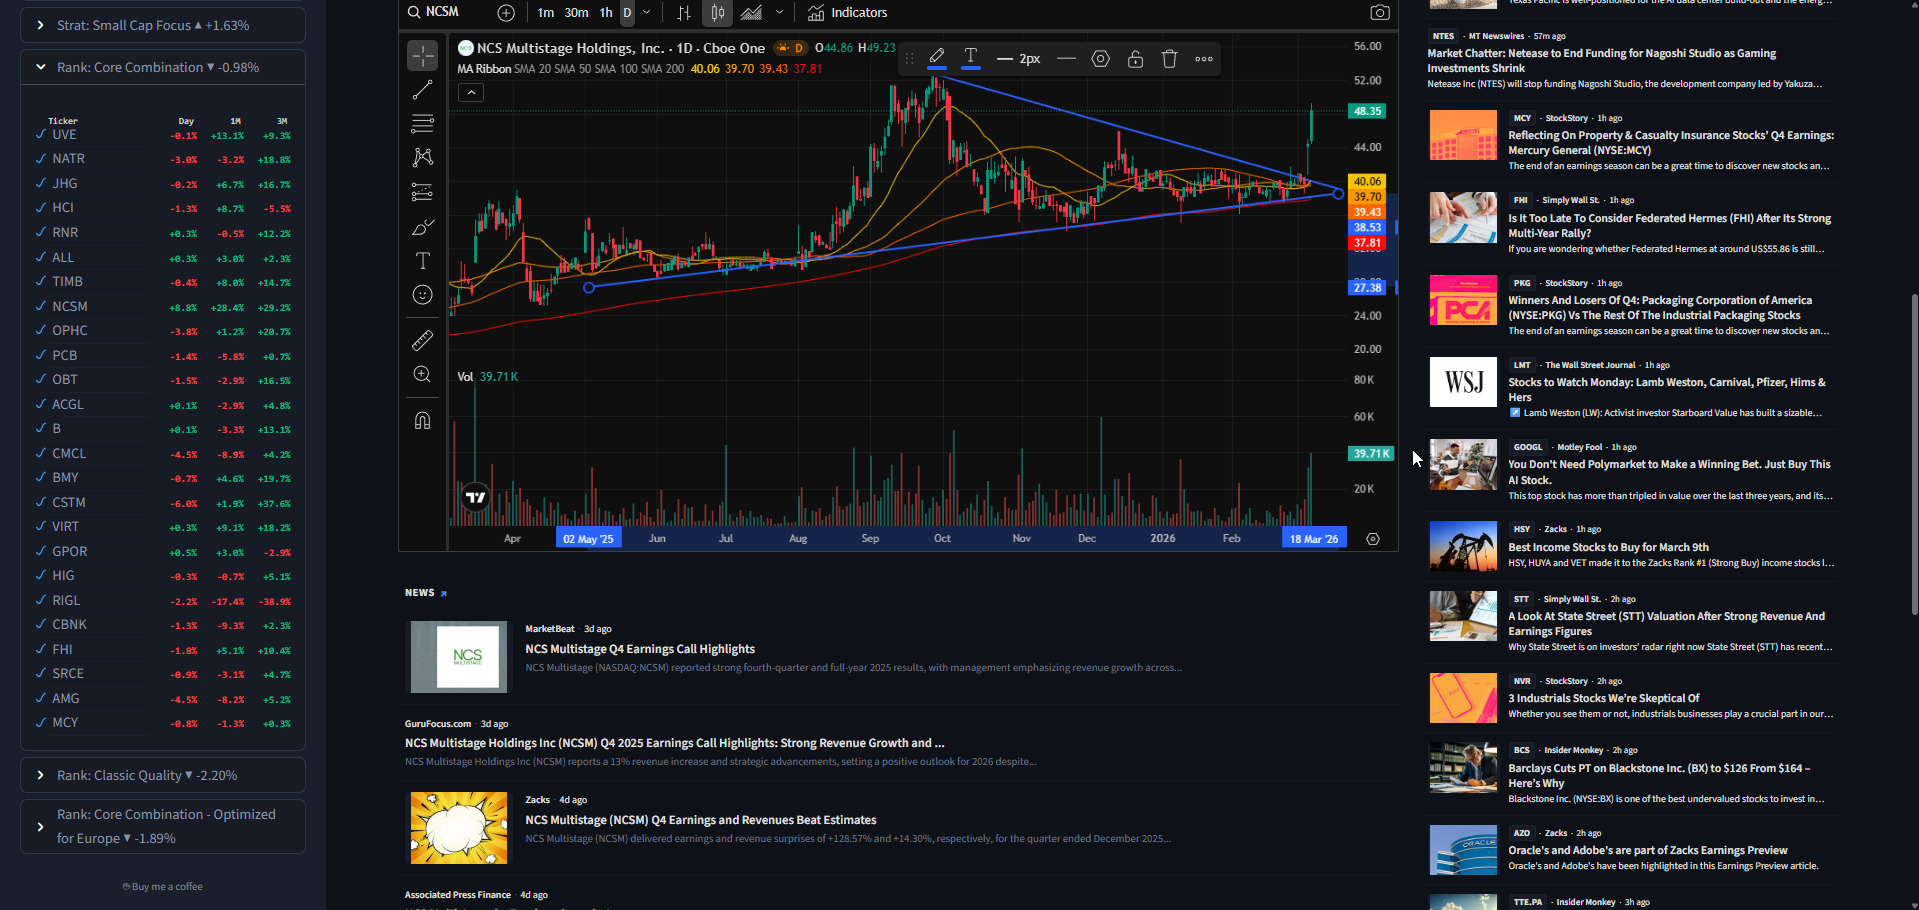
TradingView Charts — Full interactive TradingView charts embedded directly in the dashboard. I find TradingView superior to work with.
-
Market Overview Bar — Customizable row of major indices/ETFs with sparkline mini-charts (S&P, NASDAQ, Russell, VIX, Gold, etc.)
-
Top Gainers & Losers — See which of your holdings are moving the most today
-
Strategy Trader Panel — Fetch rebalance recommendations, adjust share counts, and commit trades directly through the P123 API
-
News Feed — Per-ticker news from Yahoo Finance, plus an aggregated news panel across all your holdings
-
Community Forum Feed — Latest P123 forum posts right in the dashboard
-
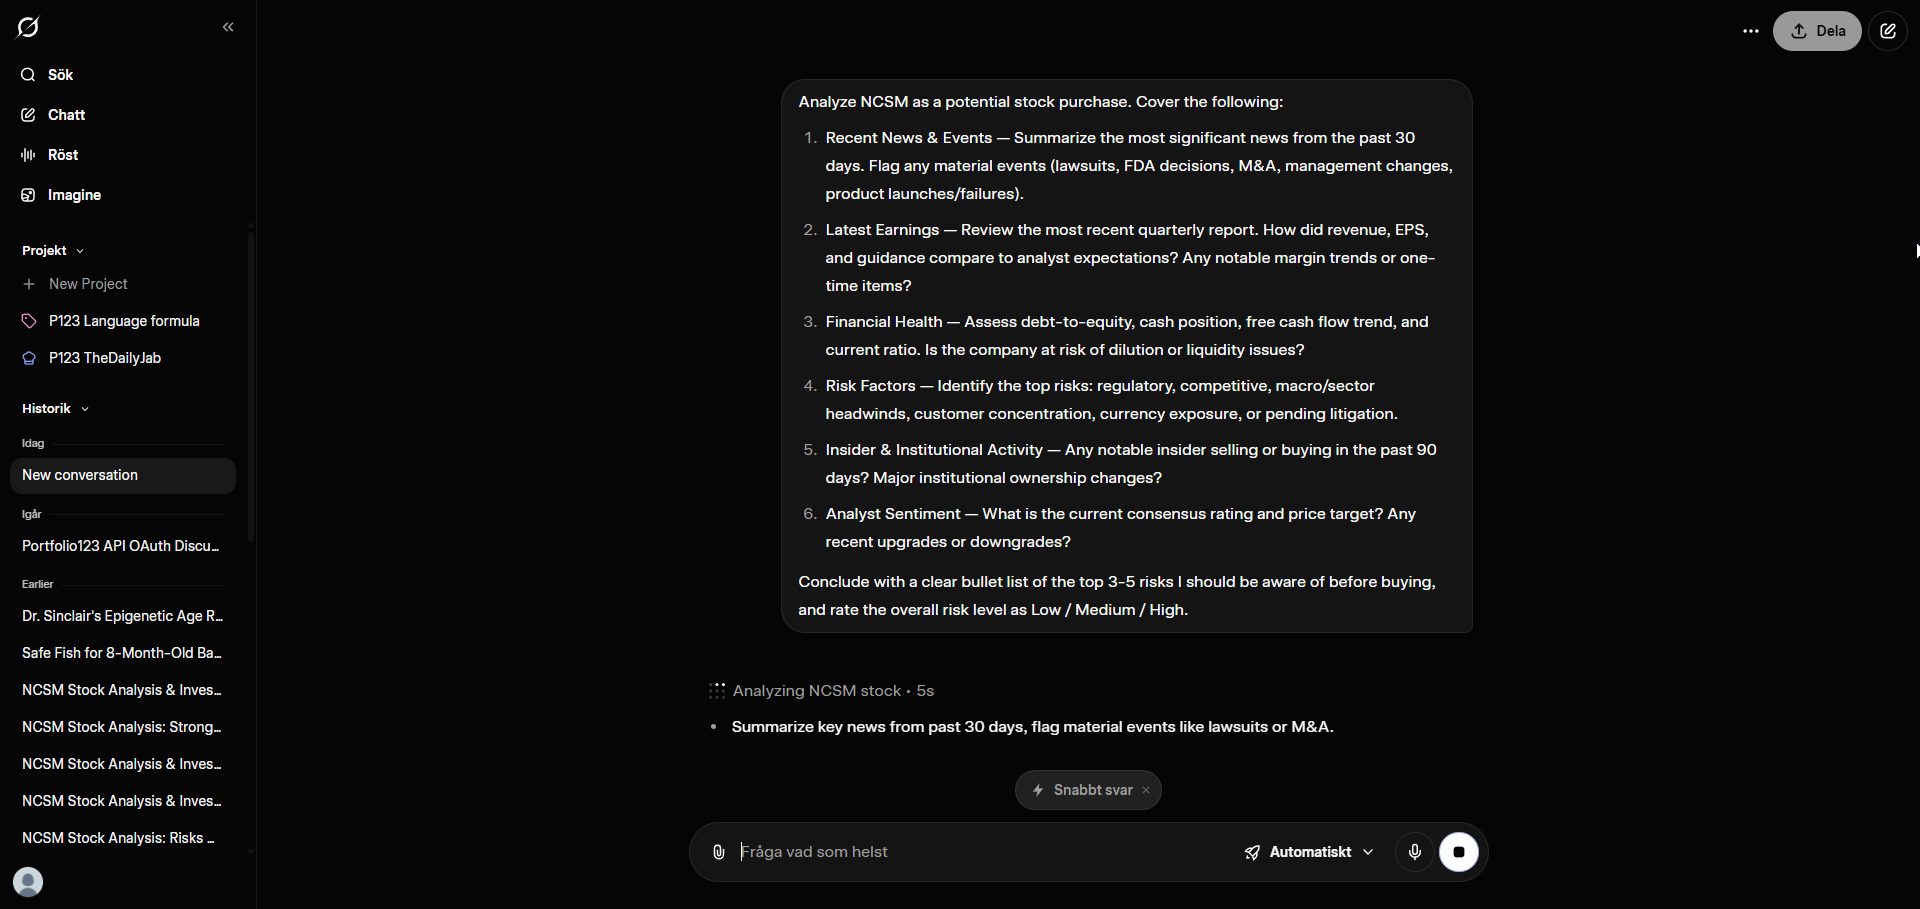
Grok AI Integration — One-click link to analyze any ticker with Grok using a customizable question template
-
Trader Notes — Attach notes to any ticker/strategy combination; they persist across sessions
-
Dark / Light Theme — Toggle with one click
-
Auto-Refresh — Configurable interval (5-60 minutes)
Everything is configurable through a built-in Settings dialog — no need to edit files.
Installation Guide (for Non-Python Users)
Don't worry if you've never used Python before. This takes about 5 minutes.
Step 1: Install Python
-
Go to python.org/downloads
-
Download the latest Python 3.x installer for Windows
-
IMPORTANT: During installation, check the box that says "Add Python to PATH" — this is the most common mistake people make
-
Click "Install Now" and wait for it to finish
Step 2: Download Dashboard123
Option A — Download ZIP (easiest):
-
Go to the GitHub page: GitHub - Algoman123/Dashboard123: Open-source desktop dashboard for monitoring your Portfolio123 strategies, screens, and rankings in real time · GitHub
-
Click the green "Code" button
-
Click "Download ZIP"
-
Extract the ZIP to a folder of your choice (e.g.,
C:\Dashboard123)
Option B — Git clone (if you have Git):
git clone https://github.com/Algoman123/Dashboard123.git
Step 3: Install Dependencies
-
Open the extracted folder
-
Double-click
install.bat -
This will:
-
Check that Python is installed
-
Create an isolated virtual environment (won't affect your system Python)
-
Install all required packages
-
Create a
.envfile for your API keys
Step 4: Configure Your P123 API Keys
-
Open the
.envfile in any text editor (Notepad works fine). -
Replace the placeholder values:
P123_API_ID=your_actual_api_id

P123_API_KEY=your_actual_api_key
- Save the file
Where to find your API keys: Log into Portfolio123, go to Account Settings (portfolio123.com/app/account), and look for the API section. Note: API access requires a P123 subscription that includes API access.
You can also set these credentials directly in the app's Settings dialog.

Step 5: Launch
Double-click run.bat. The dashboard will open in your default browser at http://localhost:8510.
Setting Up Your Dashboard
On first launch, click the gear icon (![]() ) in the sidebar to open Settings.
) in the sidebar to open Settings.
Adding Strategies
-
Go to the P123 Strategies tab
-
Enter your strategy name and its numeric ID (found in the P123 URL when viewing your strategy)
-
Click "Add Strategy"
-
Click the
 button to fetch current holdings
Adding Screens
Same process in the P123 Screens tab. You'll also set a max number of holdings.
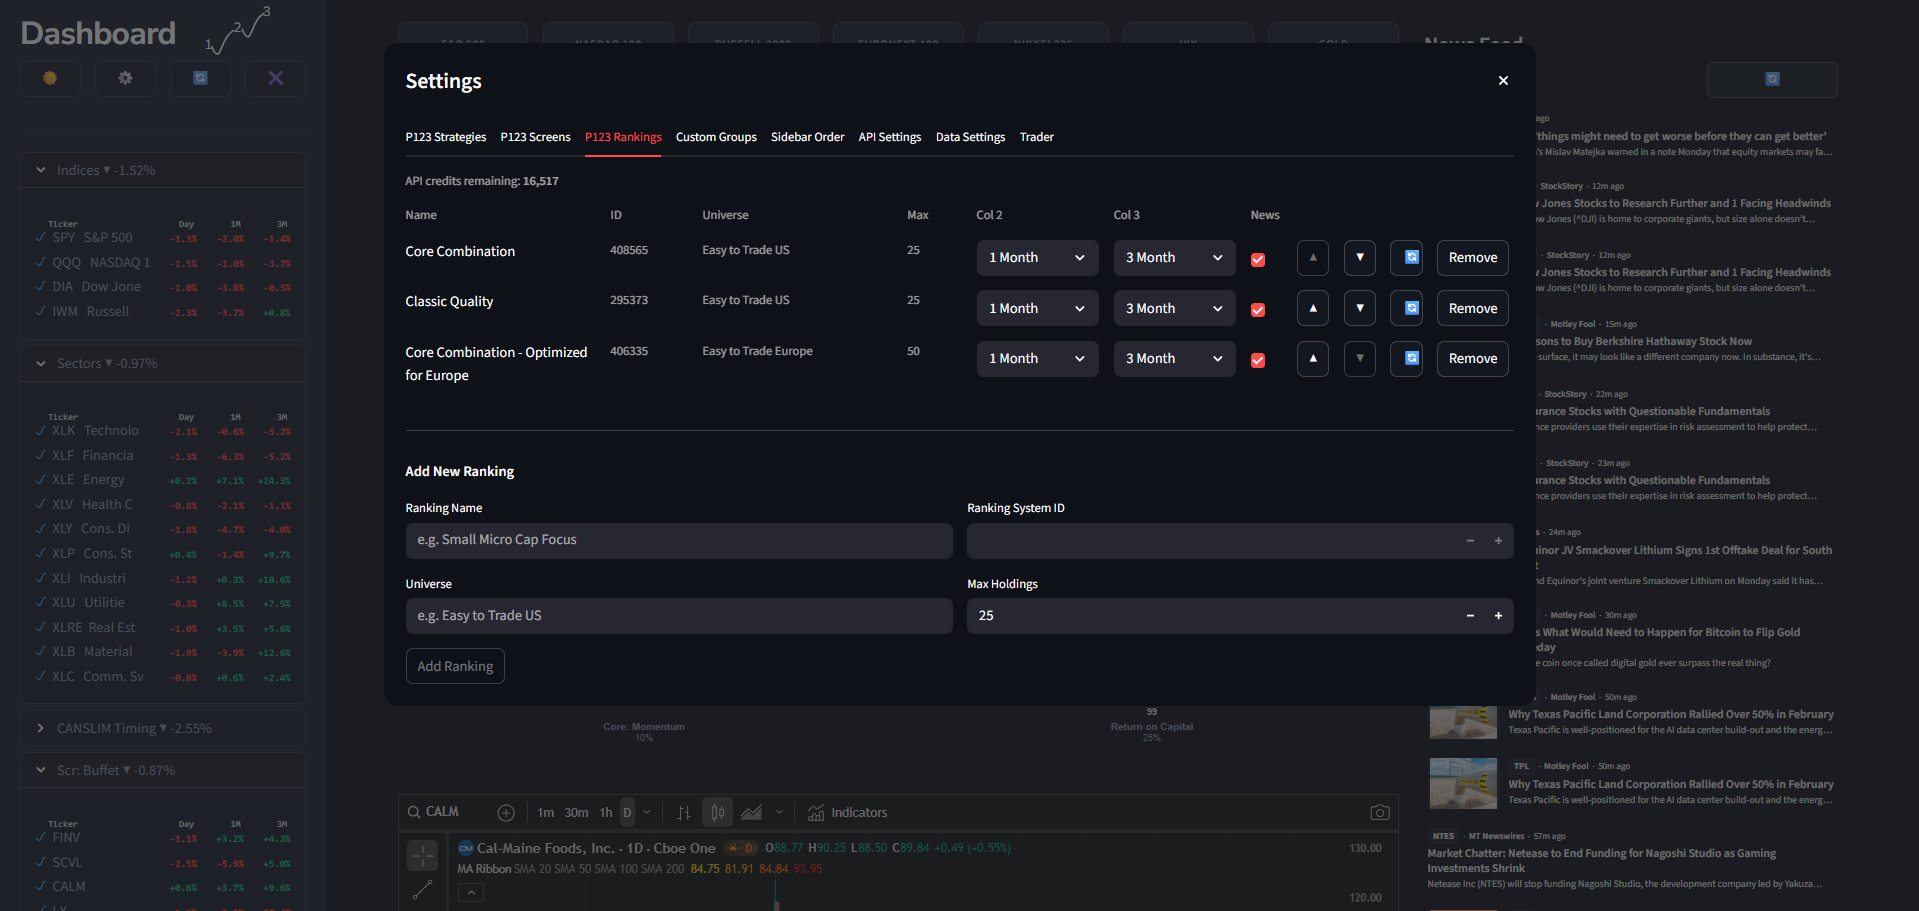
Adding Rankings
-
Go to the P123 Rankings tab
-
Enter the ranking system name, ID, universe name (e.g., "Easy to Trade US"), and max holdings
-
After adding and refreshing, you'll see radar charts for any ticker that appears in the ranking
Custom Groups
Create your own watchlists in the Custom Groups tab — just give it a name and a comma-separated list of tickers.
Sidebar Columns
Each group can show different indicators in its two data columns. Options include: Daily %, 5D, 1M, 3M, 1Y, RSI(14), SMA 20/50/200 distance, and Relative Volume.
Trader Panel
If you use P123's Live Strategies:
-
Go to Settings > Trader tab
-
Add your Live Strategies, you can split them to (broker) accounts (that is how I use it)
-
In the main dashboard, click the
 icon in the sidebar to open the Trader panel
 -
Click "Fetch Recs" to get rebalance recommendations
-
Check the trades you want to execute, adjust share counts, then click "Commit Selected"
Known Limitations
-
TradingView & Oslo Exchange: The TradingView embed widget doesn't support Oslo Stock Exchange (OSL) stocks in the embedded chart (might be other European stocks that I ahve not tried). The symbol search finds them, but the chart won't render. This is a TradingView limitation — the stocks work fine on tradingview.com directly.
-
API Credits: Ranking data fetches cost ~2 P123 API credits per call. Holdings are cached to disk and only refreshed when you manually click the refresh button. Fetching recommendations from Live Strategies costs 1 API credit per strategy.
-
Yahoo Finance: Market data comes from yfinance and may occasionally have gaps or delays.
Technical Details
For those interested:
-
Built with Streamlit (Python web framework), yfinance (market data), p123api (Portfolio123 API), and TradingView (charts)
-
All data stays local — nothing is sent to any server except Yahoo Finance (market data) and Portfolio123 (your API calls)
-
Config is stored in a local
config.jsonfile; API keys in.env -
Market data is cached for 1 hour, sparklines for 15 minutes, forum posts for 5 minutes
-
Ranking data and holdings are persisted to disk and only refreshed on manual button press
Feedback & Contributions
This is a hobby project that I use daily, and I'm sharing it in case others find it useful. You're welcome to fork it, modify it, and make it your own. With today's AI coding tools, it's easy to add features and tweak things even if you're not a Python developer — just use this as your starting point. I will probably add features and make improvements and push updates occasionally, but I will not spam the forum with updates.
All I ask is that you keep the "Buy me a coffee" link in the sidebar and give credit for the original work. Caffeine fuels development!
-
GitHub Issues: GitHub · Where software is built
-
Or reply to this thread
License: MIT (free to use, modify, and redistribute).
You can find some screen recording on X as well
https://x.com/AlgoManX