TL;DR:
P123 already runs multiple randomized models during Grid Search — it would be a shame to force users to create duplicate models just to see performance variance when they have already done a grid search. P123 could consider exposing the full Grid Search results, saving time and resources for users who believe Grid Search already provides sufficient randomization.
Aaron already gave a complete answer to Daniel’s question [here]AI Factor Models Sources of Randomness (e.g. LightGBM) - #5 by aschiff. I figured a feature idea should go in a separate thread, so I’m starting one now.
Aaron noted:
And Doney added:
That got me thinking: Grid Search already runs many randomized models—why not expose all of those results to us?
Feature Proposal: Expose All Grid Search Runs
Right now, Grid Search only displays the best result, even though multiple cross-validation folds and seeds are evaluated under the hood. But for users like us, all those runs are gold.
We could use them to:
- Make small changes to hyperparameters and study variance across random splits.
- Make larger changes to explore whether a model is robust or just lucky.
In both cases, P123 already has the data. The only thing needed is to reveal the full distribution of results.
—
Why This Matters
Here’s a simple visualization of what this could look like:
In this plot:
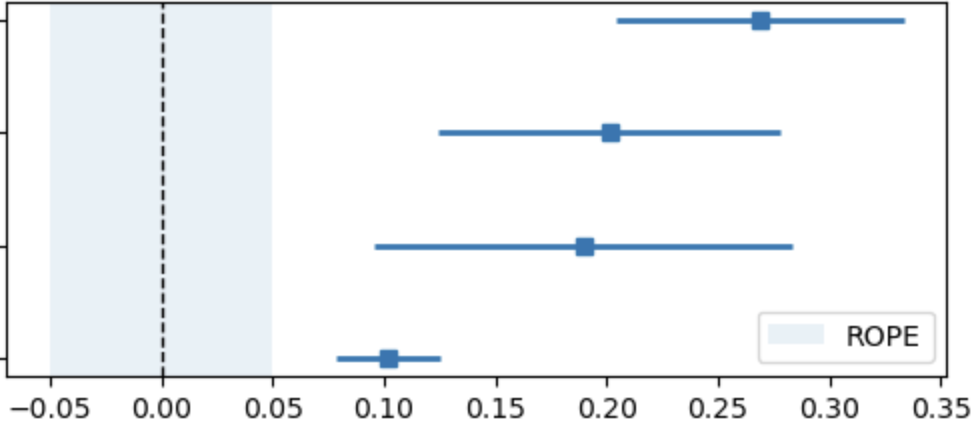
- Each line shows a model’s credible interval (CI) for validation returns.
- The shaded area is a “ROPE”—a Region of Practical Equivalence.
- You can immediately see which models have stable outperformance, and which ones might just be noise.
This kind of visualization would:
- Expose the uncertainty in model selection.
- Let us compare variance vs. mean across model configurations.
- Prevent overfitting to a single lucky seed or split.
—
Summary
Grid search already runs multiple models with randomization.
Those runs already contain performance variance.
Just show us that variance—maybe even graphically like above.
P123 already generates data for multiple runs of a model with randomization. It would just be a matter of revealing that data and maybe making a graphic (e.g., Forest Plot).