DataMiner and incorrect future prices

In DataMiner, when I specify a non-existent future close, it appears that the most recent close price is returned. Returning NAs is preferred.

For ETON, $4.74 is returned for both Closem6 and Closem21. That was yesterday’s close.

Settings:
PIT Method: Prelim
Ranking Method: NAsNeutral
Universe: “Tradable Fundamental $100K Micro-SmallCap NoLP3”
Start Date: 2023-08-11
End Date: 2023-08-14 #Optional.
Frequency: 1Week # ( [ 1Week ] | 2Weeks | 3Weeks | 4Weeks | 6Weeks | 8Weeks | 13Weeks | 26Weeks | 52Weeks )
Columns: factor # ( [ranks] | composite | factor )
Include Names: false # ( true | [false] )
Ranking System: “Small and Micro Cap Focus Kurtis 5h”
Additional Data:
- asofdate
- 1WkFutureRet: Future%Chg(5)
- 4WkFutureRet: Future%Chg(20)
- 1WkTradedRet: 100*(Close(-6)/Close(-1)-1)
- 4WkTradedRet: 100*(Close(-21)/Close(-1)-1)
- 13WkTradedRet: 100*(Close(-61)/Close(-1)-1)
- Open: open(-1)
- Close0: Close(0)
- Closem5: Close(-5)
- Closem1: Close(-1)
- Closem6: Close(-6)
- Closem21: Close(-21)

So just so I understand. I am out of API points and want to better understand how I should alter my September download.

So in September, even if I enter 8/11/23 the output date will be Saturday which will be 8/12/23 and if I understand that may actually be the ranks after the overnight update on 8/14/23.

If I used 1WkFutureRet: Future%Chg(5) that would actually give me Friday’s closing price and some look-ahead bias.

So better would be: 1WkTradedRet: 100*(Close(-6)/Close(-1)-1). Thank you for pointing that out Walter.

And will that be the latest data if I enter 9/1/23 for a Monday 9/4/23 rebalance? I have not tried this with no API points left and this is a real question.

I believe if I want to rebalance on September 8 this will give me ranks for September 4 at the latest. Maybe I can do multiple downloads with ScreenRun if I want the latest ranks.

Just so I know what I could do. And so I am not “tilting at windmills” or wishing for solutions to problems that are already solved (make sure I am keeping up). I am confident P123 is looking at some of this and wonder what I can and can’t do. And what to wish for.

I have already altered my DataMiner download to include: - 1WkTradedRet: 100*(Close(-6)/Close(-1)-1). Again, very much appreciated Walter.

Again I am confident P123 is working on this and I don’t mind a few setbacks in my own personal learning curve. If it was super-easy everyone would be making money.

Jim

Yes, that is correct. If your start/end dates cover 8/12/23, you’ll get the ranks used on the morning of 8/14/23.

And will that be the latest data if I enter 9/1/23 for a Monday 9/4/23 rebalance? … I believe if I want to rebalance on September 8 this will give me ranks for September 4 at the latest.

Yes.

1 Like

BTW, if anyone would like a column with ExcessReturns relative to the Universe returns I have the code to do that in Python and then write the csv file (with that column) to your desktop.

I am happy to share it as well as have in checked with any troubleshooting so I can learn. I do use P123 and would like all of this to work for everyone.

BTW, I assume people are using files with say 5,000,000 rows and concatenating them. Modern P123 members can do that in their sleep but you cannot do P123 now without Python skills, I think. And at least a couple processors working in parallel. But I assume no one needs help with that.

I will do what I can to catch up on Python.

Jim

Hi Jim,

I would be interested in your code and I’m also interested in sharing mine. I save as a python pandas dataframe instead of a csv and pickle it to save it as it’s much faster to load back into Python than a csv. But we should be able to check if the alpha vs universe calculation is consistent. I can also save to a csv of that makes checking easier.

Thanks!
Jonpaul

Here is what I am doing to calculate universe alpha.
In words I am:

  1. Calculating an “Initial Investment” of $1 for each stock in the universe
  2. Multiplying my investment by the weekly gain of each stock (in practice this is not doing anything since my investment is 1 and the gain is 0= 0% and 1 = 100%)
  3. Summing up all of the gains to get the universe gain
  4. Calculating the change of the universe as gain/initial investment
  5. Subtracting the universe change from each stocks change to get alpha
  6. Add the universe alpha to my table!

In code:

# Calculate the universe gain and then each stocks alpha!
# I am using a unit investment of 1 so total stocks or length of dataframe = initial investment
initial_investment = len(dataframe) 

# Universe gain is the sum of all the gains: total gains = sum((1)*gain)  = sum(gain)
univ_gain = dataframe['MM_gain'].sum()  # MM_gain is the Monday to Monday stock gain

# Calculate universe gain as a percentage
univ_gain_percentage = (univ_gain / initial_investment)

# Calculate the alpha and add to the dataframe
dataframe['univ_alpha'] = dataframe['MM_gain']-univ_gain_percentage 

# Add it to the dataframe
combined_dataframe = pd.concat([combined_dataframe, dataframe], ignore_index=True) 

I am leaving my gains/changes as a decimal instead of multiplying by 100 as it is easier to do math with later on. But it would work to do % if you multiply initial investment by 100 as well.

Jonpaul,

Thank you for your code! Here is mine to read a file (M3Two here), add a column of ExcessReturns and then write the new with the ExcessRetruns file back to my computer (Twoxs here). xs meaning excess returns,

BTW, I have been using r2_score from Sklearn for my metric. But I will code a method to calculate the CARG of a stock strategy where, each week, I select the 25 stocks with the highest predicted returns from say an XGBoost model. For the code I will calculate the real average return of these selected stocks for that week. To determine the strategy’s Compound Annual Growth Rate (CAGR), I’m thinking of the following steps:

Convert the average weekly returns to log returns using the formula: ln(1+average weekly return).
Annualize the average log return by multiplying it by 52.
Compute the CAGR as exp(annualized log return) − 1

I will share that code when I have it. I think that can be coded (with ChatGPTs help if I need it).

Anyway, my code:

import pandas as pd
#Read the CSV file
df = pd.read_csv(‘~/Desktop/DataMiner/M3Two.csv’)

#Ensure that the “Date” column is a datetime object
df[‘Date’] = pd.to_datetime(df[‘Date’])

#Calculate the mean returns for each date
mean_returns = df.groupby(‘Date’)[‘Future 1wkRet’].mean()

#Subtract the mean returns for each date from the individual returns
df[‘ExcessReturn’] = df.groupby(‘Date’)[‘Future 1wkRet’].transform(lambda x: x - x.mean())

#Now, df[‘ExcessReturn’] contains the excess returns for each ticker and date
#Define the file path for the desktop
file_path = ‘~/Desktop/DataMiner/xs/Twoxs.csv’

#Write the DataFrame to the CSV file
df.to_csv(file_path, index=False)
print(f’Excess returns have been saved to {file_path}')

Jim

I used the universe mean vs my method and get the same result! Much more succinct. I assume the lambda function will also correctly subtract the universe gains from the stock gains to get the alpha, but I did not check it.

I am personally more interested in a CAGR or alpha as my success method than an R^2 score. Partially because r2 is not intuitive for me in the sense that my model may predict well, but I don’t know what that means in terms of return on investment haha.

This is actually my full code if you want to run it. I only know it works in colab, but probably should locally as well. Also I used a class so running the individual functions is a little different, but it makes adding the inputs easier. Also if you use a decent editor for python code it will give you prompts as you type in the input. Dan and Portfolio123 the doc strings would be a nice update for the python api if you are ever doing one!

Note you have to go to the bottom of the long post to see the examples. I tried an expanding section, but it messed up the code…

# NOTE: Google Colab uses Python 3.7
!pip install --upgrade p123api # Install p123api if missing
import p123api
import pandas as pd
from datetime import timedelta, datetime

class Portfolio123API:
    def __init__(self, api_id, api_key):
        self.client = p123api.Client(api_id=api_id, api_key=api_key)

    def rank_update(self, xml_str, type='stock', method=4, currency='USD'):
      """
          Update or create the ApiRankingSystem using provided XML string.

          Parameters:
          -----------
          xml_str : str
              XML data containing ranking information to be updated. Like from the ranking text editor.
          type : str, optional
              Type of ranking data, e.g., 'stock' or 'asset', default is 'stock'.
          method : int, optional
              Numeric code representing the ranking update method, default is 4. 2-Percentile NAs Negative, 4-Percentile NAs Neutral
          currency : str, optional
              Currency for monetary values, default is 'USD'.

          Returns:
          --------
          bool
              Returns True indicating the successful update of rankings.
      """
      self.client.rank_update({
            "type": type,
            "rankingMethod": method,
            "nodes": xml_str,
            "currency": currency
            })
      return True

    def download_rank(self, universe, ranking_name, date, add_data, pit='Prelim', precision=4, method=4, names=False, NACnt=True, finalStmt=True, node_type='factor', currency='USD'):
      """
        Generate a ranking pandas DataFrame based on the provided inputs. Uses 1 api credit per 25,000 data points as of Aug 2023.

        Parameters:
        -----------
        universe : str
            Name of the universe on Portfolio123.
        ranking_name : str
            Name of the ranking system on Portfolio123.
        date : str
            Date for which the ranking is being generated. Format is 'YYYY-MM-DD'
        add_data : list
            Additional data to be considered for ranking. like 'Close(0)' which is fridays close. Note some things may require the PIT license.
        pit : str, optional
            Period in time, e.g., 'Prelim' or 'Complete', default is 'Prelim'.
        precision : int, optional
            Number of decimal places for ranking scores, default is 4.
        method : int, optional
            Numeric code representing the ranking method, default is 4 which is neutral, 2 is negative.
        names : bool, optional
            Flag indicating whether to include ticker names in the output, default is False.
        NACnt : bool, optional
            Flag indicating whether to include the count of missing values, default is True.
        finalStmt : bool, optional
            Flag indicating whether to include if the stock has a final statement, default is True.
        node_type : str, optional
            Type of node for ranking, e.g., 'factor' or 'composite', default is 'factor'.
        currency : str, optional
            Currency for monetary values, default is 'USD'. 'USD' | 'CAD' | 'EUR' | 'GBP' | 'CHF'

        Returns:
        --------
        pandas.DataFrame
            A DataFrame containing the generated ranking data. Added the date as a column
      """

      ranking = self.client.rank_ranks({
          'rankingSystem': ranking_name,
          'asOfDt': date, # Formated as 'yyyy-mm-dd'
          'universe': universe,
          'pitMethod': pit,
          'precision': precision,
          'rankingMethod': method, # 2-Percentile NAs Negative, 4-Percentile NAs Neutral
          'includeNames': names,
          'includeNaCnt': NACnt,
          'includeFinalStmt': finalStmt,
          'nodeDetails': node_type, # 'factor', 'composite'
          'currency': currency,
          'additionalData': add_data # Example: ['Close(0)', 'mktcap', "ZScore(`Pr2SalesQ`,#All)"]
        },True) # True - output to Pandas DataFrame | [False] to JSON.

      dates = pd.to_datetime([date]*len(ranking))
      dates = pd.to_datetime([date]*len(ranking))
      ranking.insert(0, 'Date', dates)
      return ranking

    def rank_perf(self, universe, ranking_name, start_date, end_date, slippage, pit='Prelim', precision=4, trans_type='Long', method=4, num_buckets=10, minP=3, freq='Every Week', bench='SPY'):
      """
      Calculate rankings and return relevant data.

      Parameters:
      -----------
      universe : str
          Universe name same as P123
      ranking_name : str
          Name of the ranking system to be used, should match P123 ranking sys
      start_date : str
          Start date for the calculation period in the format 'yyyy-mm-dd'
      end_date : str
          End date for the calculation period in the format 'yyyy-mm-dd'
      slippage : float
          Value representing slippage for transactions. 0-1
      pit : str, optional
          Period in time, e.g., 'Prelim' or 'Complete', default is 'Prelim'.
      precision : int, optional
          Number of decimal places for ranking scores, default is 4. 2-4
      trans_type : str, optional
          Type of transaction, e.g., 'Long' or 'Short', default is 'Long'.
      method : int, optional
          Numeric code representing the ranking method, default is 4. 2-Percentile NAs Negative, 4-Percentile NAs Neutral
      num_buckets : int, optional
          Number of buckets for ranking, default is 10.
      minP : int, optional
          Minimum stock price, default is 3.
      freq : str, optional
          Frequency of calculation, e.g., 'Every 4 Weeks' | 'Every Week' | 'Every N Weeks' (2,3,4,6,8,13,26,52), default is every week.
      bench : str, optional
          Benchmark for comparison, e.g. available benchmarks on P123, default is 'SPY'.

      Returns:
      --------
      df : pandas.DataFrame
          A DataFrame containing calculated ranking data.
      quota : int
          An integer with the remaining quota
      """
      results = self.client.rank_perf({
            'rankingSystem': ranking_name,
            'startDt': start_date,
            'endDt': end_date,
            'pitMethod': pit,
            'precision': precision,
            'universe': universe,
            'transType': trans_type,
            'rankingMethod': method,
            'numBuckets': num_buckets,
            'minPrice': minP,
            'rebalFreq': freq,
            'slippage': slippage,
            'benchmark': bench,
            'outputType': 'perf'}) # only perf with this function

      dates =  results['dates']
      benchmark = results['benchmarkSeries']
      buckets = results['bucketSeries']
      quota = results['quotaRemaining']

      # Scale benchmark
      scaled_benchmark = [100 * (value / benchmark[0]) for value in benchmark]

      # Create DataFrame
      data = {'dates': dates, 'benchmark': scaled_benchmark}
      for i, bucket_values in enumerate(buckets, start=1):
        data[f'bucket{i}'] = bucket_values

      df = pd.DataFrame(data)

      return [df, quota]

    def download_universe(self, universe, date, formulas, pit='Prelim', precision=4, names=False, currency='USD'):
      """
        Generate a pandas DataFrame based on the provided inputs. Uses 1 api credit per 25,000 data points as of Aug 2023.

        Parameters:
        -----------
        universe : str
            Name of the universe on Portfolio123.
        date : str
            Date for which the ranking is being generated. Format is 'YYYY-MM-DD'
        formulas : list
            Additional data to be considered for ranking. like 'Close(0)' which is fridays close. Note some things may require the PIT license.
        pit : str, optional
            Period in time, e.g., 'Prelim' or 'Complete', default is 'Prelim'.
        precision : int, optional
            Number of decimal places for ranking scores, default is 4.
        names : bool, optional
            Flag indicating whether to include ticker names in the output, default is False.
        currency : str, optional
            Currency for monetary values, default is 'USD'. 'USD' | 'CAD' | 'EUR' | 'GBP' | 'CHF'

        Returns:
        --------
        pandas.DataFrame
            A DataFrame containing the generated ranking data. Added the date as a column
      """
      ranking = self.client.data_universe({
          'universe':  universe,
          'asOfDt': date, # 'yyyy-mm-dd'
          'formulas': formulas, # ['Close(0)', 'mktcap']
          'pitMethod': pit,
          'precision': precision,
          'includeNames': names,
          'currency': currency
      },True) # True - output to Pandas DataFrame | [False] to JSON.

      dates = pd.to_datetime([date]*len(ranking))
      ranking.insert(0, 'Date', dates)
      return ranking

    def download_weekly_ranks(self, universe, ranking_name, start_date, end_date, add_data, pit='Prelim', precision=4, method=4, names=False, NACnt=True, finalStmt=True, node_type='factor', currency='USD'):
        """
        Download ranking from multiple dates. Note that to calculate some additional stats like alpha to the universe some additional date is required!
        Uses 1 api credit per 25,000 data points as of Aug 2023.

        Parameters:
        -----------
        universe : str
            Name of the universe on Portfolio123.
        ranking_name : str
            Name of the ranking system on Portfolio123.
        start_date : str
            Start date to get data. Format is 'YYYY-MM-DD'. Note that the resulting dataframe will use the previous Saturday as the date
        end_date : str
            End date to get data. Format is 'YYYY-MM-DD'. Note that the resulting dataframe will use the previous SSaturday as the date
        add_data : list
            Additional data to be considered for ranking. like 'Close(0)' which is fridays close. Note some things may require the PIT license.
        pit : str, optional
            Period in time, e.g., 'Prelim' or 'Complete', default is 'Prelim'.
        precision : int, optional
            Number of decimal places for ranking scores, default is 4.
        method : int, optional
            Numeric code representing the ranking method, default is 4 which is neutral, 2 is negative.
        names : bool, optional
            Flag indicating whether to include ticker names in the output, default is False.
        NACnt : bool, optional
            Flag indicating whether to include the count of missing values, default is True.
        finalStmt : bool, optional
            Flag indicating whether to include if the stock has a final statement, default is True.
        node_type : str, optional
            Type of node for ranking, e.g., 'factor' or 'composite', default is 'factor'.
        currency : str, optional
            Currency for monetary values, default is 'USD'. 'USD' | 'CAD' | 'EUR' | 'GBP' | 'CHF'

        Returns:
        --------
        pandas.DataFrame
            A DataFrame containing the generated ranking data from one date to another
        """

        current_date = datetime.strptime(start_date, '%Y-%m-%d')
        end_date = datetime.strptime(end_date, '%Y-%m-%d')
        combined_dataframe = pd.DataFrame()
        required_data = ['(Open(-6)-Open(-1))/Open(-1)']# This gives a Monday to Monday open gain which is what I trade. Change if you trade another time

        while current_date <= end_date:
            previous_saturday = current_date - timedelta(days=(current_date.weekday() + 1) % 7) # This calculates a more accurate asofDate
            previous_saturday_str = previous_saturday.strftime('%Y-%m-%d')
            dataframe = self.download_rank(universe, ranking_name, previous_saturday_str, required_data+add_data, pit, precision, method, names, NACnt, finalStmt, node_type, currency)
            dataframe.rename(columns={'formula1': 'MM_gain'}, inplace=True)

            # Calculate the universe gain and then each stocks alpha!
            univ_gain_percentage = dataframe['MM_gain'].mean() # Calculate the universe return
            dataframe['univ_alpha'] = dataframe['MM_gain']-univ_gain_percentage # Calculate the alpha and add to the dataframe
            combined_dataframe = pd.concat([combined_dataframe, dataframe], ignore_index=True) # Add it to the dataframe

            current_date += timedelta(weeks=1)

        return combined_dataframe

Here are the examples for each api function: Make sure to only run the one you want and not all of them or you will burn your credits. Also I did not add them all, just the rank related ones for now.

# Initialize the api class
api_id = 'Your api id'
api_key = 'Your api key'
api = Portfolio123API(api_id, api_key)

#-------------- Examples for each function below -------------------------------

# Update a ranking system ------------------------------------
xml_str = '''
<RankingSystem RankType="Higher">
	<StockFormula Weight="0" RankType="Higher" Name="Factor" Description="" Scope="Universe">
		<Formula>PEExclXorQ</Formula>
	</StockFormula>
</RankingSystem>
''' # this string needs to match the format of the xml string in portfolio123 ranking system
api.rank_update(xml_str, 'stock') # note it will return True if it completes, but otherwise gives no indication it completed
print("API Ranking system updated!")

# Download ranks from a ranking system  ------------------------------------
ranks = api.download_rank('Easy to Trade US', 'All-Stars: Greenblatt', '2023-05-04', ['Close(-1)'])
# Note that the (0) date is always the friday before the date given. (-1) is a Monday or the day after the Friday. The date you give does not matter!
print("Ranks from ranking system are:\n")
print(ranks)

# Download data from a universe  ------------------------------------
universe_data = api.download_universe('Easy to Trade US', '2023-05-04', ['Close(-1)'])
# Note that the (0) date is always the friday before the date given. (-1) is a Monday or the day after the Friday. The date you give does not matter!
print("Universe data is as follows:\n")
print(universe_data)

# Calculate rank performance ------------------------------------
[perf, quota] = api.rank_perf('Easy to Trade US', 'All-Stars: Greenblatt', '2013-01-01', '2023-01-01', 0.25)
print("Remaining quota is: " + str(quota))
print("Performance plot below:")
perf.plot()

# Download ranks over multiple dates! Includes universe alpha calculated column
# Note that this function adds a universe alpha column that is based on Monday open to Monday open future returns!
weekly_ranks = api.download_weekly_ranks('Large Cap', 'All-Stars: Greenblatt', '2023-07-01', '2023-07-31', ['Close(-6)/Close(-1)-1'])

# Save to a pickle which is very fast to load, but not human readable
weekly_ranks.to_pickle('data.pkl') # This saves the data as a pickle. You can load it using: weekly_ranks = pd.read_pickle('data.pkl')

# Save to a csv, slow to load, but human readable
weekly_ranks.to_csv('data.csv', index=False) # To load it again use: weekly_ranks = pd.read_csv('data.csv')

print("Ranks from ranking system are:\n")
print(weekly_ranks)

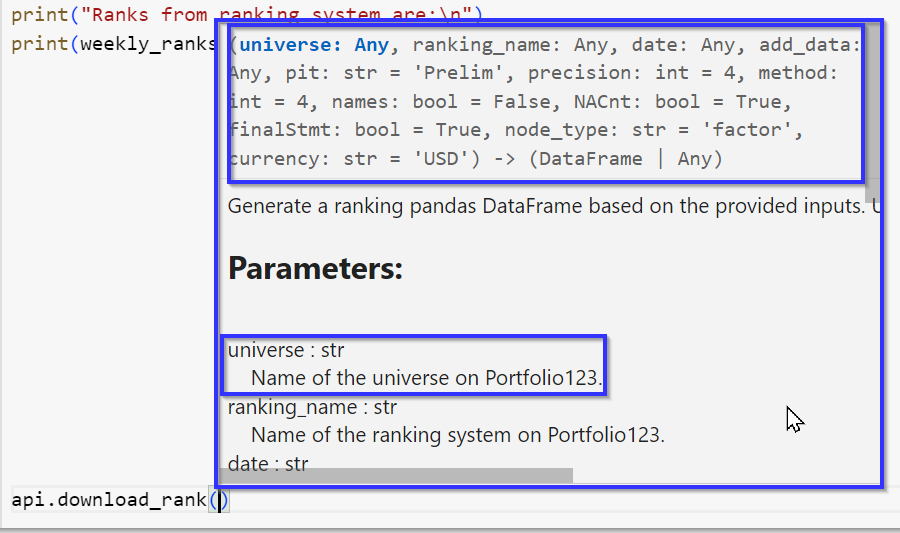
Example of the prompts as you type (from the doc strings):

Thanks,
Jonpaul

2 Likes

Jonpaul,

Thank you!!! I have copied the code. I will try to learn form it, use it and/or copy and paste parts of it.

Posting by itself and reading your post got me thinking about this. Posting has really helped me to learn. I would not have said this yesterday and this may be subject to change.

So, using the r2_score FOR TRAINING could basically make one immune to overfitting, I think. Especially if combined with subsampling in XGBoost and cross-validation (k-fold say).

But of course CAGR–for say a 25-stock model–is really what we care about for our retirement plans.

In the way of background, there are some papers recently linked to on the P123 forum where the authors do better out-of-sample when they use long/short to train rather than just long. The argument made by the authors was the model is trained to more data with long/short and this increased sample size which generally reduces overfitting.

So, CARG as a metric will fit you to 25 stocks each week. The easy-to-trade universe has 3,796 stocks in the screen today. r2_score will be fitting to every one of those 3.796 stocks. This a bit of an increase in the sample size. If I remember my physics classes, this is more than 2 orders of magnitude, I believe 2 orders of magnitude is nothing to taken lightly. This effective sample-size is increased again with bootstrapping or subsampling.

This could be part of an algorithm that would be useful for reducing overfitting is my conjecture (yet to be proven). I would still use CAGR for my holdout set.

In summary, I don’t know where one could come from as far as their belief in statistics and not think a method that fits to 3,796 stocks each week (e.g., r2_score) versus 25 (e.g., CAGR) is not going to be less prone to overfitting.

Also, I have been working on my algorithm to decide if Sklearn is actually useful. I actually cannot prove that yet but will prove that it does or does not work. I will accept the answer I get, I hope.

So I will train data up to say 2016. Use k-fold validation with r2 as my metric for training and cross-validation to find the best model (Boosting, random forest, SVM, Elastic net etc).

BUT, for my holdout sample I will use CAGR (with my best model above) to see how my model would have done from 2016 till today. Done right that would be a true Out-of-sample test of the usefulness of machine learning with Sklearn. In other words I will know whether to keep doing what is working now at P123 or move to an Ultimate membership for daily rebalances with Sklearn.

BTW, one could easily add code to subtract slippage each week, from my code for CAGR.

TL;DR: There may be room for both r2_score (for training) and CAGR for the holdout set. I hold out the possibility that Spearman’s rank correlation would be even better than r2_score for training. Fortunately, I think I can code that.

Thank you.

Jim

1 Like

bump bump

1 Like

Confirmed. Using Close() with a negative value falls back to last value. We’ll have to investigate the reason.

Future%Chg() seems to address this. Can you just use Future%Chg for now?

Also when copy/pasting YAML files the format is very important. Always include the important sections and use the “Preformatted text” under the gear icon in the forums editor. It will make it more readable.

Thanks

Date        P123 UID    Ticker           Close21      Future21
2023-08-05  61784       ETON                4.26            NA
2023-08-12  61784       ETON                4.26            NA
2023-08-19  61784       ETON                4.26            NA
Main:
    Operation: Data
    On Error:  Stop # ( [Stop] | Continue )

Settings:
    PIT Method: Prelim # Complete | Prelim
    Start Date: 2023-08-11
    #End Date: yyyy-mm-dd # optional
    Frequency: 1Week
    Region: United States
    Currency: USD
    Tickers: ETON
    Ignore Errors: True
    Formulas:
        - Close21: Close(-21)
        - Future21: Future%Chg(21)

Future%Chg isn’t useful to me since under the DataMiner it starts returns from Friday. I want returns to start on Monday.

Marco,

There is quite a bit more that Walter and Jonpaul have been asking for.

The main thing they really want is to be able to rebalance a port that uses XGBoost on a Friday with updated ranks (Jonpaul anyway). With updates from Thursday and Friday morning.

There is a specific array that would facility this. And it is SO NOT A MYSTERY TO ANYONE WHO EVER DID A A SINGLE MACHINE LEARNING PROBLEM WITH SKLEARN. But I posted it at least a dozen times to avoid any confusion about the most important thing to being able to use a trained machine learning model.

BTW, Future%Chg(21) gives you look-ahead bias and should be corrected I believe. Better would be 1WkTradedRet: 100*(Close(-22)/Close(-1)-1) .This was posted over a week ago with a big yawn from whomever might still be reading the forum over at P123.

Yuval says he officially does not listen to any feature requests involving machine learning with a change in title, although it is hard for me to see any difference at all in the forum. Dan said he would get back to us last week.

Hence the bump from Walter.

There are lots of post on this with a case-use. I can repeat them or link to them. I do actually think Dan understands pretty good.

This is THE MOST IMPORTANT THING YOU CAN DO TO MAKE P)123 A SITE THAT ATTRACTS MACHINE LEARNERS. This has been a request of mine for 10 years (in one form or another). You should listen or prove me wrong on this, I think, if you want to be a machine learning site. If that is, in fact, part of your business plan… But I posted the format 20 times at least.

I do think you will end up thanking be again as you did when you decided to start doing the API and DataMiner, in part because ranks have as much value to machine learners as do fundamental values. Something I pointed out a while ago.

You are just beginning to attract people like Jonpaul (who wants to use XGBoost) with P123 to the site. You may want to keep them coming I would think.

Jim

We should have two fixes soon:

Future% functions will not use the previous day close as the starting value. For example

Close function, and all OLHCV functions, used with a negative value will return NA if there’s no price in the future. Could be due to a stock having stopped trading or your lookahead exceeds the latest end of day.

The first has passed the test. The second is about to the tested.
Thanks for the suggestions

2 Likes

Marco,

Thank you.

I was a little behind on how to use DataMiner and Dan has helped me get caught up. Dan and others are now fixing some minor bugs in DataMiner.

Because of what you have done, I can use DataMiner downloads to train a model. And now I can fairly easily use a Monday download to make predictions and essentially rebalance a machine learning port on Monday. Rebalances on other days of the week are more difficult for now.

This is extremely cool! Jonpaul is looking into doing this with XGBoost now. I have just started looking at a random forests and some linear models.

This is extremely positive progress compared to when Marc Gerstein called my ideas Physics Envy, I had to get the downloads thru sims for training and copy and paste from the screener (because of the 500 row limit) to rebalance an XGBoost model.

Thank you for making this possible! And again, thank you Dan.

TL;DR: My only point in everything I have said is now days people will want to turn spreadsheets (csv files or any download) into Pandas DataFrames and P123 could facilitate that. Could consider answering any reasonable request for this THAT WOULD BE PROFITABLE from a business perspective.

Jim