There are already some discussions in forum about how to find the periods when investment styles like value, growth etc. are working and when not.
But I might found some interesting mechanics about detecting periods when factors working well in general: The idea is that in periods with efficient markets it’s harder for factor investing than in periods of less efficient markets. You might recognize this periods after crashs (using technicals in order to detect that), but it might also be possible to detect it by valuations. Let’s assume therefore that in periods with efficient markets the standard deviation of valuation factors may be smaller than during less efficient markets.
I created two series which I use in the Stocks Screener for identifying less efficient market times:

and for more efficient markets:
I chose OpInc, because it is less volatile than Cashflows (which are usually my preferred metrics). If we use TTM and 3YAvg than an inefficient market is detected early, but also for a longer period (the idea behind that is that an efficient market can be become inefficient quite fast by a crash, but it takes longer to become efficient again).
If the screener rules with OpInc are applied to the SP500 universe, it happens that a direct comparison between the universe average and stddev can be used without a multiplier (if using other income metrics or universes a multiplier might be necessary)
Hint: The benchmark in the screenshots is the RSP (equal weighted S&P500).
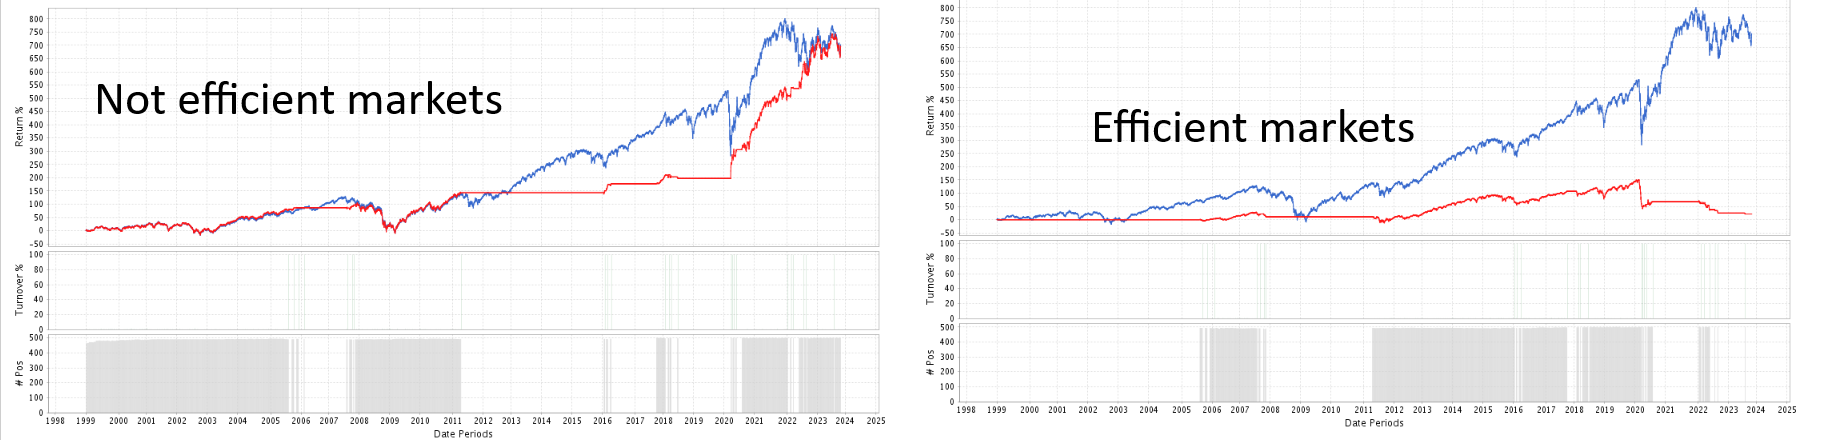
We can see that with these rules both periods are more or less similar long (and therefore the returns could be directly comparable to each other) and that the SP500 stocks perform overall better during the non-efficient market periods.
But what leads to even more interesting results is to use factors like OpIncTTM/MktCap, for example by buying the top 10% (Using the Quick Rank in the Screener).
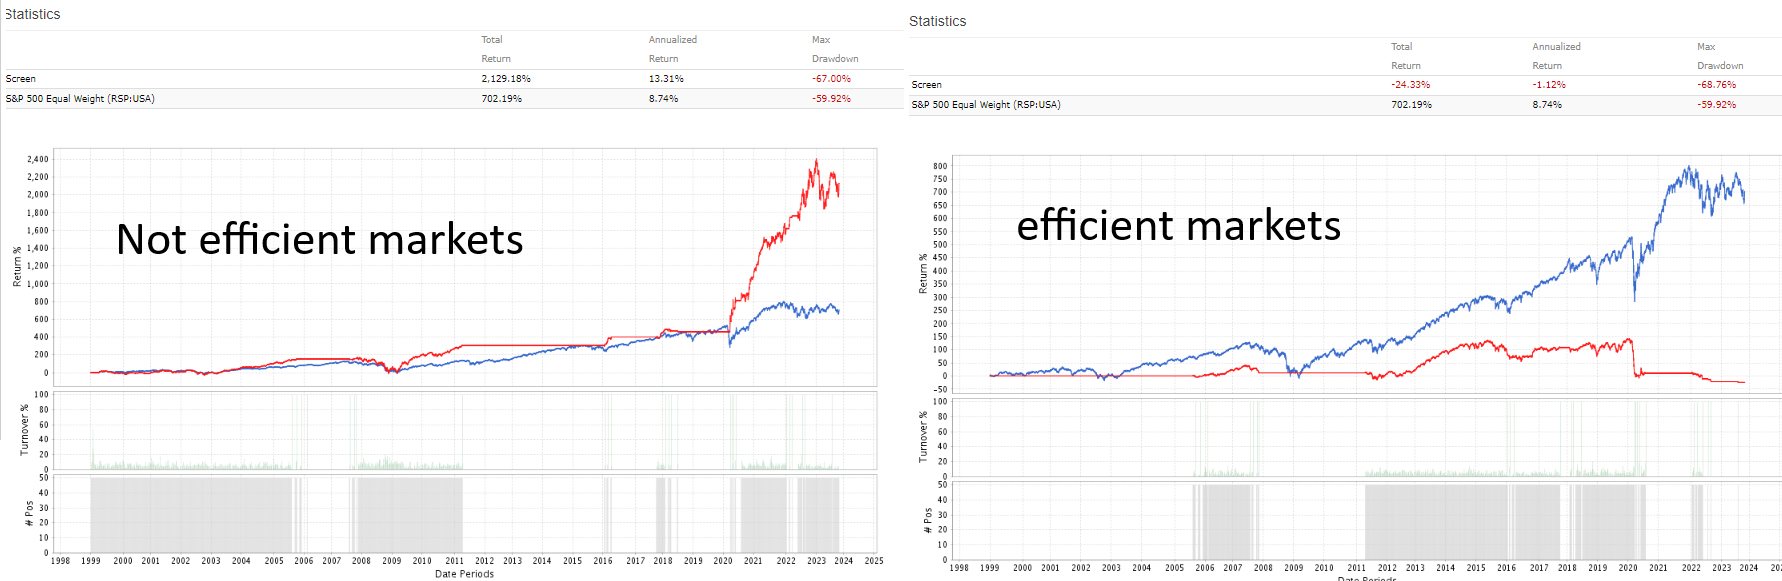
We could conclude that during the inefficient market times the metric OpIncQ/TTM works better that during the efficient market periods, right?
Using other factors, esp. valuations and sentiments, are working very similar in these two time periods. A view factors like Momentum are working less well and some other metrics like CROIC are working inversely, but a majority of metrics is working better in the less efficient market times.
When I use this same detection logic for a multi-factor ranking (which I use for real investing) on a broader universe, the difference is also quite pronounced:
Yearly returns in efficient markets: 21%
Yearly returns in inefficient markets: 48%
What do you think about this approach? Actually I hesitate to use such market timings, because the multi-factor approach works in both market periods and timing the market has an increased risk of over-fitting.