Yes, definitely I think. Move to Quantopian for the opportunity to start from scratch and try to duplicate what Marco does for us. And good luck with that!!!
Over someone who can fully integrate FactSet data with Python?
Maybe but it depends on how well they are using Python. I believe some of these people (mostly institutions) have an edge over us. No doubt in my mind.
Over everyone combined (average retail investor, Quantopian and Institutions)?
I do not know and things can (will) change.
Are we already seeing a change?
Something changed, right? Maybe it will change back.
I think it’s increasingly going to be difficult (note, difficult …not impossible) to invest in micro and small caps until we get a full on recession and the market resets. At this point of a almost decade long bull market if you’re still in the micro or small cap space, and either haven’t graduated up to mid-cap and/or bought out, maybe you’re just not a good company. If you’re looking to catch the next generation of good small cap young companies on the way up, you’re chosing from a lot that the the VC boom of the last 5 years didn’t snatch up first. Right now I see a lot of SPACs and a lot of fallen angels hoping for a desperation turn around story that might get a temporary YoY bump on a recent earnings report because the previous comparison year was abysmal.
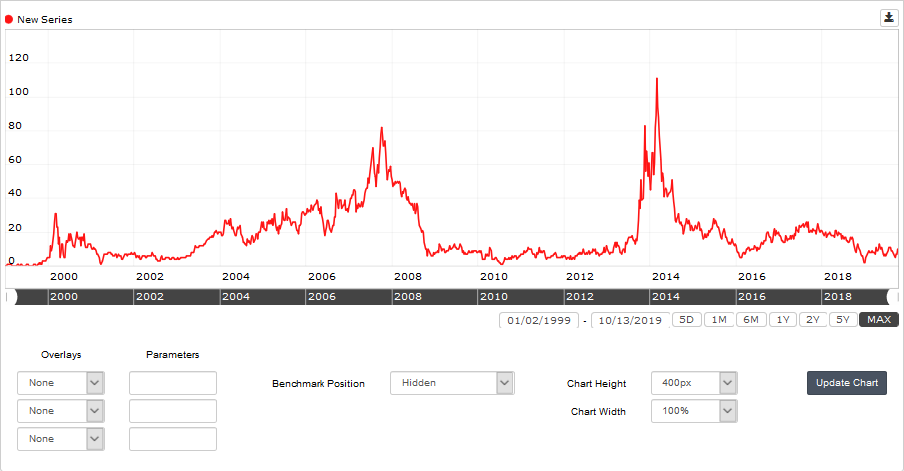
I created a custom series that shows the number of mid caps in the “All Fundamentals” universe that were microcaps five years earlier. Nothing has changed. Very very few microcaps ever go on to become mid caps.
I like this a lot. I like that it is simple and gives me hope that we may be able to look back and say it all made sense. Maybe after a recession what worked before will start working again.
The other thing you probably thought about and did not put in your short post is M&A
These companies essentially disappear. You will not find them as Mid-cap stocks now and be able to look back and see them as small-caps.
Anecdotally, when was the last time you had an M&A for one of the stocks in your Ports? This could be looked at objectively too, thru a custom series, and it may not be a factor. I have not looked at this in an objective manner.
Anyway, whatever is going on, I like your idea and wonder if the inversion of the yield curve might still be a reliable signal with your main point holding: hard for small-caps to do well until the reset of a recession. I do not really know and only time will tell but thank you for your post and your main point would probably be my bet for now.
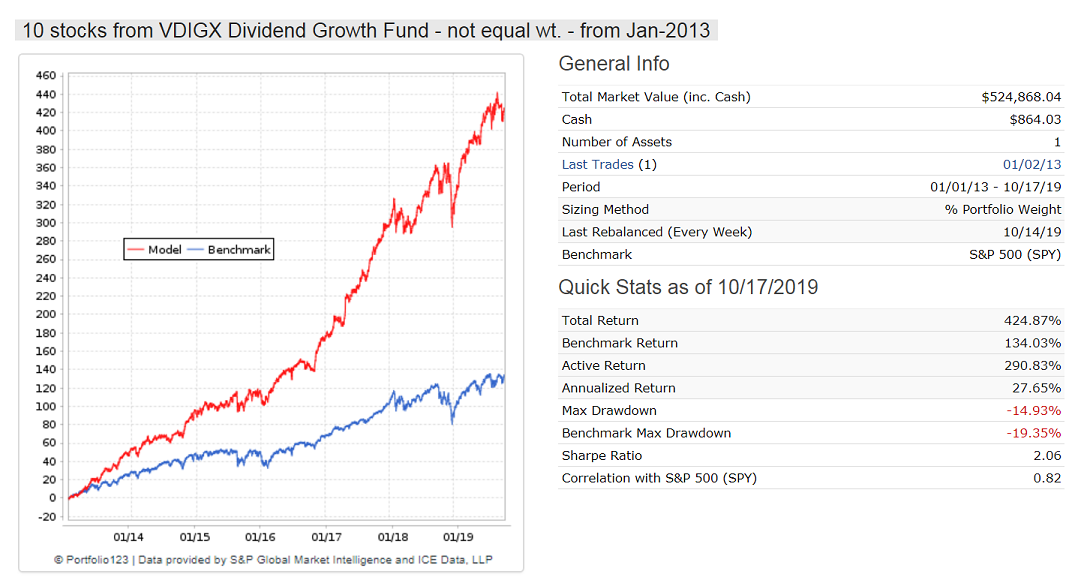
P123 gives you an edge. As mentioned on page 7 of this view-thread I like to use as universe stocks from ETFs or mutual funds selected by capable managers. I particularly like the Vanguard Dividend Growth Fund VDIGX for which I have periodically downloaded holdings since 2014.
I have now constructed a model that uses the historic holdings for the backtest, using portbars to define the appropriate list of stocks to be used as the universes over time. I have launched this as a designer model so that we can watch performance. You can read the description here: https://www.portfolio123.com/app/r2g/summary?id=1587460
Performance chart since 2013 is attached. Because VDIGX’s holdings do not change much over time the 2013-2014 performance should not be much affected by survivorship bias; from late 2014 onward the model uses a dynamic VDIGX universe which is updated every three months.
Do you think something cyclical has been going on recently? If so, what do you think it is? I do think it has been pretty significant and generalized (whatever it is) as many on the designer models would suggest. (Mean of the 2 year excess returns: -17%)
You said the inversion of the yield curve probably would not cause a recession before June 2020 (if I remember correctly). Any update on this signal?
Actually, I would be interested in any impressions you have (or any signals).
Jim,
It is tough to make money in the current stock market environment. I have no evidence of anything cyclical going on, but I would stay out of small- and micro-cap stocks.
As to recession probability:
We publish weekly the iM-Business Cycle Index on our website and on Seeking Alpha.
Here is the perma-link to to the latest update, it never changes: https://imarketsignals.com/bci/
When the BCIp and/or BCIg goes into the danger zone then it would be prudent to lighten up on stocks because a recession is then imminent.
“The great sag?” I am not sure I even know what that means. And honestly, if he is right I hope history comes up with a better name.
Still, the track record of Ray Dalio (who controls largest hedge fund that you cannot invest in) is second to none. He seems to be one of the few who makes useful macro predictions.
Note: He says we have already entered into “The Great Sag” so technically this would not be a prediction. But that would be consistent with already having an average -17% 2-year excess return on our Designer Models.
These are the stats on the models currently available. I personally look for positive 1 and 2 year periods. There’s a handful of models that are positive from inception but when you look at the last couple of years, it’s trailing the market by quite a bit.
All huge numbers even “long time” shown is just cherry-picking bias. Statistically, few from hundreds inevitably will get good results even long term (but not more than let’s say 5 years).
An opportunity to make alpha not by chance lies into some competitive advantages/not crowded markets: non-public info, value creation itself (active investors with big shares), tech advantages (in few hedge funds for example eaten by their fees), private equity deals (not so efficient markets) etc. Making ranks, models, whatever else won’t create enough to produce visible after all expenses alpha at least in commonly used ways (short strategies, for example, are not crowded yet - but again borrowing costs may eat a huge amount of alpha, P2P lending into capital lacking markets etc).
Here at Portfolio123, we’re trying to make it easier to get alpha. Try out the Core: Combination ranking system (https://www.portfolio123.com/app/ranking-system/354585 ). Do some bucket tests on various universes. You’ll see: alpha is still there, even using pretty generic and traditional factors. The secret is a simple one: avoid stocks that are overvalued, overhyped, poorly managed, low growth, or highly volatile. Look at the low end of the bucket tests and you’ll see what I mean. And yes, it’s been hard to make alpha lately, but it hasn’t been very hard to make money. Maybe, just maybe, the harder it gets to make money, the easier it’ll be to make alpha.
I used pretty much the same ranking with hundred factors in some variations https://www.portfolio123.com/app/ranking-system/335897
Real-life alpha for 5 years is very small or negative (not considering aka 5-10 tickers lucky outlier ports). Short ports make alpha but the average borrowing costs in IB for my 20 tickers port is 15% which halves potential performance (some stocks cost 50-100% annual interest).
Granted, Google probably is not using quantum computers for investing YET. But de Prado is planning for the future and has a chapter about it in his book: “Advances in Financial Machine Learning.”
Realistically, where are the institutions now? Somewhere beyond the spreadsheet I would say. And some claim the market was efficient before the spreadsheet was developed.
The Designer Models lost a little ground last week—as did the percentage of my investments in individual stocks or ports.
In the late stages of bull markets, comments like these are always prevalent. However, markets are cyclical, and mean-reversion is the most powerful force in investing. You should keep in mind the phrase, “this too shall pass” at all times (because it will).
If you continue to try to use the same old factors that academics (most of whom have never invested a dime of their own in their lives) proposed decades ago – of course, you’re going to have problems! It’s akin to hooking up a team of horses to your new Tesla. However, if you think uniquely and outside-the-box, you can still attain exceptional performance during any phase of the market.
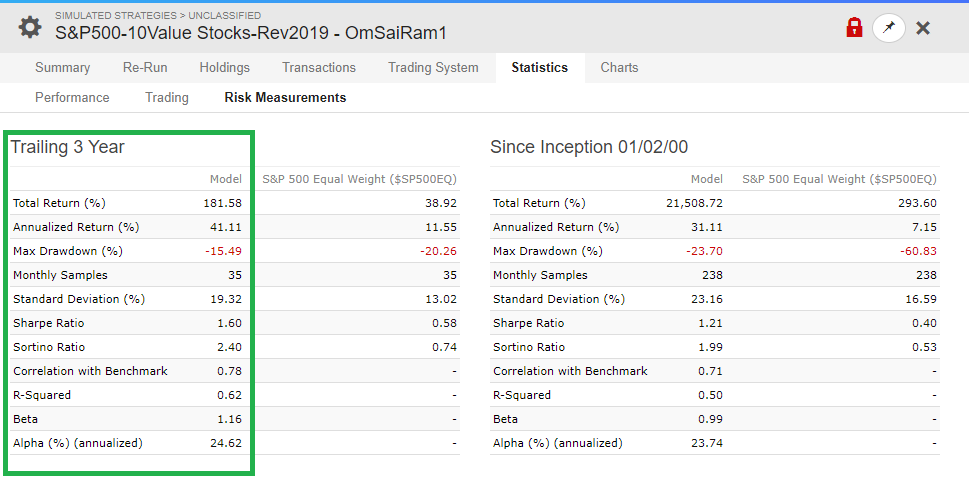
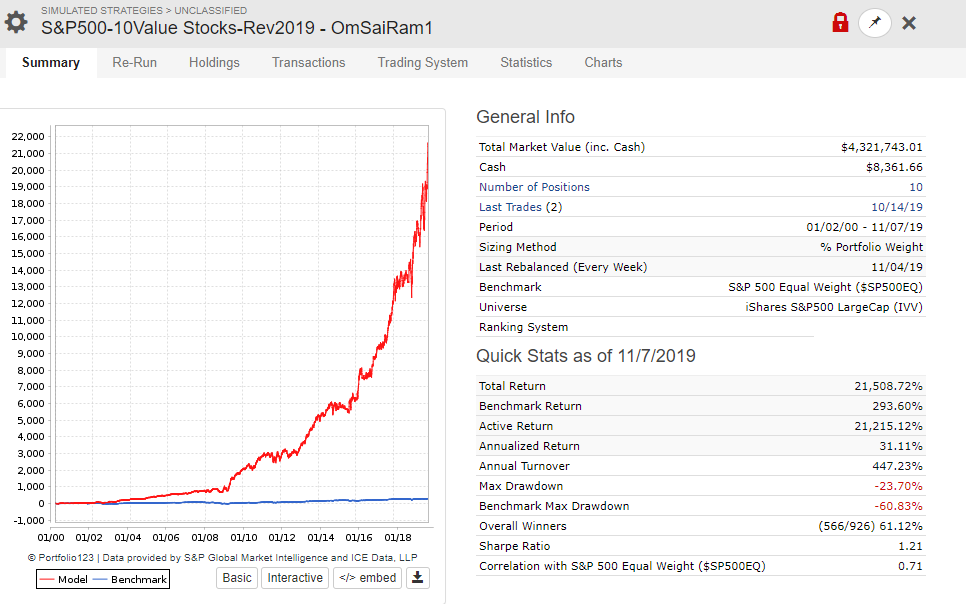
The strategy stats displayed below, from a model I dubbed the “Adaptive Equity+ (2-ETF) Strategy,” has an annualized return of 69% for 2019 with a max drawdown of just -7%:
Since inception before the Financial Crisis, this strategy produces an annual return of 39% with an MDD of -23% (compared to -56% for the benchmark). It was launched in 2006 because that’s when enough higher-performance, 2x leveraged ETFs became available, which this model infrequently uses (only when conditions are exceptionally bullish and stable). The long-term performance since inception would be much higher than 39% had today’s ETF universe been available since the beginning. Nevertheless, this start date does show that it performed great throughout the Financial Crisis; i.e., lost nothing during the downturn, and gained 324% while the S&P 500 spent five years working back to break-even.
In the last two years, the return is 64%, so its performance has been improving in recent years, going against many of the negative themes in this thread. Moreover, the risk is declining, with a Sortino since inception at 2.30 and in the last three years at 3.47.
To get these kinds of returns, you have to take an Outside-the-Box approach: The strategy uses a Universe of 1,637 ETFs selected by Merrill Lynch (Merrill Edge Select™ ETFs) based on an ample volume in the underlying stock holdings, stability, and viability for fund continuity. Market timing and ETF-selection is based on a sophisticated composite employing as many as 38 different data sets with a cross-section of macroeconomic, fundamental, sentiment, and technical indicators.
The model uses seasonality measures that can trigger a switch to more conservative universes and more conservative timing signals during the historically volatile and dangerous summer months and October. A long-only strategy, the model uses no inverse ETFs and when conditions are adverse, it holds two cash-proxy ETFs (BIL and SHY). The average hold time is 33 days or about 1.6 months, requiring only two ETFs to provide ample diversification, so it’s nearly effortless to manage.
Declaring that “nothing works today” is a self-fulfilling prophecy, when in fact, perhaps you only need to look in different places or in different ways.
The investment markets are vast, and as Cramer used to say (is he still on TV?), “There’s always a bull market somewhere!” Today, I’m working on several other unique approaches, such as a ‘Low-Volatility Leveraged Fixed Income Strategy’ that has a return of about 40% and a Sortino of 3.89, a unique Asset Allocation Strategy, a ‘Sector Magic Strategy,’ a ‘Country Rotation Strategy’ and a 15-Technical Indicator composite RS that delivers the signals for a super-aggressive (yet low-risk) S&P 500-based ETF model with an 80% AR, -12% MDD, and a Sharpe since 1999 of 2.54. There are far more unique ideas for effective investment strategies today than there is time to configure and test them!
Think uniquely and stay determined! If you do, you’ll find ways to work around the cyclical premia deterioration issues in classic investment factors like value and momentum (which I don’t use at all). To avoid the problem of factor deterioration, also focus on maximizing robustness and avoid overfitting.
You might also want to test your factor set on an annual or quarterly schedule to determine if there has been deterioration and manually adjust the weightings in your ranking systems accordingly – or build an automated assessment system. Innovate – and get away from the idea that you can build a system once and forget about it forever. The market is a dynamic, evolving organism, and investors must evolve along with it.
P123 gives you all the tools you need to build models that can be successful today, tomorrow, and far into the future, regardless of what the market is doing. But you must be innovative and remain determined!
“Since inception” and “this strategy produces” and “It was launched” imply that you actually created this strategy prior to 2006 and have been using it since. I’m reasonably certain that that is not the case. When posting things like this it’s important to distinguish between backtested (optimized) results and real-money real-time investment results, and words like those are misleading. It would be better to write, “I began the backtest before the Financial Crisis, and this strategy would have produced . . . I began the backtest in 2006 because that’s when enough . . .” It’s better to use the conditional tense rather than the present tense for backtested results.
You do have an edge. Your average one-year excess returns are 2.6% and your 2-year excess returns are 1% (excluding fees). For all of your models that has one or two year excess returns.
Better than any developer I have looked at recently. I am not sure I would spend hundreds of hours to get that, however.
I take the opportunity to mention your results because it is a chance to highlight positive results.
I don’t know why you would say that, Yuval. I have been operating quantitative stock-based strategies since about 1993 if I recall correctly. My first very rudimentary ETF-based strategies were introduced to the public in 1998 when a new website was launched, and more have been added regularly ever since. Obviously, this work pre-dates 2004, when P123 first got off the ground (and when I joined the site). ETFOptimize is a change of monikers that was prompted by a 100% focus on ETFs and giving up on stocks.
Until relatively recently, a lot of this work had to be done off P123, largely using data from other providers, such as CapitalIQ and FRED. I really look forward to the introduction of the API that will allow us to import and use our own data, which Marco announced some time ago. Is there any estimate of when that capability might be introduced? Thanks.