Gents,
I have been experimenting with downloading factors from P123 using the Download Factors tool and through the AI Factor interface. In the first case P123 provides a csv file, and in the second case P123 provides a parquet file which can be transformed into a csv file with a few lines of python.
I have run into some differences when using these two methods that I wanted to highlight for the community, because I feel they are of interest and will effect any kind of model fitting that a user might attempt with the data. I first noticed the differences when downloading factors for a custom universe, but for purposes of this post I have just focused on downloading factors for the p123-defined Large Cap universe.
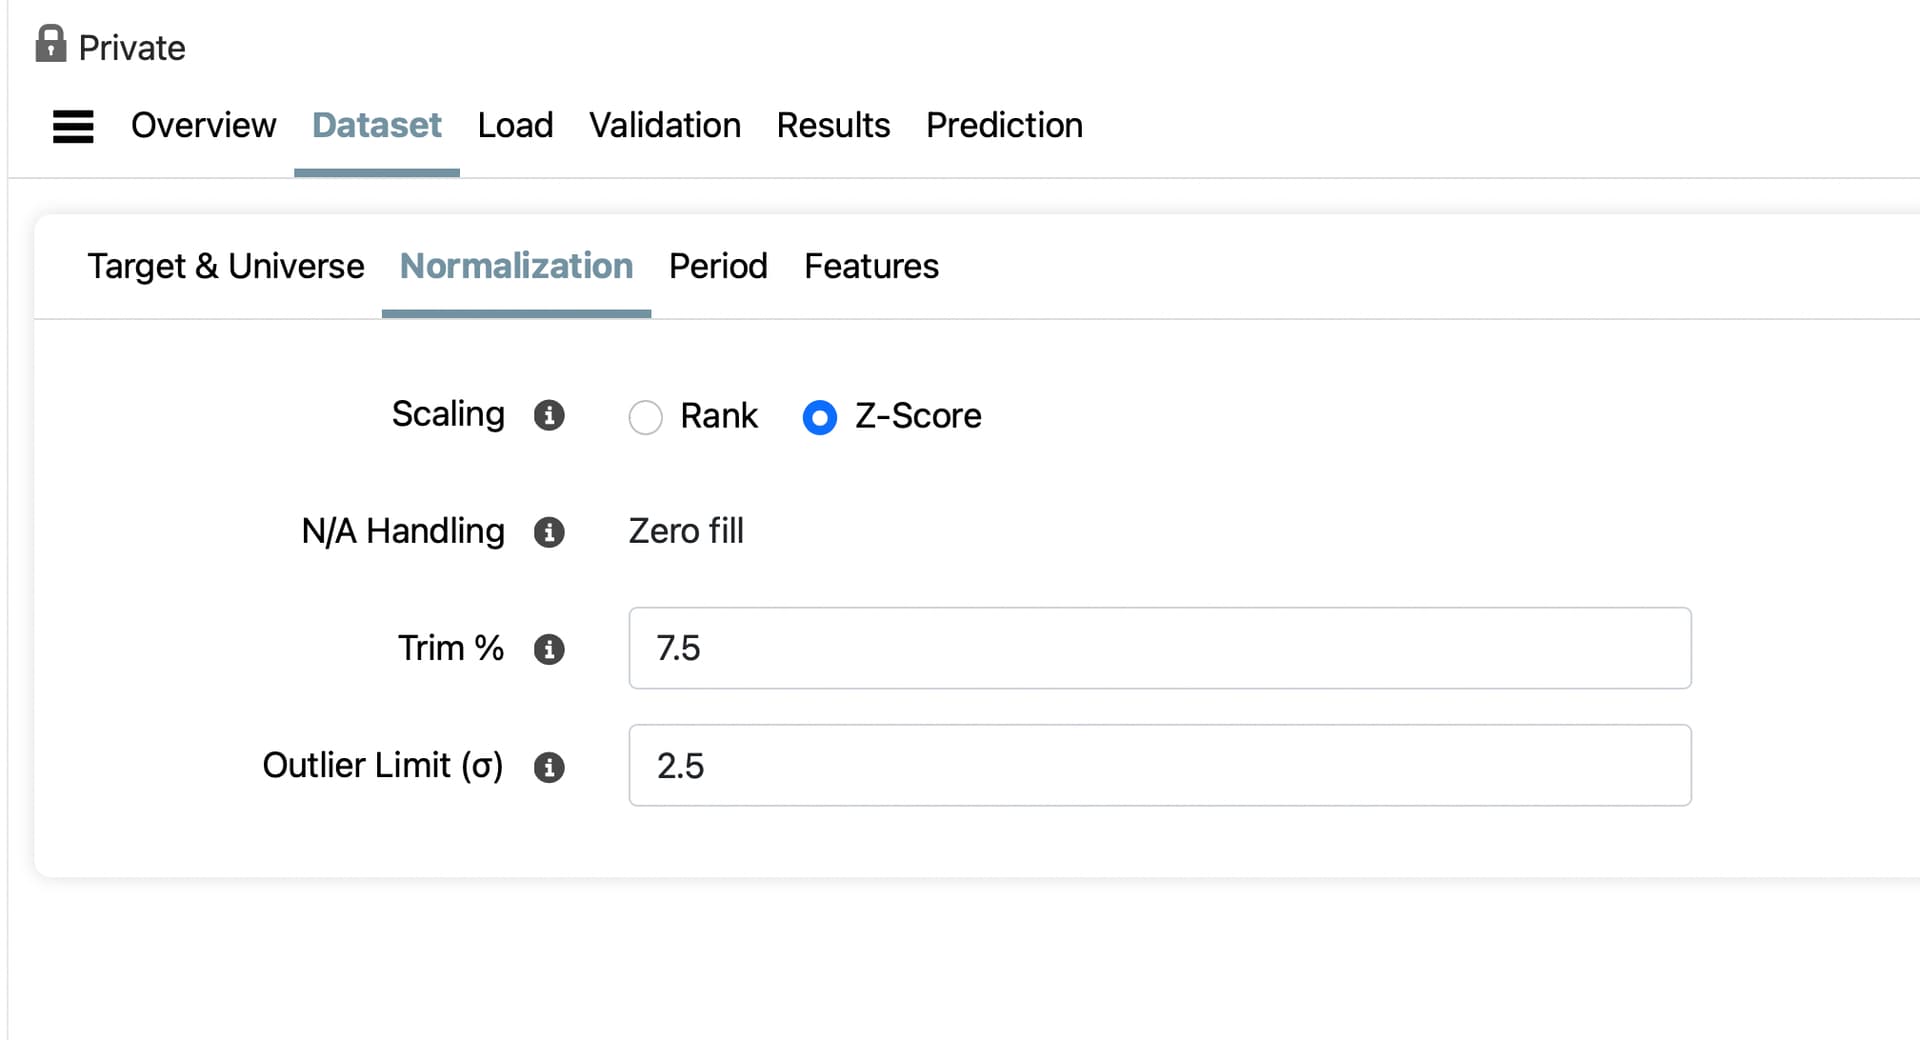
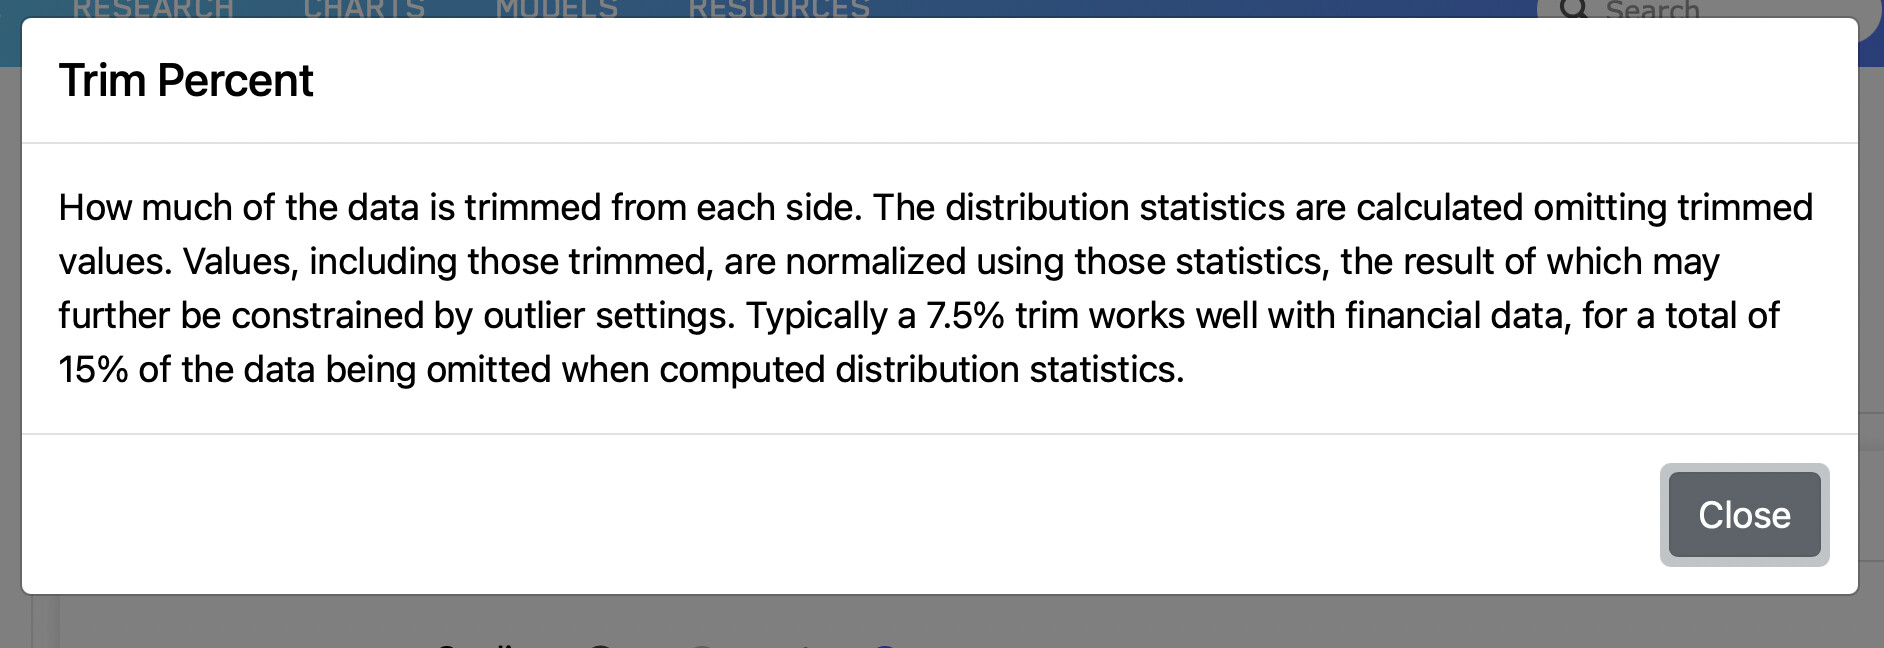
The table below summarizes the differences in the average number of tickers per day downloaded depending on the tool used and the settings in the tool. The data period of the download was 1999-01-02 to 2017-12-31. A set of 24 factors was used; some of them relatively complex. Both tools were set to Z-score normalize the data per Date with an Trim % of 7.5 and an Outlier Limit of 2.5. The NA Handling for AI Factor defaults to Zero Fill, and the NA Handling for the Download Factor tool was set to None.
| Tool | Universe | Prelim Data? | # Factors | Avg # Tickers Per Date |
|---|---|---|---|---|
| Download Factors | Large Cap | Excl Prelim | 24 | 614.0 |
| AI Factor | Large Cap | ?? | 24 | 351.0 |
Note that the difference in Avg # Tickers Per Date between the AI Factor tool and the Download Factor tool is substantial (bordering on huge). It is unclear to me why this would be the case, and I have spent some time trying to figure it out. The first thing I tested was what the impact of the factors being queried had on the difference. I ran both tools with just a single factor “MktCap”, and got the following results
| Tool | Universe | Prelim Data? | # Factors | Avg # Tickers Per Date |
|---|---|---|---|---|
| Download Factors | Large Cap | Excl Prelim | 1 | 614.0 |
| AI Factor | Large Cap | ?? | 1 | 581.3 |
Clearly the majority of the difference between the two methodologies has to do with the factors being queried and my best guess is that AI Factor is throwing out Tickers that have too many NAs. Of course, even in this simple case you are seeing a 6.5% difference in the number of tickers per day which seems odd.
Given this information I began examining the the differences between the two large datasets I downloaded in detail. In particular, I looked at the differences between the Tickers that were in both files and the Tickers that were just in the Download Factors file. The chart below summarizes what I found
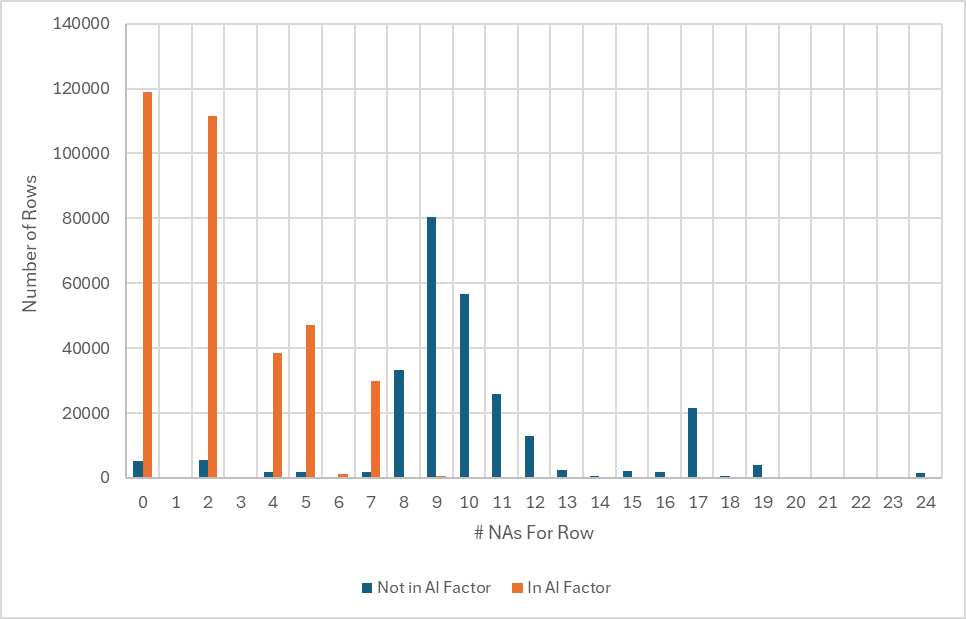
Note that the rows (each row represents a specific Ticker on a specific Date) in both datasets (represented by the orange bars) almost all have less than 8 NAs (<1% have more than 8 NAs). Since 8 NAs represents 1/3rd of the total number of features (24) in this dataset I am guessing that the AI Factor tool has a behind the scenes rule to exclude rows that have more than 33% NAs. (Can someone from P123 confirm this and give a brief explanation for the rule if it exists?)
Such a rule would explain a large majority of the differences, but not all of them as 6.5% (same as the % difference when just downloading the MktCap factor) of the rows not found in both datasets have less than 8 NAs. I have been unable to determine a reason for these rows being excluded by AI Factor.
Apologies for the length of this note, but I wanted to highlight one more issue that I found when using the Download Factors tool. If your universe tests to see if financial data is stale using the StaleStmt=0 formula the number of downloaded tickers varies significantly when Including vs Excluding Preliminary Data. The table below highlights this issue with respect to the LargeCap universe
| Tool | Universe | Stale Stmt Check | Prelim Data? | # Factors | Avg # Tickers Per Date |
|---|---|---|---|---|---|
| Download Factors | Large Cap | Yes | Incl Prelim | 24 | 594.4 |
| Download Factors | Large Cap | Yes | Excl Prelim | 24 | 448.9 |
Note the significant difference between the Avg # Tickers Per Date as a function of whether Prelim Data is being used. This seems reasonable, but might not be something everyone has thought of so figured I would point it out. I assume that the AI Factor tool Excludes Preliminary data by default as there doesn’t appear to way to toggle it on and off.
Would appreciate any thoughts from the community and P123 staff on this issue. I still haven’t decided if I think the 33% NA cutoff (assuming it exists) is the correct approach or not.
Cheers,
Daniel