HI all, Here's a modest price change study around earnings announcements. I'd been wanting to do this for a while and there have been some discussions on this board about what to do with a company that drops in a big way on earnings, so I figure some other folks may have interest.
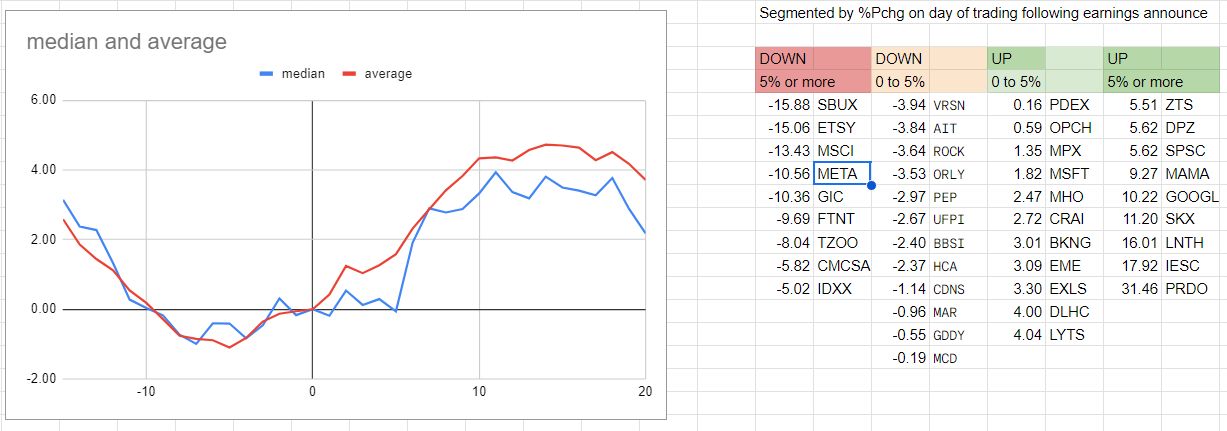
Keep in mind, this is just for a small handful of stocks (listed in first pic) that I held or maybe few I had interest in. And it's only around 40 stocks reporting dates from 4-22 to 5-3 so far. It shows price behavior in 15 days leading up to day 0, the earnings date, and shows the subsequent 20 trading days price behavior. Keep in mind these results may be highly specific to the kind of stocks I hold and factors I use.
The first pic is price behavior (median and average price change) leading up to earnings date for the 41 stocks listed. Some are large caps, some are small.
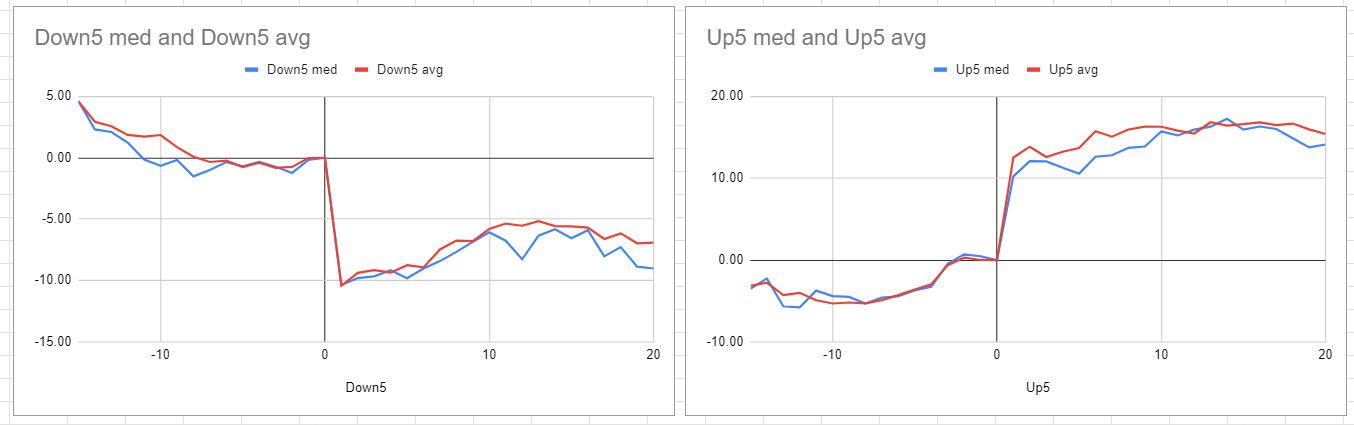
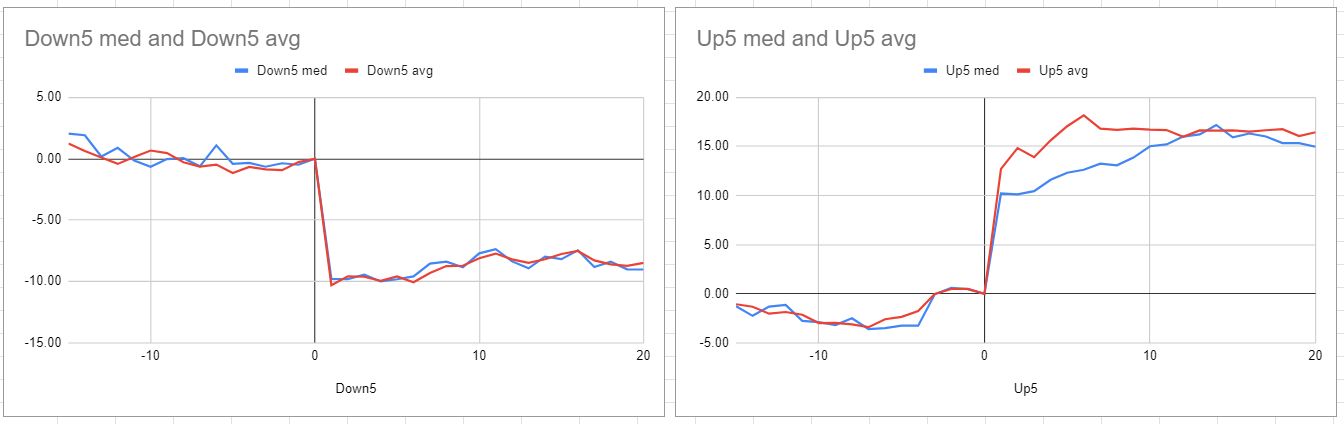
The second image shows price changes for stocks with 5% or more price moves either up or down. Based on what I'm seeing from this small sample: for big drops on earnings of 5% or more, it suggests maybe holding for about 10 days to recover about 4pp of the initial day 1 drop, but may be hard to tell because overall market rose some during this time also. Maybe these stocks are just floating with the market after the big drop, but I think maybe waiting a bit might have some merit unless you have something to immediately deploy to. Also interesting for positive day 1 movers, during this timeframe, day 1 pops of 5% or more seemed to mostly hold going forward in aggregate. Medians and averages shown.
I have not attempted to remove market movement from this (not normalized), and it seems overall the market trend was somewhat positive, so some upward drift is likely due to overall mkt through reporting period and into May.
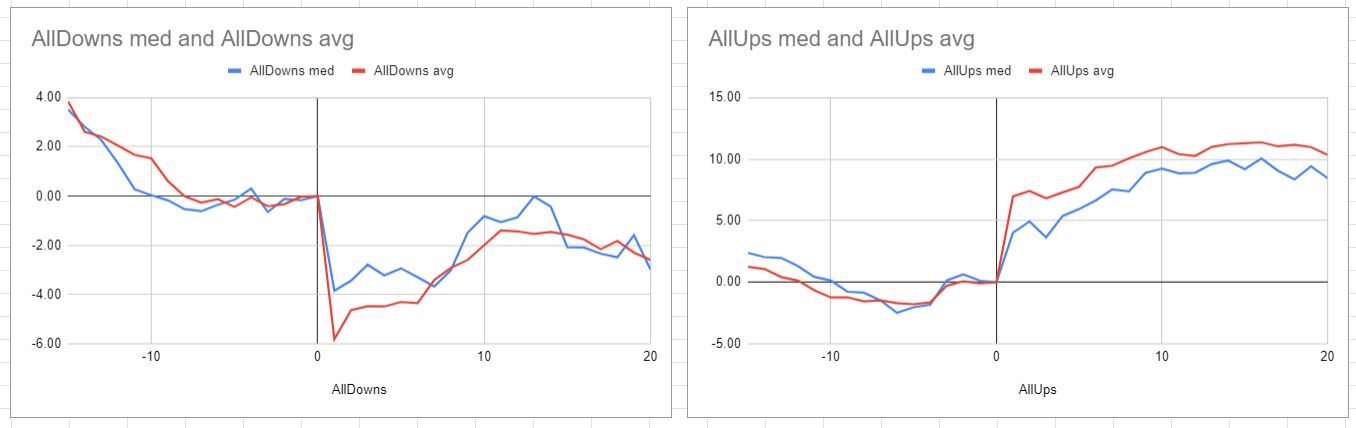
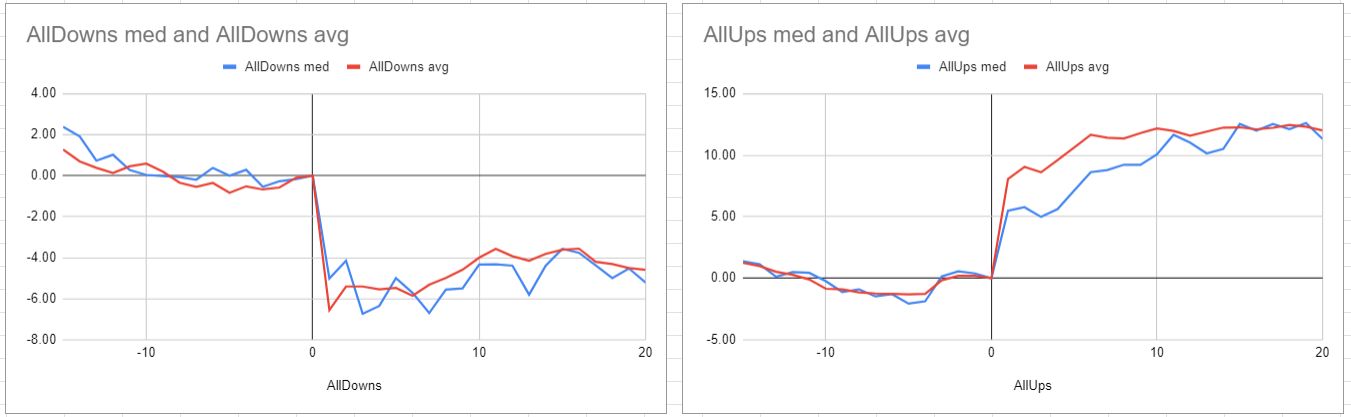
This final image is just an aggregation median and average movements of the day 1 decliners and the day 1 advancers (including both 5+% movers and 0-5% movers)
Anyhow, wanted to drop this here. All the best,
5 Likes
This is why having and studying alpha returns on this platform are crucial. One cannot study individual stock returns without accounting for beta and other factors.
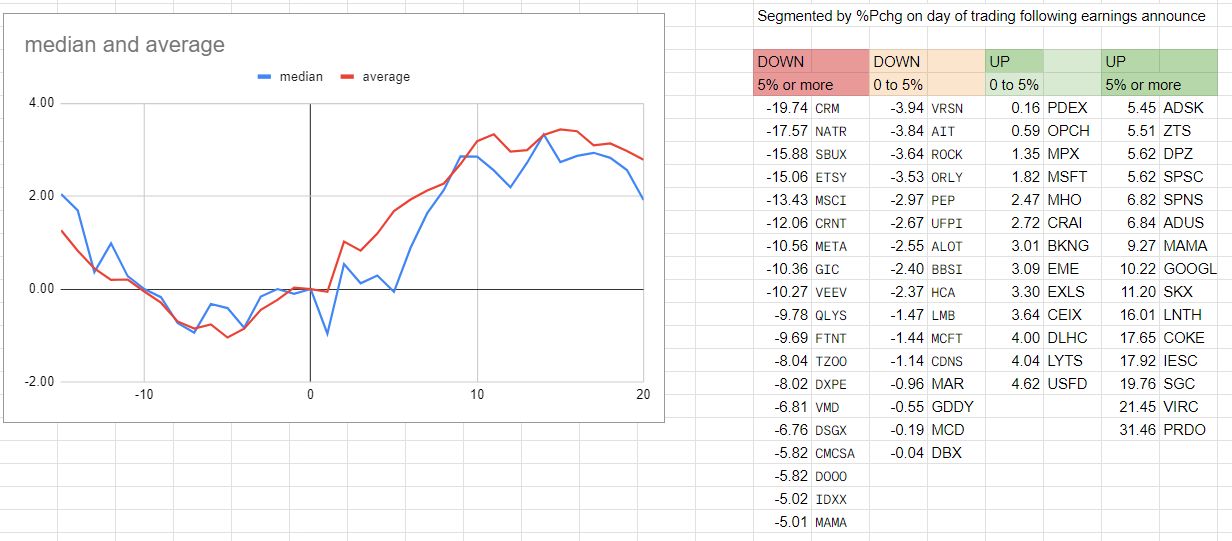
Updating this for any future searches looking at earnings announcement behavior. Added more companies from past earnings season so that 63 companies are now in study. These are mostly things I hold/held at time, or was interested in/watching. Mix of large and small caps.
Overall there were more drops on earnings than pops, and that aligns with my sense that there's negative asymmetry around risk on earnings announcement for individual companies in my systems/screens/stocks I hold, but of course, this is only one data point. (and avg behavior was up after earnings)
Anyhow, slides w/ average and median pre/post earnings performance updated for 63 companies listed in first slide. I've tried to avoid errors, but ... 
Here's all movements of 5pp or more in positive or negative directions
Here's all ups/downs aggregated
1 Like
You can gauge how well a stock has done around previous earnings announcements, which may give you a clue as to how well it'll do around future ones. Try FHistAvg("Close(BarsSince(LatestNewsDate)-2)/Close(BarsSince(LatestNewsDate)+1)-1",8,13); this looks back 8 quarters but you can change it to look back more or fewer by changing the 8 to something else. This works best if you use it with higher values better on stocks with WeeksToQ<=1.
2 Likes
Yuval, this was clever, but have you ever tested whether there are any correlations between how the company performed before and after the last earnings announcement?
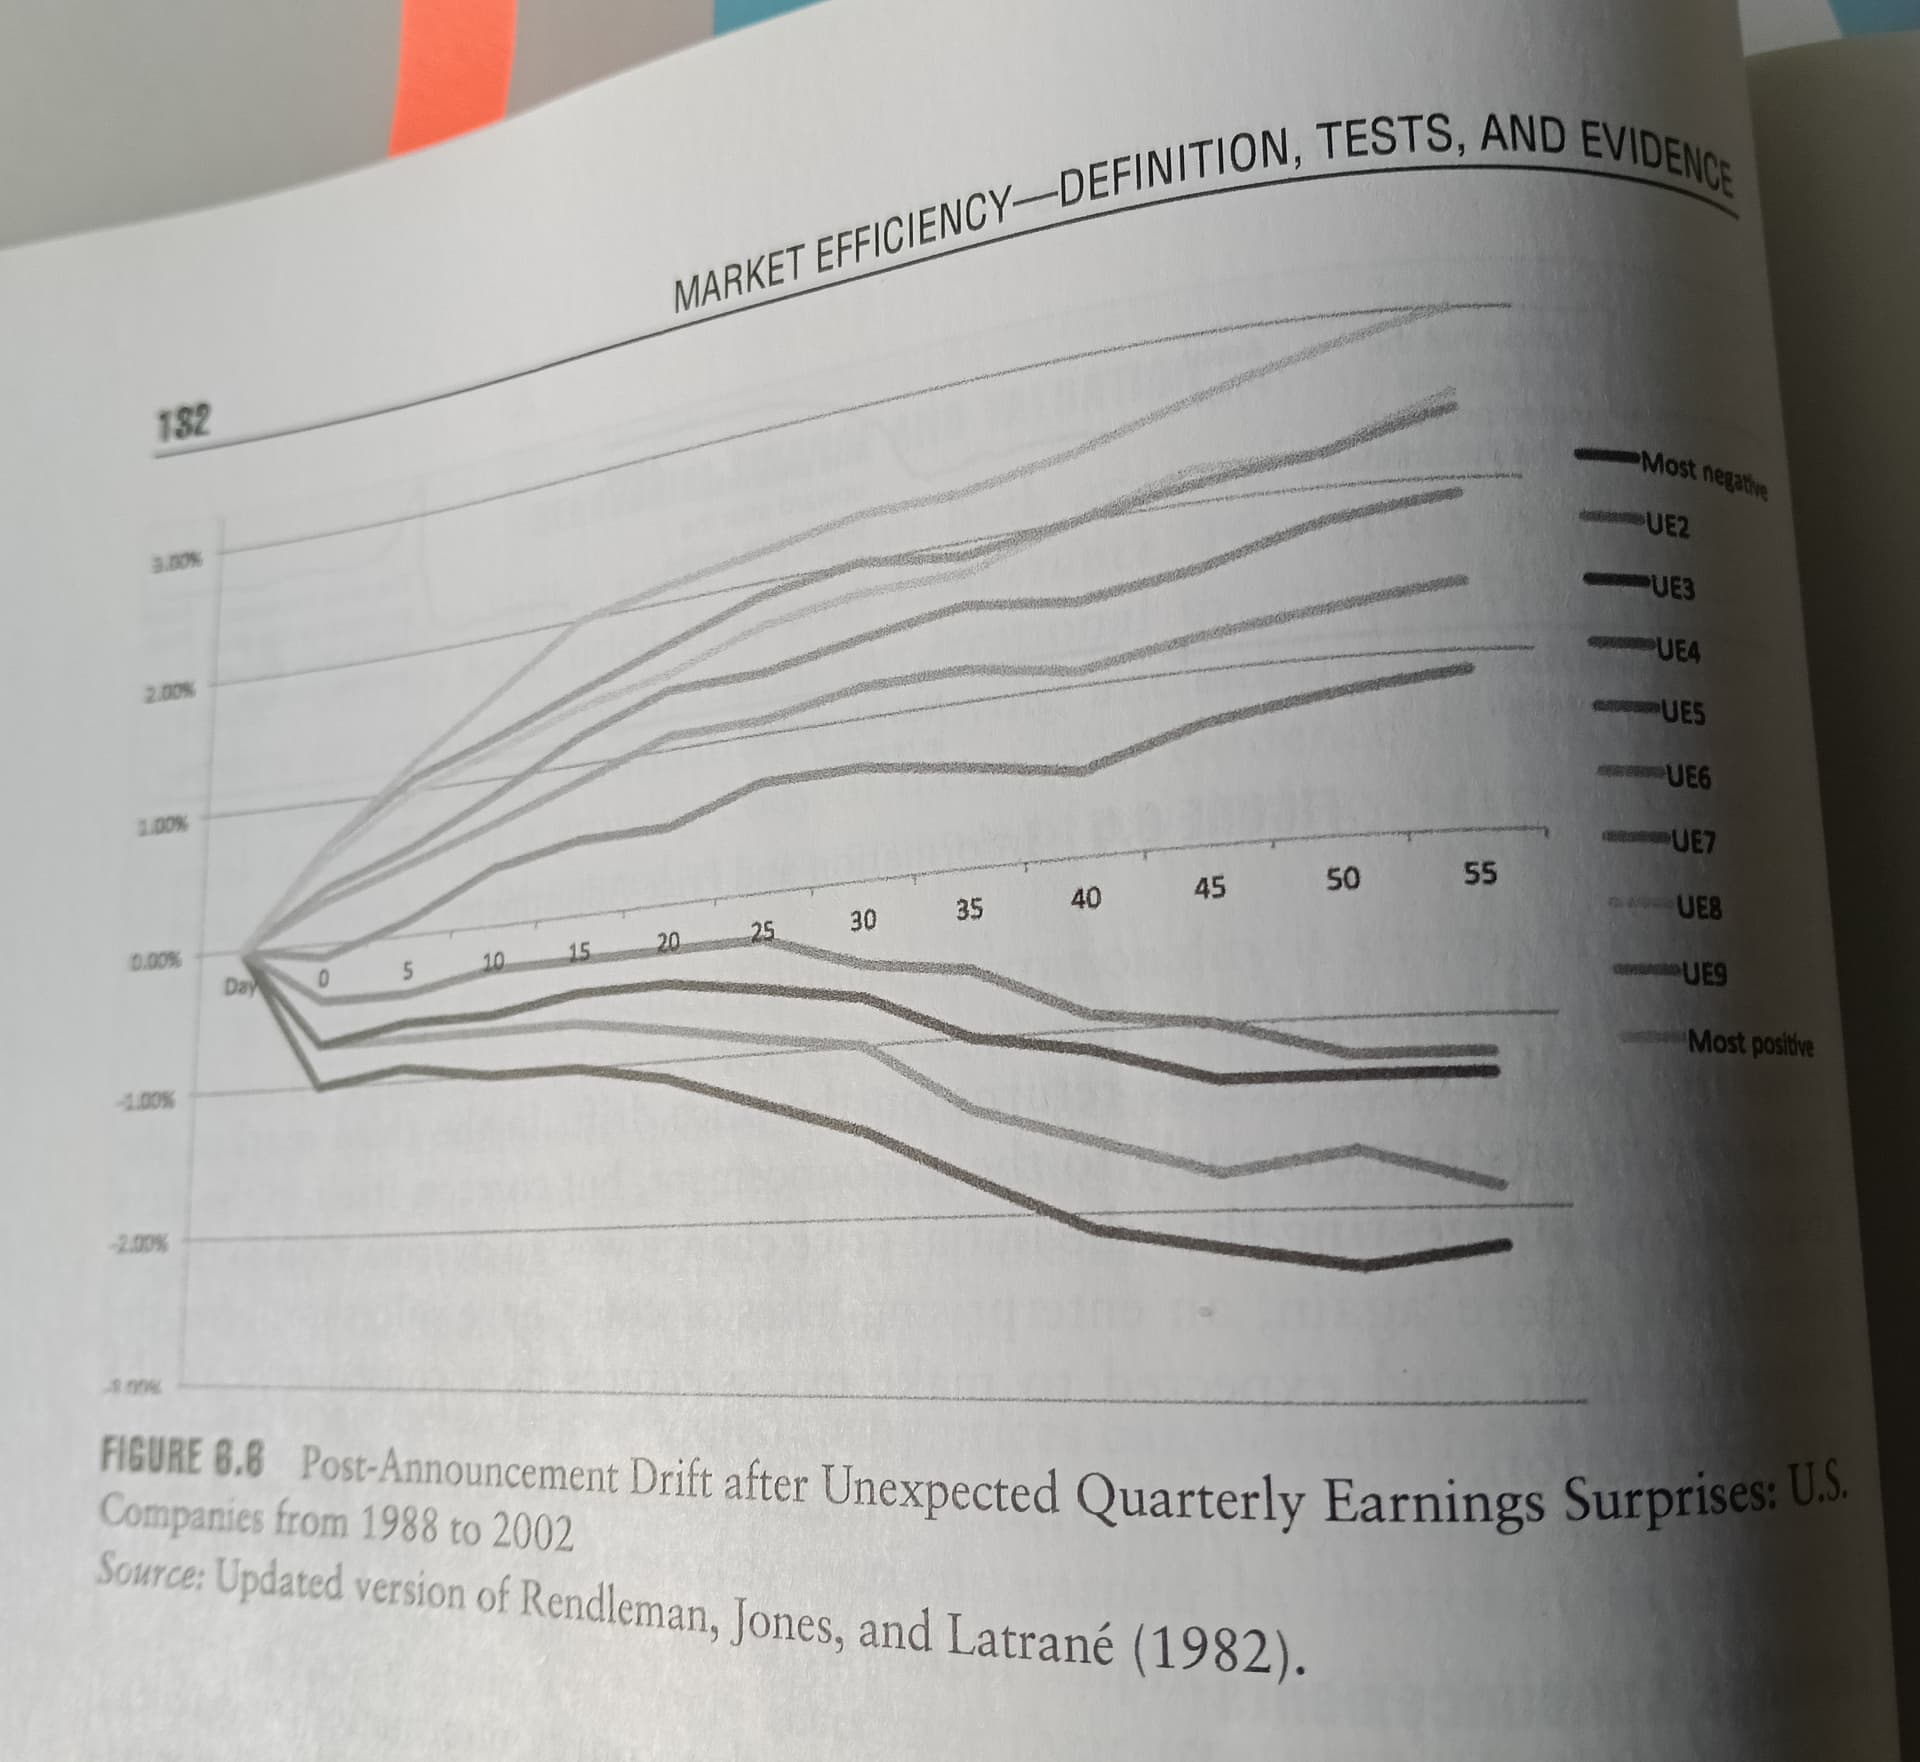
Here , there is an old study of that if can help in some way
Based on my (limited) experience, most of a day's gain or drop tends to occur within the first 15 minutes of trading or during the pre-market session, where applicable.
Each day, I dedicate some time before the European or U.S. open to update my stock rankings based on earnings releases. I typically participate in the opening auction to promptly sell a position in any name that has reported poor results and is likely to be removed from my portfolio based on the updated ranking.
Bear in mind that rankings in P123 may not reflect earnings updates for smaller European stocks for anywhere between 2 and 30 days — there's no telling exactly when the update will occur.
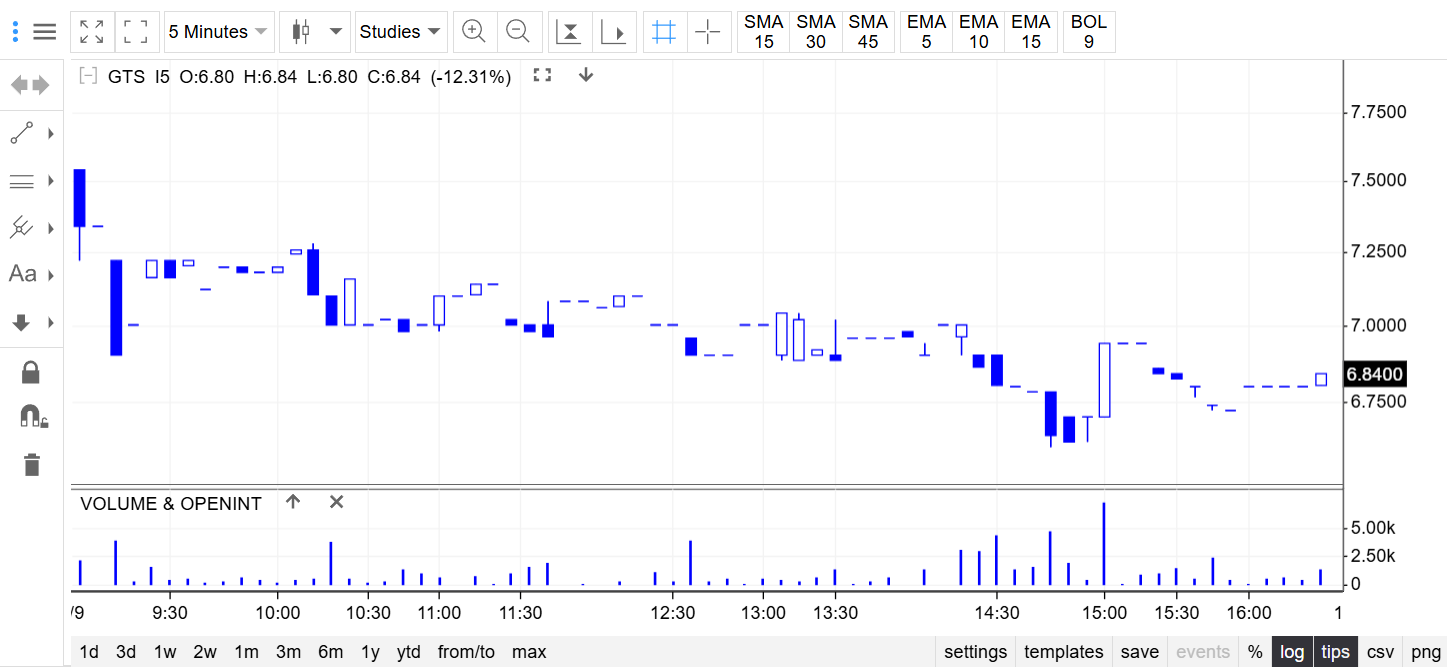
Here’s an example from today: a small Polish stock showed a marked deterioration in the key factors used in my model. A lucky investor could have exited at the open for 7.54.
2 Likes
It depends on what you mean by "before." There seems to be a small correlation between how a company performs after one earnings announcement and after the next.
1 Like
Hi Yuval - is there any way to use days instead of weeks for the measurments here? Henrik
I'm afraid I don't understand the question. The measurements I gave were in days:
Sorry. I must have misunderstood. The last parameter is in weeks, I figured the rest also referred to weeks.