It has come to our attention that EPSStableQ is being used incorrectly by a majority of our users. EPSStableQ is the standard deviation of quarterly EPS returns divided by the mean. So if a company’s mean EPS is negative, EPSStableQ will also be negative. Using it in a ranking system with lower better will result in privileging companies with negative returns. The proper thing to do was to use Abs (EPSStableQ), unless you had some particular interest in privileging companies with negative earnings.
We are going to fix this by making EPSStableQ return the absolute value of the standard deviation divided by the mean, which I’m sure is what most of you thought it was doing.
If you were using it incorrectly, your backtests will be different once we make the change. Is that OK? Or would you prefer that we not change your existing systems and make the change effective only for new uses? (We could do the latter by overwriting all current uses with EPSStableQOld and then changing the formula.)
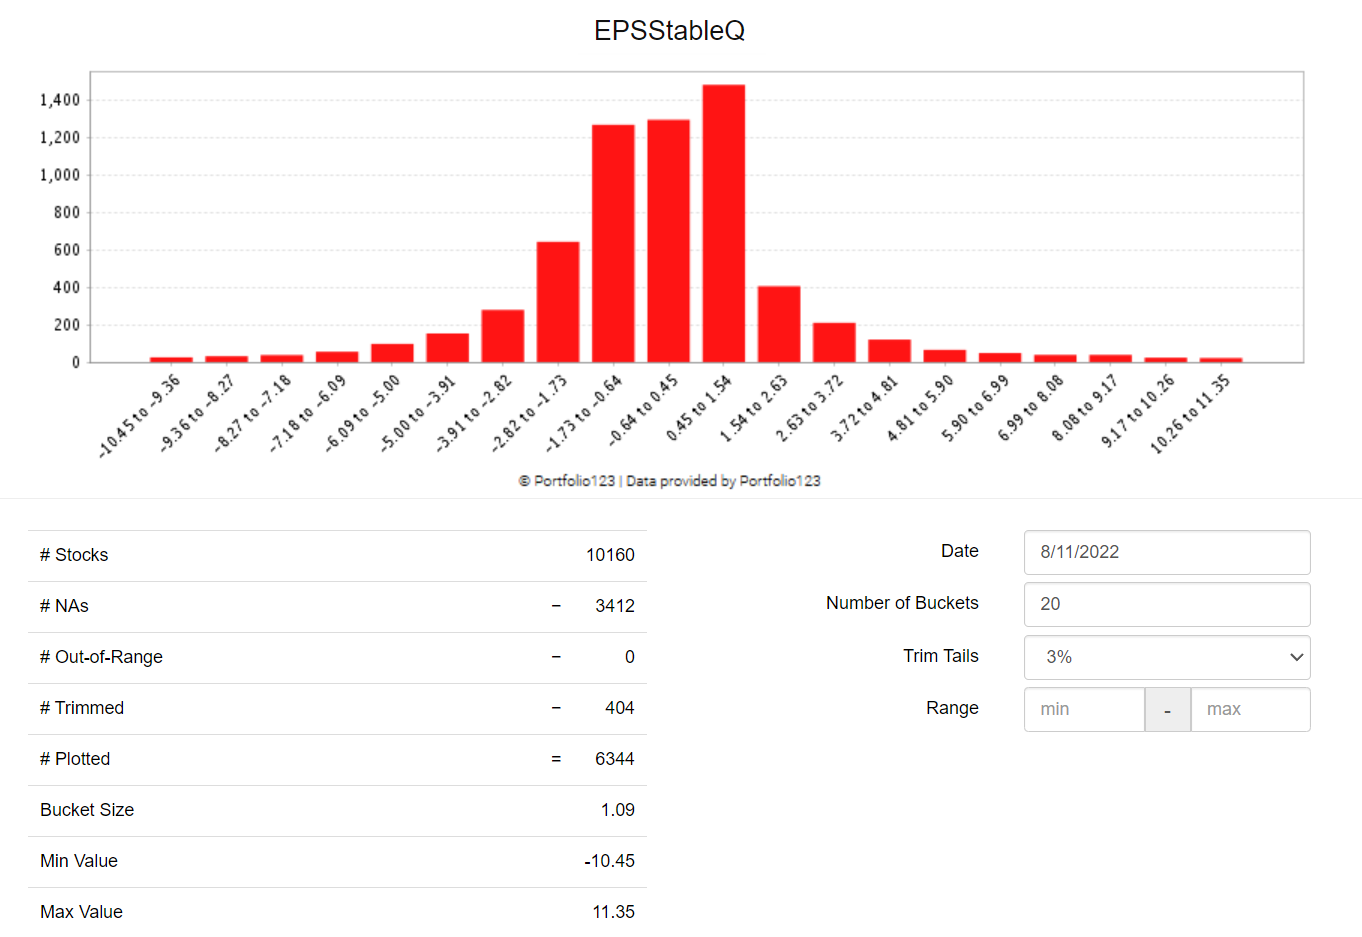
FYI, this is the distribution chart for this factor.
About half of the stocks in USA have -ve values. If you don’s use Abs(EPSStableQ) in ranking then the stocks with the most volatile EPS with a negative mean will get the highest rank. Pretty confident that is not the intended rank in 99% of the cases. Therefore instead of deprecating the current EPSStableQ->EPSStableQOLD I think we should just make it do the right thing even though your backtests will change.
IMPORTANT: This highlights a much bigger issue. You really need to check your formulas often. Right now this is very cumbersome: run a screen with ShowVar, download data and visualize in Excel or something. We need a quick visualization tool for factors/formulas that you can access right from where you are typing the formula. I will start a new thread for design suggestion for a factor visualization tool.
PS: I generated the chart using an old tool that was never upgraded nor refreshed in a long, long time: the "Data Views ". It’s embarrassingly simple and inflexible.
Thank you for fixing/discovering the issue. I don’t use this function, but after reading the post I realized that a couple of my nodes needed an abs() to make sense. Marco: great idea about improving visualization!
Concur on the value of factor visualization. I would like to see something that could be applied to a ranking system. Both at the top-node and at selected sub-nodes and with a selectable universe. Hope that make sense. It does to me right now.
Ok, I’m wrong! Made sense for a minute. But I still have an suspicion that I would like to see node values prior to the ordinal ranking. I’ll let this percolate a bit.
PS That would make sense for the leaf nodes, only.