I was taking a look at EQB:CAN and the Historical Financial Trends graphs and noticed its EPSExclXorQ has been missing since April 2023 (at least as of now) and SalesQ looks odd since 2022 or so. Is there a problem with these?
Investigating. Thanks
It’s pretty ugly on FactSet too. Here’s a screenshot
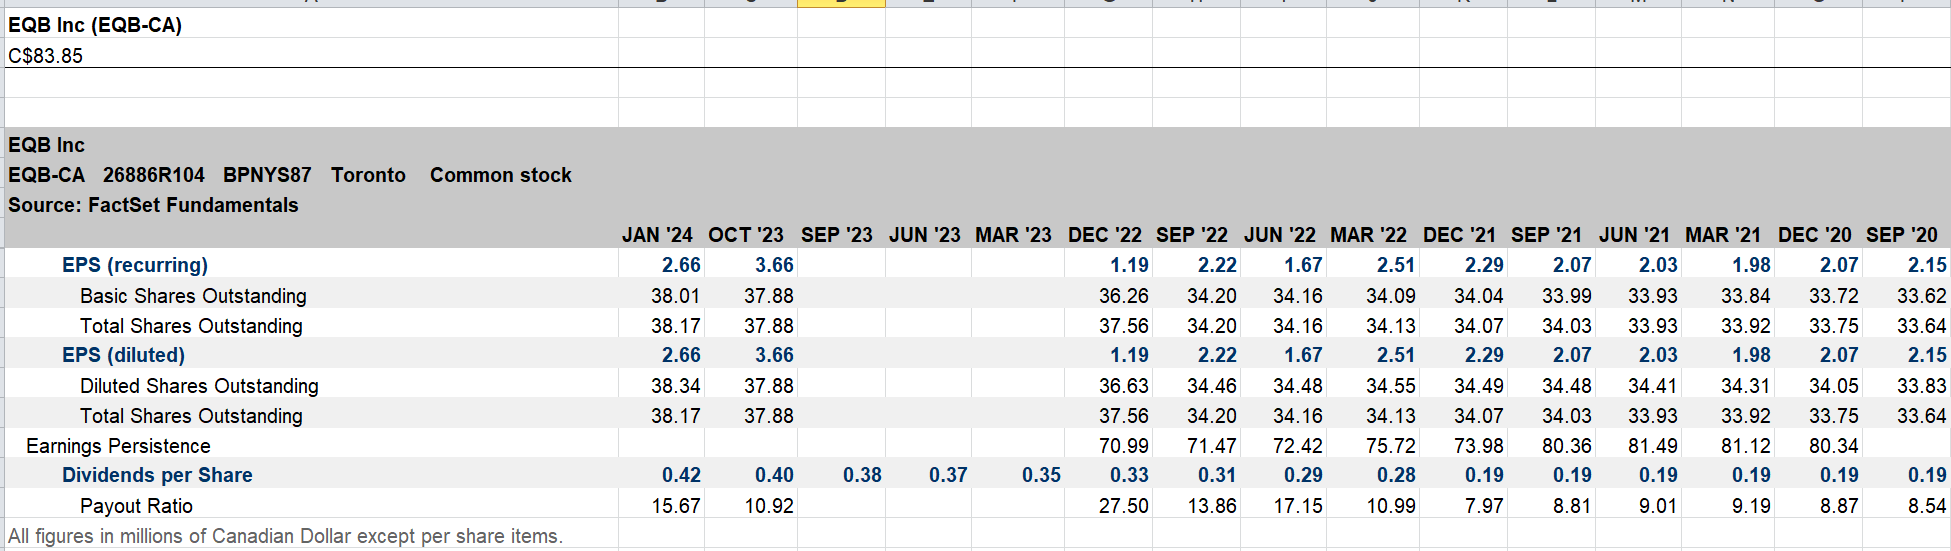
The reason why the snapshot shows only two values for EPS is because the data comes from the point in time engine, which stops if there are holes. This is desirable in backtests so that you don’t compute TTM values that mix data from disparate periods.
We have plans to improve the snapshot for people than want to research stocks with all the latest data, holes and all, so it looks more like the screenshot.
Thanks
Are the gaps going to be filled in? Both EPSExclXorTTM and SalesTTM are N/A. Also, the SalesQ value of 812.83 doesn’t look correct. I looked up the latest report and revenue for the quarter was 299mil which I think is as high as its been (CurFYSalesMean is 1168 for the year). Are there other values being included in the quarterly sales values?
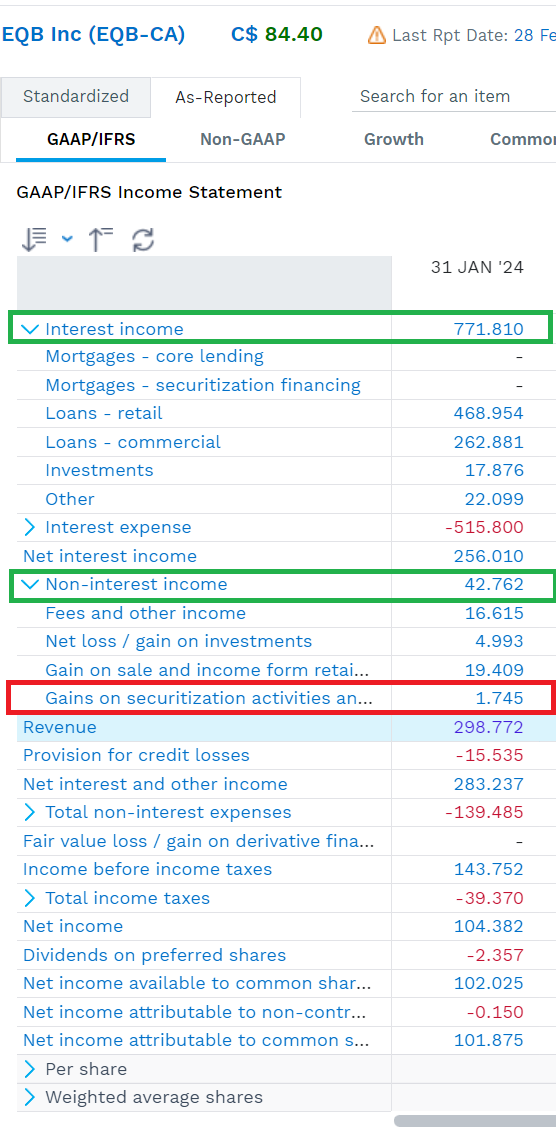
This is a bank so revenue is different. Looks like they are doing this
771.81 + 42.762 - 1.745 = 812.83
Compustat also reports SalesQ as 815. I can ask FactSet if the missing periods can be filled. But Compustat is also missing a period.
Ah ok. Got it. Thanks.
FYI, FactSet said they are still working on fixing EQB
1 Like