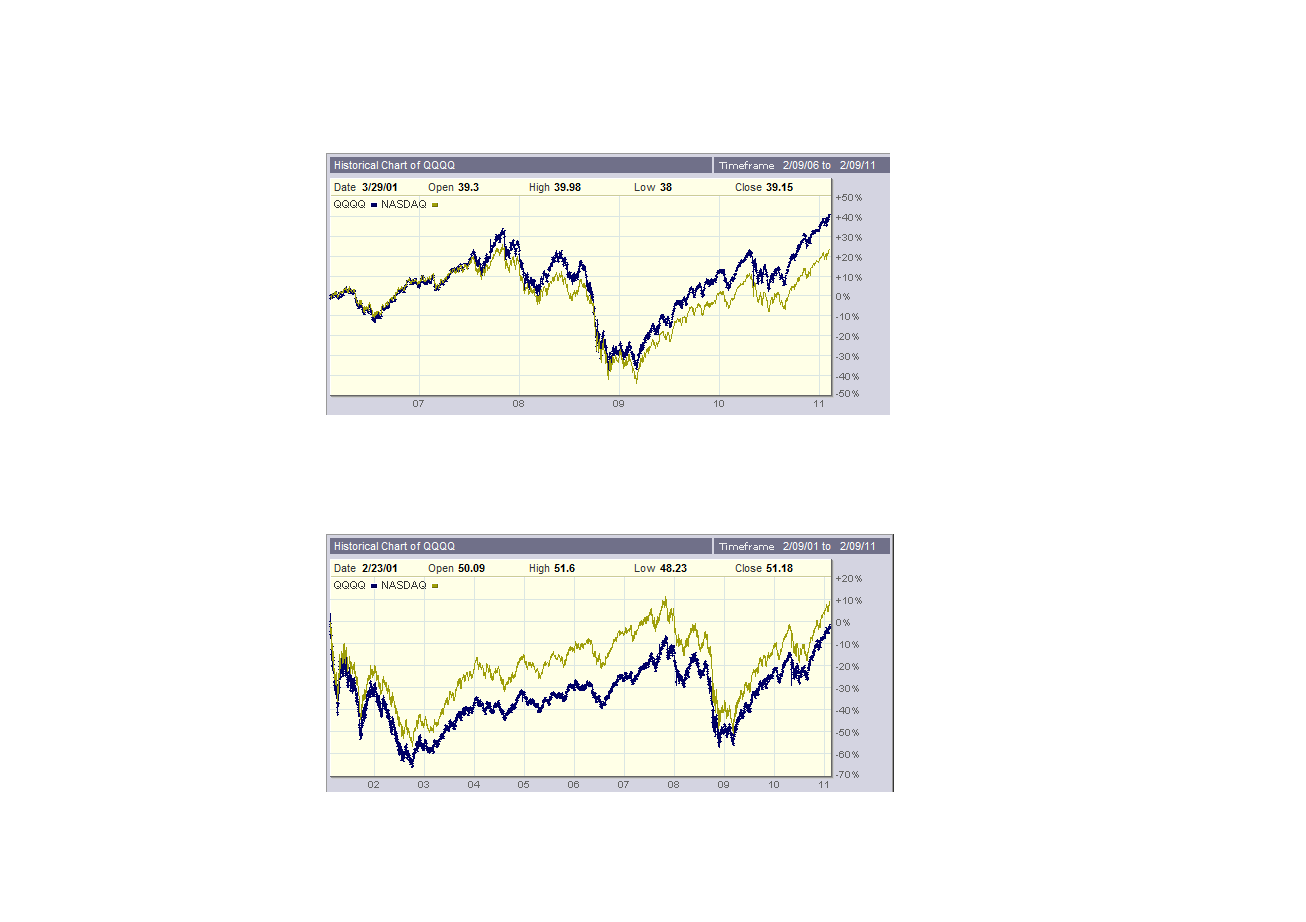
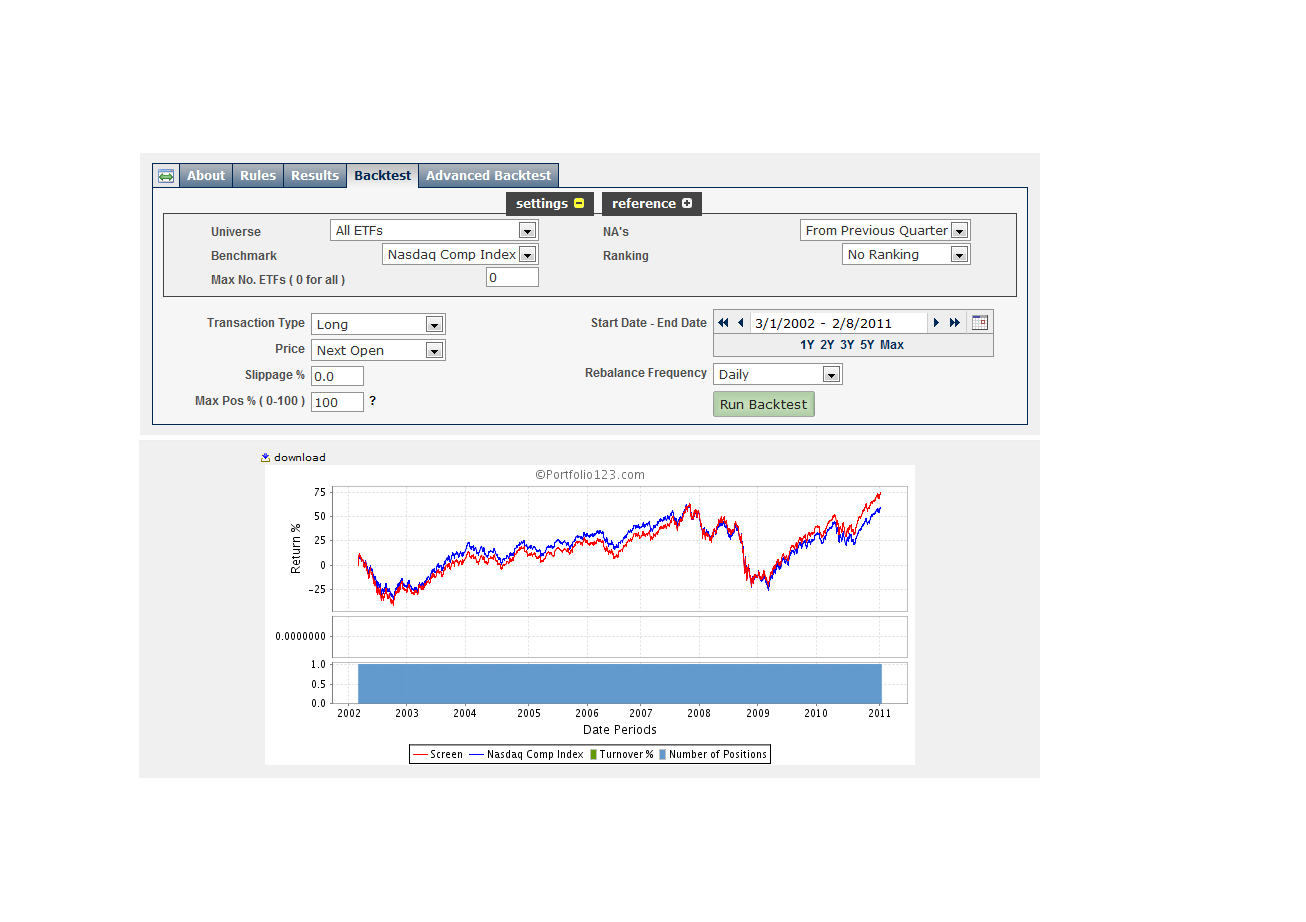
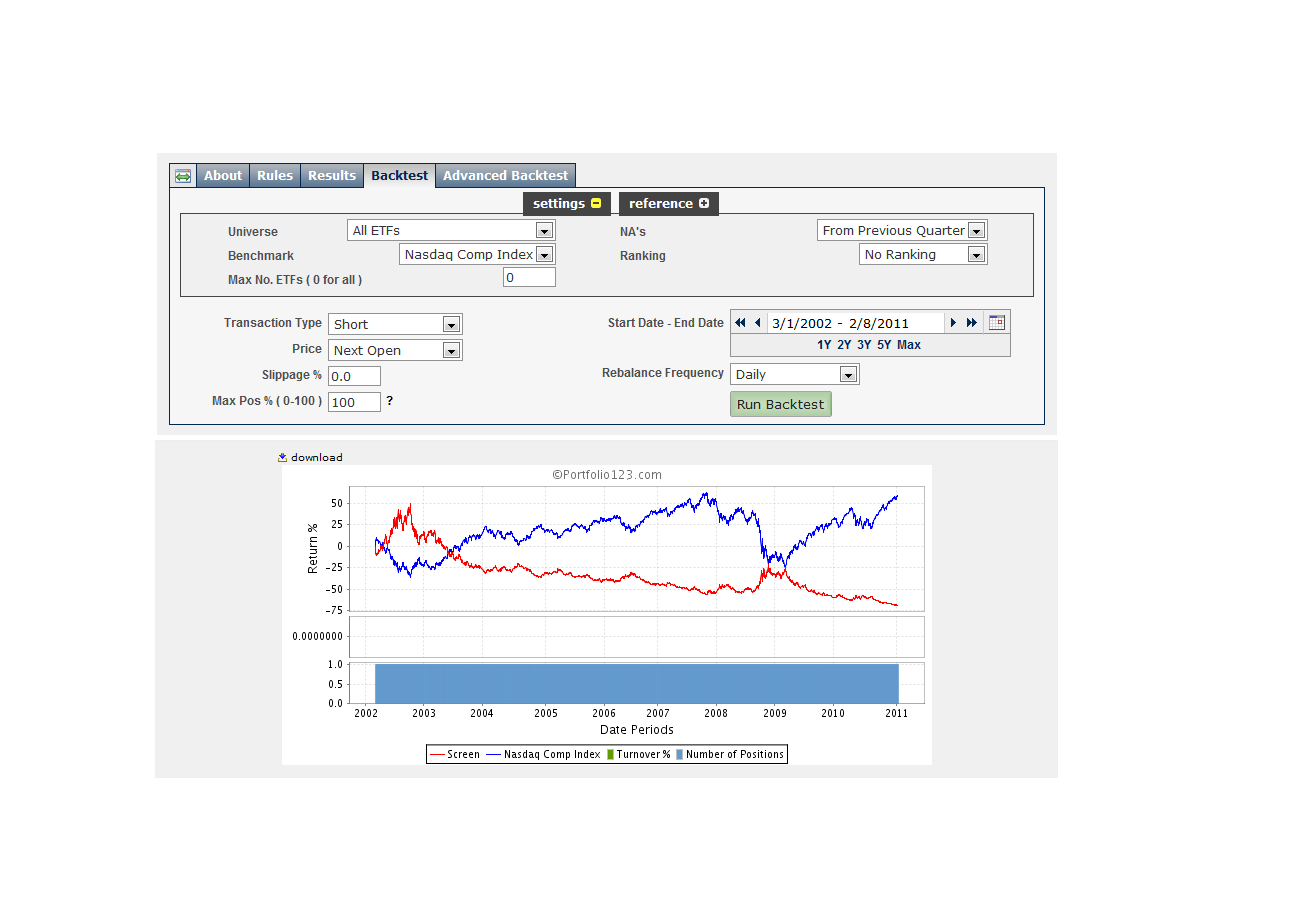
The first graphic is from Big Charts showing QQQQ compared to the NASDAQ Composite over the last five and ten years. Although they are different series they correlate well. The second graphic is from P123 of a screen with exactly one buy rule InList(“QQQQ”). [List QQQQ has one symbol QQQQ.] It too correlates very well with the NASDAQ Composite. No surprises here. Note that in 2009 the total return was briefly zero. The third graphic is the exact same screen except the entry was to the short side instead of the long side. Note that a no time in 2009 was the total return even close to zero. So what’s going on?
Hi,
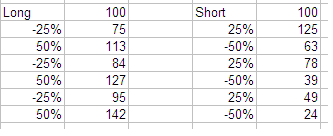
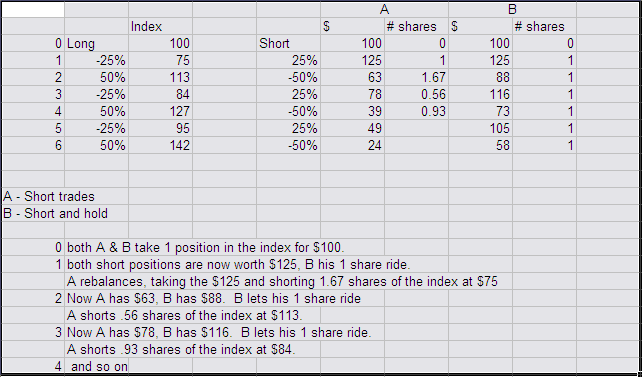
If your question is why didn’t the short screen make it back to the 0 line, the answer has to do with the mathematics of compounding, not with the charts. To illustrate what is happening with the Nasdaq, assume an imaginary index that alternates 25% losses with 50% gains. In the long run it goes up with a couple swings through the zero line, just like the Nasdaq. Now imagine you were short this index, so you alternate 25% gains with 50% losses. The cumulative returns are attached in the image below. Note the first crosses the zero line 6 times while the second crosses the zero line only twice. On the long side there was a net gain of 42%, but trading on the short side a loss of 76%. Because of the same principle, to make up a 20% loss requires a 25% return, to make up a 33% loss requires a 50% return.
For this reason it is important for anyone evaluating a short strategy using P123 to export the results to a spreadsheet and reverse the numbers. I did this anyways to see the drawdown but as you see the shape of the performance curve can look quite different when the percent change is reversed.
Marco and Don: thanks for taking this post seriously and sharing your thoughts.
BigCharts is somewhat limited in the choice of time frames. I chose the two that I thought were most telling for the task at hand. The "Date" is an artifact of where my mouse was pointing and immaterial. For me, the take-away message is that the two series have high correlation and that if the QQQQ was entered on 3/1/02 there was a point in 2009 where the total return was zero or nearly zero. This is strongly supported by the second graphic (P123 long screen).
A bit of background for newbies and others who are following this thread but not posting: It’s a well known fact that if an investment has a positive return of say, X% and then looses X% the total return will not be zero, but negative. [This is sometimes on the GRE.] For example, if an investment gains 20% and then looses 20% the net return will be -4%. [1.01.20.8 = 0.96] Indeed, an investor would need to make 25% in order to lose 20% and still be able to break even (as Don said). [1.01.250.8 = 1.0] Moreover, the order – gain first, loss second or loss first, gain second makes no difference in the outcome. That is, the outcome is path independent.
Back to the task at hand: Consider the equivalence argument. That is: Suppose I had a broker that would allow me to sell and buy on the open with no slippage or commission and he would even cover the SEC fee (Well, just suppose…). Then on the first open I could sell short Q quantity of QQQQ’s. Thereafter, each morning on the open I would cover Q quantity of the QQQQ’s and re-short them – all at the opening price. Since the friction is zero (i.e. no slippage, fee’s etc.), the net effect of this would be to hold short Q quantity of the QQQQ’s for the duration, and at the same point in 2009 where the long screen showed a break even return I too would be at break even. For this reason , I suspect the poor showing of the P123 short screen does not have to do with the mathematics of compounding but with something else.
It’s confusing every time I look at this, but I think it’s right the way it is. Take a simple example:
A) A stock goes from 10->11 and you go long with a starting capital of $10.
Therefore you buy 1 share and sell it for $11. Your account now has $11 for a total return of 10%
B) A stock goes from 11->10 and you go short with a “starting” capital of $11
Therefore you short 1 share at $11 and buy it buy it back at $10. End result is your account has an additional $1 for a total of $12. Your total return is 9.09%
I totally agree with Marco that this can be very confusing. So, for purposes of discussion let’s forget about slippage, fees, margin interest etc. Under those conditions, what absolutely has to be true is: If an investor is long a security and the security has no net change in price over the holding period then it has a zero percent return. The same is true if the investor is short the security. That is, it has a zero percent return. Moreover, this true regardless of the interim returns.
So If I see a security that is trading at its entry price I know regardless of whether I’m long or short that I have a zero percent net return on the position. The same should be true for any screen that acts as a functional equivalent.
I'm attaching a spreadsheet of Long vs Short with QQQQ prices with daily returns and graphs for three compounded returns: long, and short using 2 methods
For the short the magenta is what's currently in production. The yellow one is the one Bill is advocating.
'Last' is the latest close, 'Previous' is the close the previous bar. To get Bill's effect the denominator needs to be changed to 'Last'.
I think the denominator has to be 'Previous' bc that's what needs to be in the account for shorting.
This is confusing, but your statement is not true because your screen rebalances daily and this compounds the daily returns. The bottom line is that this is not the same as holding a short position the entire time. Take a look again at my example in my prior post. The original index goes from 100 to 142, a gain of 42%. If I was holding a short position the entire time, then this would be a loss of 42%. But my example treats these as individual trades, compounding the returns and so when shorting I end up with a loss of 76%. This is similar to what leveraged and inverse ETFs do so maybe an explanation on how these work may help, and particularly relevant since it includes an example where the index returns to the initial value:
Marco: thanks for publishing your calculations and the spreadsheet. It's now much clearer where the problem lies. Don: thanks for sharing your thoughts.
Neither the Magenta nor the Yellow short calculation is correct. [Magenta = (Previous - Last ) / Previous = - (Last- Previous) / Previous = - Blue (long)]. To see that the Magenta calculation is incorrect consider the following example: You and I both have frictionless brokerage accounts with $100 of equity each. You like stock ABCX trading at 100 and I don’t. So you buy 1 share of ABCX and I sell it to you short. After the first holding period ABCX is trading at $125. You therefore have an account value of $125 and a return for the first holding period of 25%. [100* ($125 - $100)/$100]. I, on the other hand, have an account value of $75 and a return for the first holding period of -25% [100*($75 - $100)/$100].
 After the second and final holding period  ABCX is trading at $100. Your account value is $100 and your return for the second holding period is  -20% [100* ($100 - $125)/$125].   My account value is also $100, and my return for the second holding period is approximately 33.33%  [100*($100 - $75)/$75].  This is different from -(-20%).

On the long side the total return calculation is: 1.00*1.25*0.8 = 1.00 or a zero percent total return.  For the short side the total return calculation is 1.00*0.75*1.33... = 1.00. Again, zero percent total return.

To see that the Yellow short calculation is incorrect consider:  Again, you and I have frictionless brokerage accounts with $100 of equity each and again you like stock ABCX trading at $100 and I don't. So again I sell it to you short.  At the end of the holding period ABCX is trading north of $160. This is definitely not good news for me because that means my total account value is south of $40.

Now consider the chart in the spreadsheet, if the blue (long) line is north of 160 the yellow line should be roughly where  the magenta line is, that is south of 40.
One way to do the calculations correctly is to do them the same way my imaginary frictionless broker would: Start with a notional equity (preferably user defined) and keep track of the ensuing equity (not return) bar by bar as the screen simulates the buying and selling. Once you have the simulated equity curve it’s an easy matter to divide it by the starting equity and multiply by 100.
Don, you’ve done a lot of great work on P123. I have to respectfully disagree with you. You wrote: " The bottom line is that this is not the same as holding a short position the entire time." One of the reasons for creating this screen is precisely because it does simulate holding a short position for the entire time. To understand this forget about return calculations for a moment and look at the transactions involved: After the initial short, every opening I’m covering and then re-shorting the same amount all at the opening price in a frictionless environment. How is this different from remaining short? Where exactly is difference from a transaction oriented dollar and cents point of view?
Well I could be wrong, it’s certainly happened many times before. I maintain that the difference is in the rebalancing, and I include an example below that shows by rebalancing the number of shares is changed dramatically from the short and hold which has a constant number of shares throughout. This accounts for the different results.
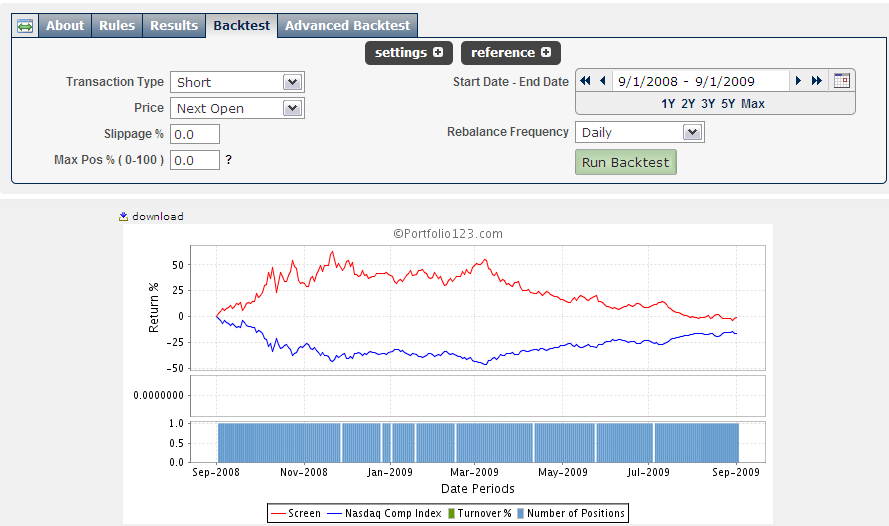
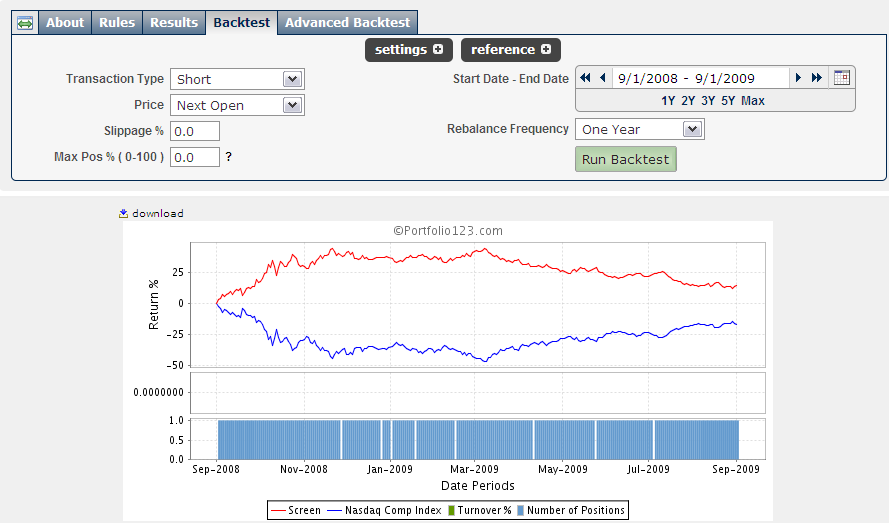
Your screen rebalances like A, and so the position size is constantly varying, unlike holding a short position. P123 does the same thing. Taking a volatile period so the difference is easy to see, I ran a short screen for QQQQ using daily rebalancing vs. a 1 year hold time. The difference is apparent, and the only difference is that one screen rebalances and one does not.
Remember, when the screener rebalances it always rebalances on the rebalance period. To simulate you holding a short position, you need to run a Sim and use the sell rules or hedge rules to determine when a rebalance will be effective. That way you can set the Sim to rebalance daily but no actual rebalance will be performed unless one of the sell or hedge rules are met. You can’t do that with the screener. It performs an actual rebalance at every rebalance period.