Use this as your buy rule:
eval(close(0)/close(60) > close(0,#bench)/close(60,#bench),ticker(“IWM,MDY,QQQ,SPY”),ticker(“SHY”))
And “true” as your sell rule
Allow immediate buybacks and your ranking system should be 13 week price % change
Use this as your buy rule:
eval(close(0)/close(60) > close(0,#bench)/close(60,#bench),ticker(“IWM,MDY,QQQ,SPY”),ticker(“SHY”))
And “true” as your sell rule
Allow immediate buybacks and your ranking system should be 13 week price % change
HI PortfolioPerfection
thank you for your comments.
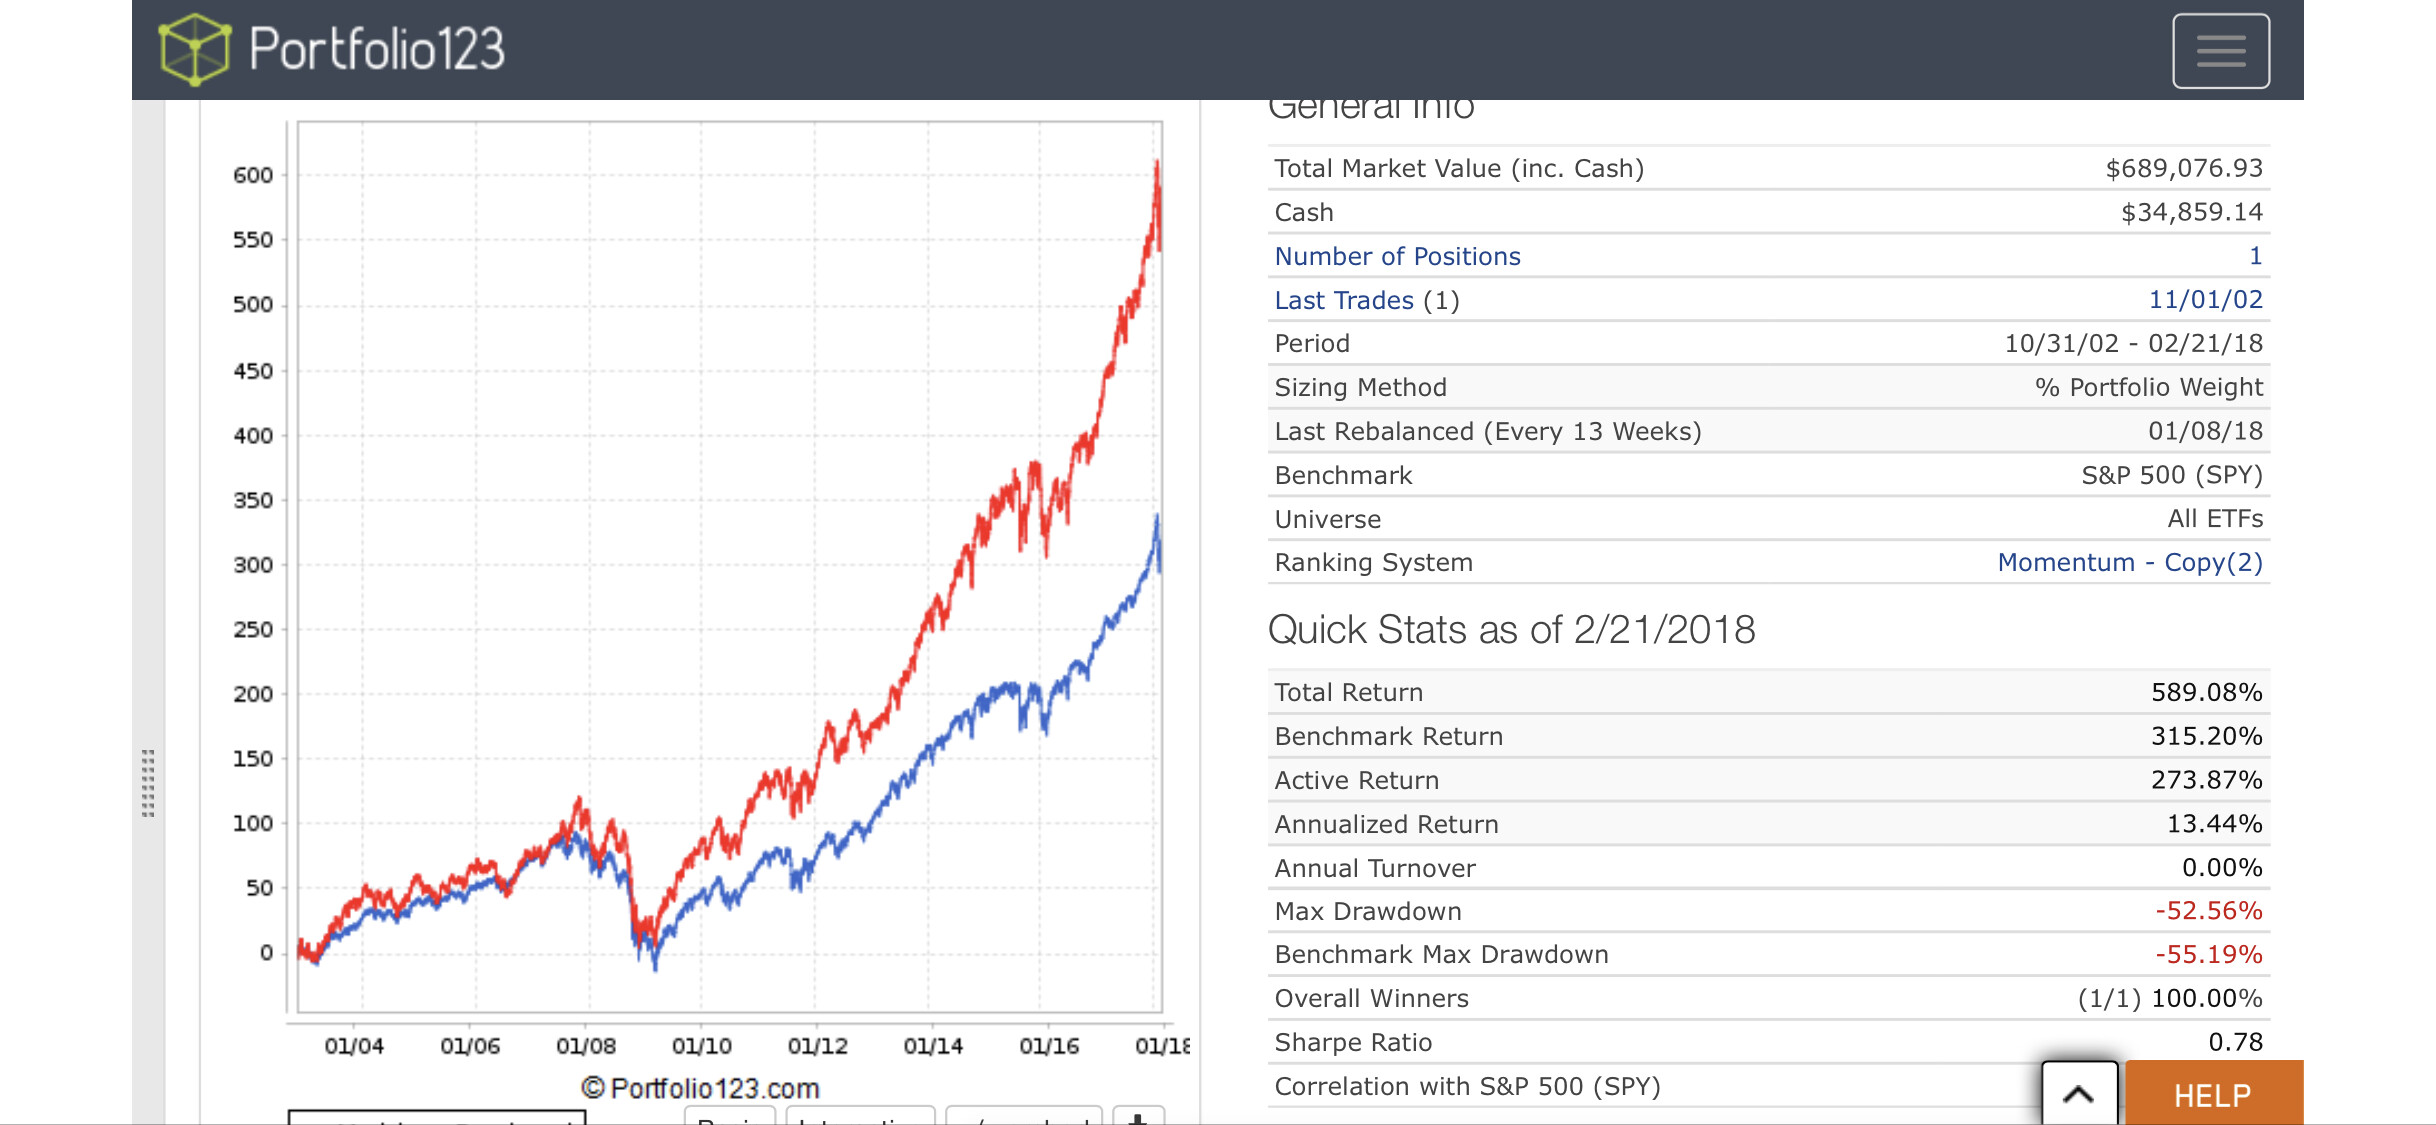
May I know what ‘true’ in the sell rule means? I did make changes as you suggested. the results are here: total returns: 96.76% with a max drawdown of -49% over the period from 31 Oct 2002 to 16 Feb 2018.
https://www.portfolio123.com/port_summary.jsp?portid=1521468
However, according to ETFreplay, the attached are the results: the CAGR is 14.1% with the max drawdown as -18%. I assume no slippage or commissions in Portfolio123 so they re not the reasons.
I attached the screenshot below:
What may be the reason for such a wide difference?
ETFReplay.pdf (234 KB)
I’m joining this discussion because our separate discussion by email seems like duplicated effort.
True as a sell rule means sell/reevaluate at each rebalance. If that’s what you want, then it suggests that you might be better served with a screen (unless you need the transaction record for some reason, like trading with IB).
I would use this as a buy rule:
(Close(0)/Close(63))-1>=(Close(0,GetSeries("SHY"))/Close(63,GetSeries("SHY")))-1Replace the 63s with however many trading days you’d like. The trick is that SHY will only ever be the top result in your ranking system when there’s nothing else to be bought. RankPos=1 isn’t actually doing anything in portfolio/simulation as long as you’ve set the position size to 100%. (It sounds like you’d like allow immediate buyback set to yes too, but that hammers results in my test.)
I would use
(Close(0)/Close(63))-1as the node in your ranking system. This is for two reasons: First, it makes the rule above work; there’s no guarantee that Price13W%Chg will give the same result as that formula due to rounding on the back end (as I recall, it’s dividing 251 by 4 to come up with a single quarter, and is only doing so once a week).
In fact, I can guarantee that Pr13W%Chg is going to give a different result than Close(0)/Close(63)-1, because the close formula is taking dividends into account and Pr13W%Chg is only comparing price changes.
If you want dividends to be included, then you should use TotalReturn13W, or change your ranking node to the basic formula. If you don’t want dividends to be included, then use CloseExDiv instead of Close in the basic formula.
Again, I would suggest using Close(0)/Close(63)-1 consistently everywhere.
And the more that I’ve looked at this problem, the less that I think that you’re going to get us to match ETFReplay. I’m not getting anything even remotely as high as they’re reporting.
I have no idea why, but the difference that you’re reporting in drawdowns is probably the key: If they’re reporting an 18% drawdown and we’re reporting a 45% drawdown then we’ve selected different ETFs in 2008/2009.
Whether ETFs pays dividend, whether it is accounted for in P123.
Thanks
Kumar
ETF dividends are paid into the cash account in portfolios and simulations. We adjust the prices for future dividends in screener backtests to ensure total return outputs in that tool.
thank you for your reply.
I did notice that ‘allow immediate buyback’ seriously affects the results negatively.
Do you have any insight as to why “allow immediate buyback” can affect results so much?
the below is the new portfolio.
https://www.portfolio123.com/port_summary.jsp?portid=1521468
In the ETFReplay , the CAGR is 14.1% with -18.4% drawndown (vs 9.8% with -55.2% drawdown of SP500). It outpersorms the SP500 by a large margin. Please see the screenshot in the previous reply.
However in POrtfolio 123, the CAGR is 9.26%, with max drawdown of -26.53%. It underperforms SP500. the annual difference of over 4% between ETFReplay and Portfolio123 is huge.
In the ETFReplay, it picks the best of the four (SPY, QQQ,MDY,IWM) based on the past 3 month returns. If the best is still worse than that of SHY, SHY will be selected instead.
Really wonder which model is doing the right calculation? or maybe I am still not replicating the ETFReplay correctly?
Many thanks for all the support.
B
brwg,
Please, post the transactions for last 5 years, for both ETFReplay and Portfolio 123.
We will compare transaction by transaction manually and figure out where it deviates.
ETFReplay and Portfolio123 are tools, small difference in buy or sell rules make a big difference over period of time.
Thanks
Kumar
thanks for your feedback. Kumar.
I just downloaded the transactions to the attached excel sheet. Yes, I found the major difference is the rebalance timing.
In ETFRepay, rebalance is set at the end of each months to be invested on the 1st business day of the calendar month.
However, in Portfolio123, rebalance frequency is every 4 weeks. Therefore, the rebalance timing is quite different, resulting in buying different ETFs. I think this is the major reason. However, as the difference in returns is quite large, I can’t help wondering whether rebalancing at the end of each calendar month is better than '4 weeks" used in the Portfolio123.
Does anyone know whether Portfolio123 can allow such adjustments for rebalance period?
I am trying to determine:
Also, When I set Sell Rule as “True”, what does that mean? Does that mean, stocks will be all sold first before the Buy Rule is applied? If I don’t have “True” in the Sell rule, it seems no stock will be sold at all over the testing period.
Also, why “allow immediate buyback” will affect negatively the results?
Many thanks for your support.
ETFReplay vs Portfolio 123.xls (74.5 KB)
Nice to know, you have nail down the difference.
P123 mostly for fundamental data,
13 weeks quarterly FA report and 52 weeks annual FA report
and weekly rebalance and Monday only trading’s are
one kind of FA strategy relies on earning and weekly fundamentals.
ETFs don’t have any fundamental, it has price and volume, it is more towards technical. TA.
I have followed some TA experts, they have assumed end of the month,mutual funds Money will sell some ETFs for profit and switch another on by first week of every month.
3.In buy rule if you keep
(LastSellDays > 30)
it won’t buy the same ETF just sold for 1 month (30 days) time.
Please, let us know the outcome with transaction history.
Thanks
Kumar ![]()
Kumar
thanks for the reply. I am sorry I am still new to P123.
did you mean “NoBars >=1 and NoBars<=7” in the sell rule?
or “NoDays >=1 and NoDays<=7”?
I tried both and changed the rebalance to weekly. However, I see the trades are done weekly. The rebalance timing is not closer to 1st day of each month and the results not changed much.
Maybe I have misunderstood you?
thanks
sorry, I will try again. I seem to have misunderstood you. Let me try again.
As i am in office, my recent reply was from mobile with typo error and less info, then later i have added more details with exact rules.
I am good with p123 commands. I am curious to know P123 can replicate the performance of ETFReplay.
Thanks
Kumar ![]()
Kumar
Interestingly, If I set the sell rule as:
(1)
MonthDay>=28
MonthDay<=5
the results are significantly improved, with the returns being 316.5% and drawdown dropping to only -19%. .
(2)
If I use the sell rule as
Month Day>1 and MonthDay<7, the returns dropped to 45.38% and drawdown -26.42% (yes, not sure why the returns dropped that much).
(LastSellDays > 30) also makes a huge difference.
If I remove this rule from (2), the returns goes back to 278.39% and drawdowns dropped to -28.96%.
In contrast, if I remove this rule (LastSellDays > 30) from case 1, the returns jumped to 360.8% but drawdown decreased to -37%.
I wonder what made you come up with this (LastSellDays > 30) in the first place? If we are to choose the best performer over the 3 months, why do we exclude it even if it has been bought within the last 30days?
thanks
MonthDay comparison.xltx (108 KB)
You don’t want buy back immediately. So the buy rule will avoid buying.
Keep it as daily rebalance and try in sell rule 28th of every month to sell.
Compare the result transaction by transaction and share the difference to help further. You can take break and continue your research by tomorrow if you prefer.
I have time over the week ends to explore your idea in P123.
Thanks
Kumar ![]()
Paul,
In my 401k account, I have fidelity mutual funds; the quarterly dividends are automatically re-invested.
Why that option is missing in P123 ?
Long term investors are smart, they know market will go up more than go down, why the dividend earnings need to sit CASH instead of INVEST AUTOMATICALLY WITH ADDITIONAL NUMBER OF STOCKS,
the account can make money immediately on dividend earnings.
Especially, sector investing, and 4 market caps investing need this option to get better compounding effects.
Thanks
Kumar
Portfolio123 is about testing the rules, not accurately reflecting histories. Technically, reinvestment of dividends is going to come at an opportunity cost for our purposes.
Kumar
Just to share:
If I set the rebalance =Daily
Sell Rule as
MonthDay>=30 and NoDays>15
Buy rule as
(Close(0)/Close(63))-1>=(Close(0,GetSeries(“SHY”))/Close(63,GetSeries(“SHY”)))-1
The result is very similar to that of ETFReplay:
Cumulative returns: 524.26%
Drawdown: -17.46%
CAGR: 12.72%
While this rule will result in Feb with no transaction and occasionally some months with no transaction too (if 30th and 31st are holidays), at least I can very closely produce what can be created in ETFReplay, giving me some comfort about the accuracy of either model.
The interesting conclulsion is that rebalance timing can be important.
Rebalance on month end can have much better performance than other days.
thanks
B
The starting date looks curve fitting for me,
Please, test with 01/01/2002 start date.
I did one testing kept only QQQ etf, it returns 600%.
If market goes-up most of the ETFs goes up. Please, use price, volume, macd and OBV in P123 to get some edge rather than using only price.
We never know, you may be a great ETFs model developer if you have spend more time with p123 and replicate the professional TA insights with ETFs.
Thanks
Kumar ![]()
Never had much success with ETFReplay.
P123 is MUCH better.
This should not be surprising. The beginning and end of months are known to be statistically more significant and have seasonal importance. That’s one of the reasons I’m disappointed P123 has not improved date timing and bar counting functionality.