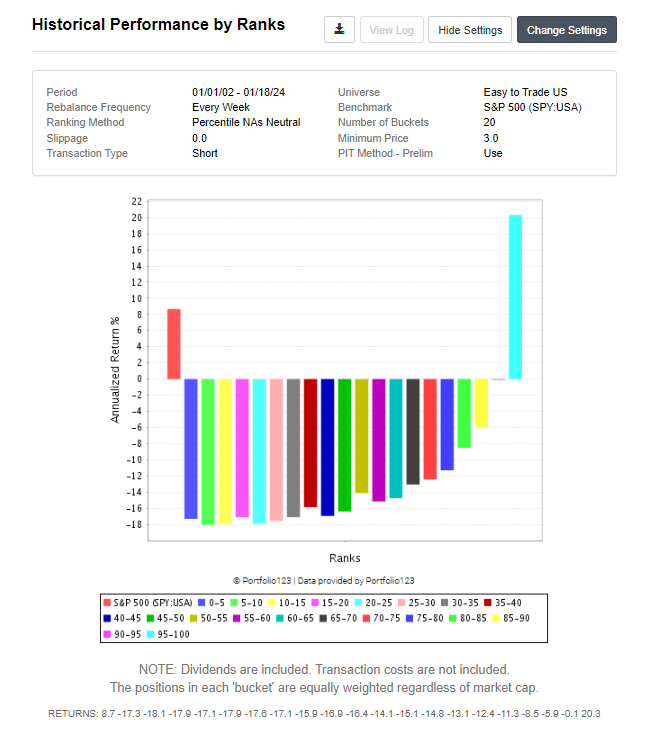
I got it to 20% using volatility lower is better, where these factors are about 3% of the total amount of factors (150) in the ranking system. My idea is that these stocks have a better chance of being ‘under the radar’.
Having said that, most of the stocks in the top ranks of the ranking system are still very volatile.
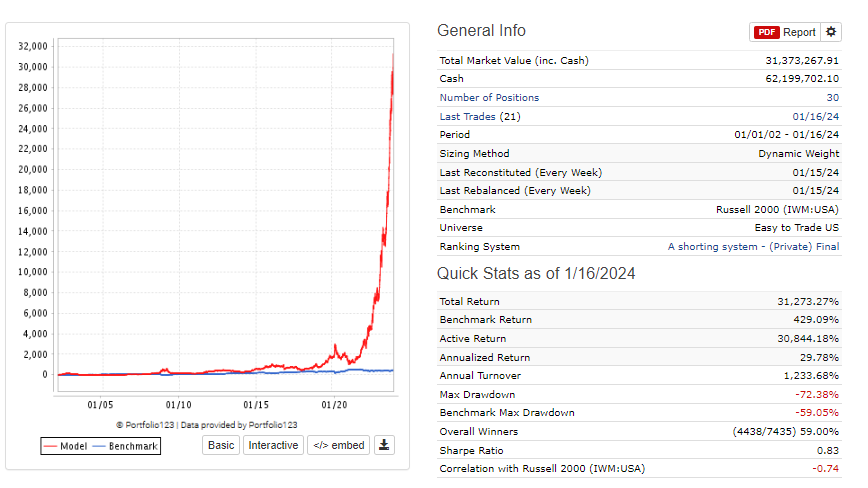
Running the RS as a shorting simulation with 30 stocks and 10% margin carry cost in the Easy to Trade US Universe, the system ends up with a 30% annualized return, which seems very attractive, especially because the returns occur in periods where markets (and my long systems) do not do so well.
I’m still hesitant to implement it in practice via a book though, as I am unsure about how to deal with short selling restrictions or the situation where lending costs in practice will be higher than 10% for some stocks, especially because I like trading via the account strategies section of portfolio123 with a link to IBKR.
That doesn’t even take into account yet that about 50 out of 10.000 transactions (1 in every 200 transactions) in the past 22 years had a return lower than -100%, the worst transaction did -600%. That would have been hard to stomach.
I could set up a seperate IBKR account specifically for trading put options by an amount equal to about 10% of the long stock portfolio. But this would mean that I would have to transfer money from one IBKR account to the other every now and then to keep the balance at 90 / 10. That seems like too much of a hastle.
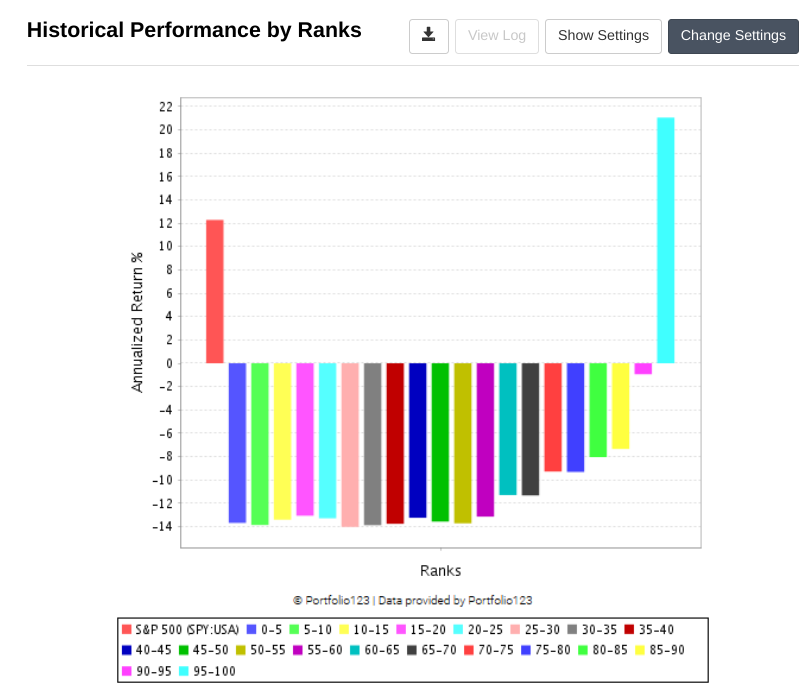
Am I reading you right that while a short or puts system usually looks for the most volatile stocks, you got the 20% short return by reversing that node? If so, that seems entirely counterintuitive. What made you think about trying it, and what’s the rationale? I can’t get anywhere near 20%, but I’m not really trying, instead trying to get negative alpha for top-ranked stocks with much longer holding periods over the last ten years (I use the rolling screen for testing rather than the rank performance) . . . But when I ran my ranking system after reversing my volatility node, my performance on this measure certainly did improve! What is going on here? If I optimize for long-term negative alpha, high volatility is my number-one node.
BTW, what does 20% in “transaction type: short” convert to if you use transaction type: long and reverse the ranking system direction? Does reversing the volatility node have the same effect if you do it that way?
I already managed to get 20% returns on Easy to Trade US (for what that’s worth) before inverting the node.
The reason for inverting the node was to see if I could make a ranking system that was less reliant on high price volatility. I don’t like reliance on any one factor. As you have written yourself (if I remember correctly), price volatility is likely a proxy for other ‘volatilities’ , so I try to look for factors that capture that volatility. Apart from that, with Black-Scholes being so main stream, I’m betting that other investors will also be comparing historical price volatility to implied volatility. Of course, price volatility is known to be pretty persistent, so if you look for highly volatile stocks, then more likely than not, they will stay highly volatile. But if we can find other factors that are predictive of riskiness, we might be able to buy put options that have low price volatility while in fact they are quite risky (and probably those put options will be relatively cheap).
Below are the results for the ranking systems, where there first row is with volatility lower is better, the second is higher is better and the last one is without the node. From that I get the impression that the short system is not so reliant anymore on this one factor (results are the same when splitting the universe in 5 subsamples).
Thanks Victor for all your help; your ideas really helped me build a short only strategy. I’m still using a bit of weight into Price Volatility but it is by far not my highest weight. I took a different approach where I just hit RS of 21. I focused on the most uncorrelated factors with uncertainty (35 total) as IMHO I’ve seen noise and curve fitting be introduced when I add correlated factors. The more noise and nodes I added were detrimental to my overall strategy. The short strategy now performs reasonably against other universes and larger number of entries. Thank you for your help!
To be honest, I do not understand the Portfolio123 methodology good enough to understand why inverting the ranking system (i.e. going from long to short and from higher is better to lower is better) does not result in inverting the results too.
I saw that @feldy had a comment on this (below). If you understand it better Feldy, could you perhaps elaborate further? Will for example focussing on improving the ‘worst’ bucket within a ‘long’ ranking system result in significantly different outcomes out of sample compared to improving the ‘best’ bucket in a ‘short’ ranking system?
Yuval, what ranking system are you testing there? Is it public? Are you trying to reconcile the per-bucket long performance vs the negated per-bucket short performance?
Victor, you’re not going to be able realistically trade that system based on that snapshot. Those very low MktCaps caught my eye, so I cross-referenced the IBKR borrow fees and shortable shares as of 01-12-2024 when you posted them.
Symbol
MktCap
BorrowFee
ShortableShares
1
ADTX
2
390.11%
15000
2
AEON
262
74.22%
10000
3
ALUR
104
13.75%
150000
4
APLD
830
1.57%
300000
5
ASTI
0
133.49%
100000
6
ATLX
290
13.87%
150000
7
BLFS
753
0.31%
800000
8
CANO
10
40.24%
20000
9
CAPR
119
0.45%
650000
10
CBUS
308
16.14%
25000
11
CING
6
732.31%
4000
12
DBGI
2
164.62%
20000
13
GMBL
0
20.53%
8000
14
HSDT
5
123.82%
25000
15
LIFW
21
187.46%
45000
16
LTRY
7
97.52%
35000
17
MTAL
556
nan%
0
18
NWTN
1968
142.94%
550000
19
OCEA
21
25.20%
30000
20
OMEX
93
4.76%
1100000
21
PAVM
27
1.70%
20000
22
SCLX
181
37.22%
300000
23
SIDU
8
953.11%
100
24
SMTI
331
0.90%
100000
25
SYTA
8
95.55%
20000
26
TMCI
801
0.46%
1800000
27
TRML
128
17.44%
150000
28
TTOO
18
83.95%
7000
29
XOMA
238
0.86%
100000
You will need something like a MktCap constraint to keep things viable even if its imperfect. You may also want to exclude ADRs like NWTN that have high market caps but may still have high borrow fees.
For me, short selling no-revenue, small, and mostly biotech stocks is a recipe for disaster when risk is off and junk is on. There may be even no liquidity in the book when you need to cover your short. I could not sleep well…
I’m using more or less the factors provided in this post, and testing short system using puts. I found that the stocks in my portfolio are super correlated with each other, either all stocks go up or go down.
However, this is probably the only way to gain positive return in long term.
In addition, I sell short-dated, ~0.2 delta ES puts. This is the region where volatility risk premia has been historically the highest.
Just a thought. I have papertraded a pairs strategy and took one Coursera course on this. So exactly no real experience with this and I know my limitations.
But you want the shorts to be correlated to the longs perhaps (and not so much to each other)?
Pairs traders use cointegration as I am sure you already know. And you probably have the expertise to develop a Python program to loop through all of the combinations of longs and shorts using the cointegration formulas. I am not sure I could do that so i will not suggest it here.
But from the Coursera course, many would use hierarchical clustering–which I know you can do with a Python library(Clustering in Sklearn)—matching stocks close to each other in the dendrogram. At least as an initial screen.
As you know the correlation distance for hierarchical clustering is simply: Correlation distance=1−r
In real-time you could draw the dendrogram and get a visual understanding of what stocks to pair with your longs.
In words, the Python algorithm would take the highest ranked stock (for the long position) and use a loop to find the stock with the largest correlation (or smallest correlation distance) in the bottom quantile of the ranking system (e.i., in lowest bucket). Loop through all of the long positions purchase at rebalance. Buy the long and short the other stock found in your loop. Sell both when your long port sells the long position.
I think I could do this in Python (and get the returns) so I know you could. And again, in real time you could do it with a dendrogram.
Just a thought for now. But something I will certainly try when I start using shorts or options. If (and only if) members found this useful thought experience, P123 could do a dendrogram: not a feature suggestion.
This is different or adds to classic pairs trading as it uses P123 to select long stocks. Pairs trading focuses more on relative price movements.So maybe call it an optimally correlated (or inversely correlated when using shorts) hedge. But not pairs trading exactly. Is there any simpler way to gat an inversely correlated hedge to reduce drawdowns?
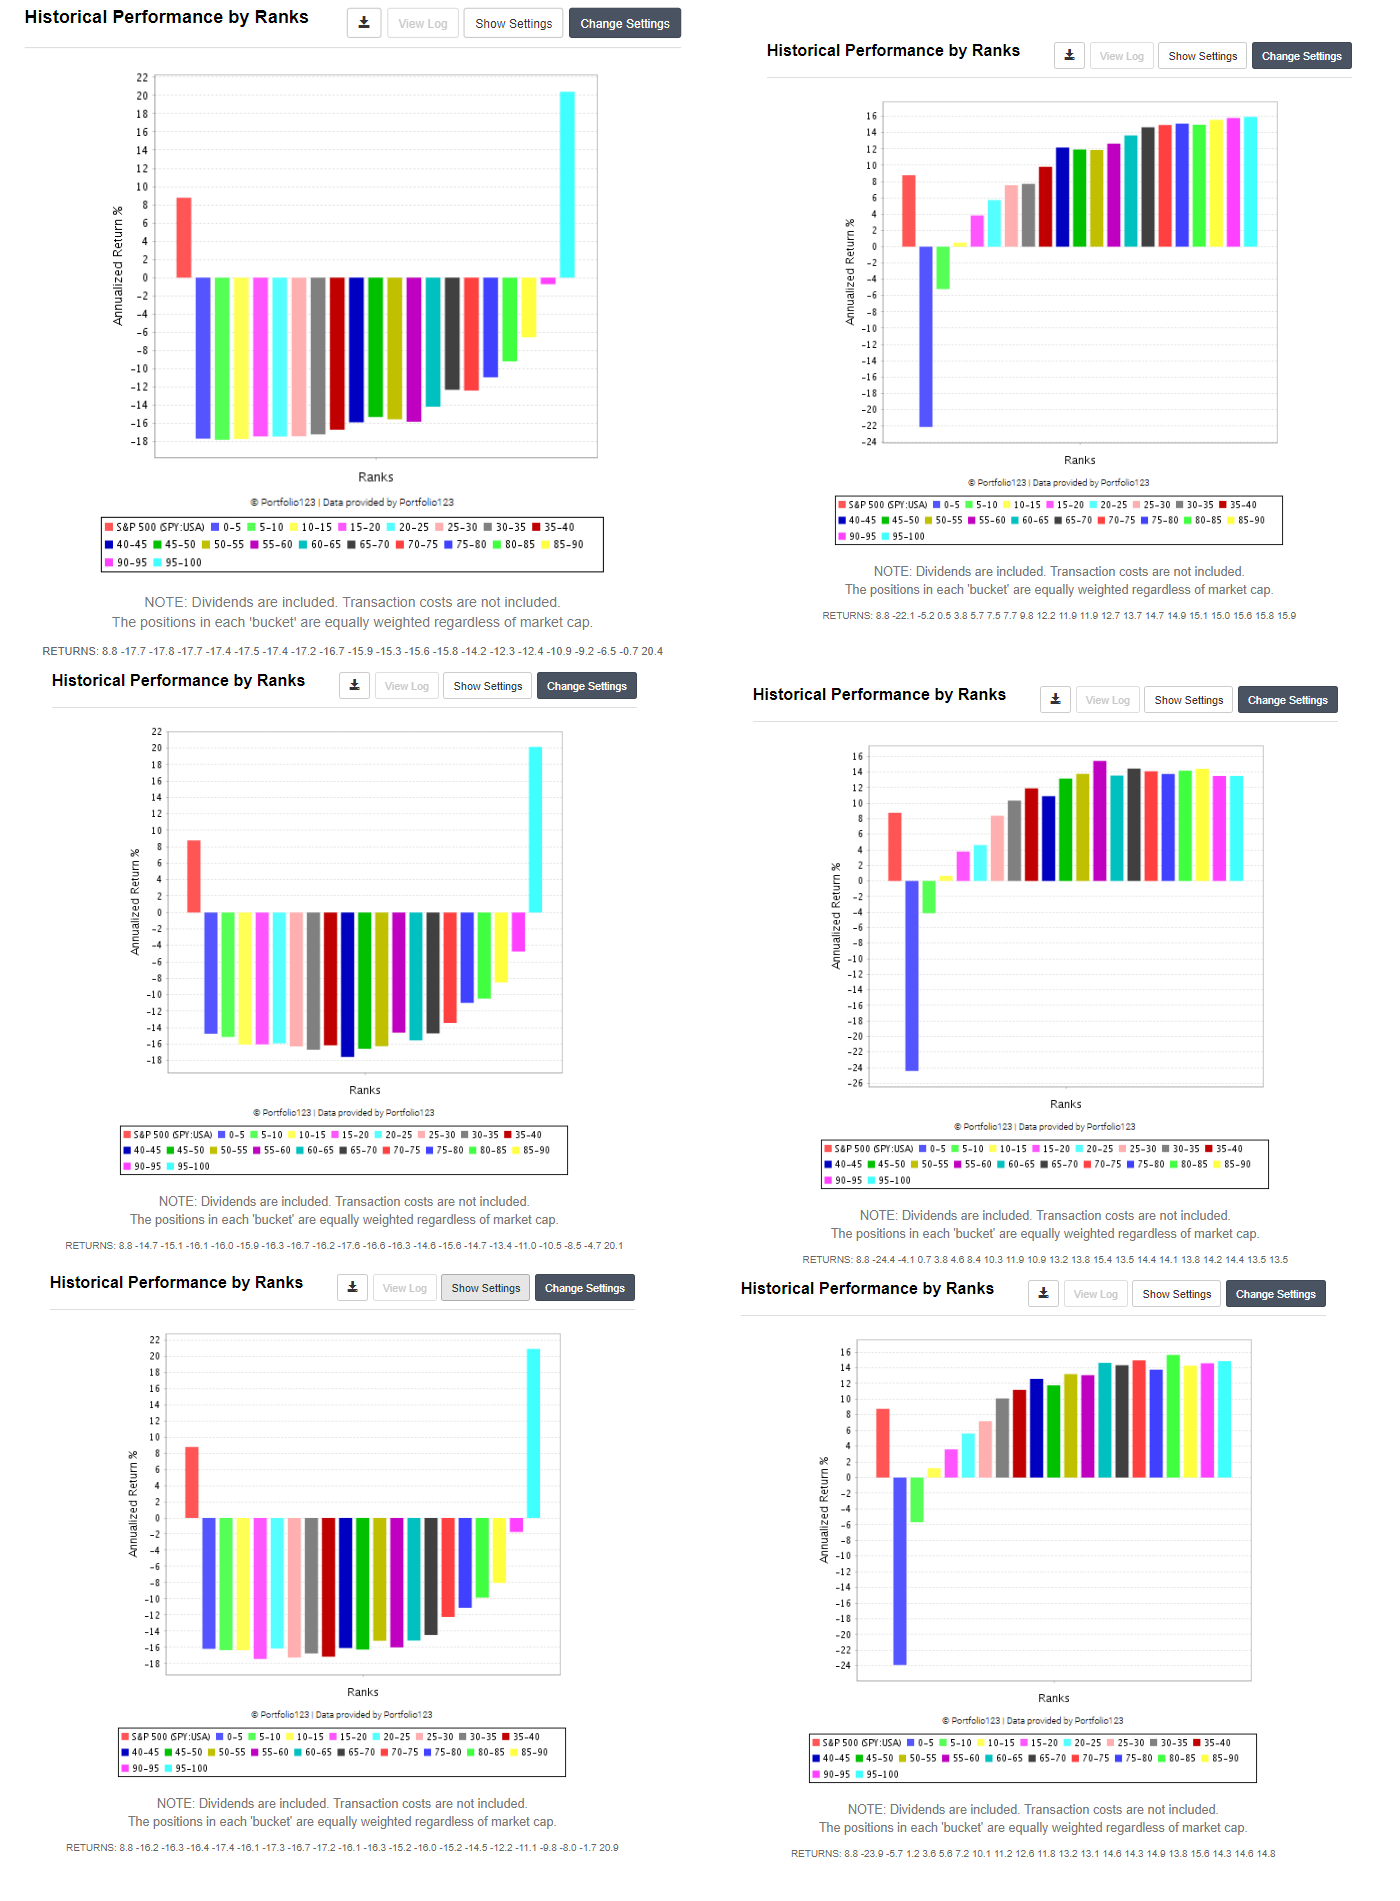
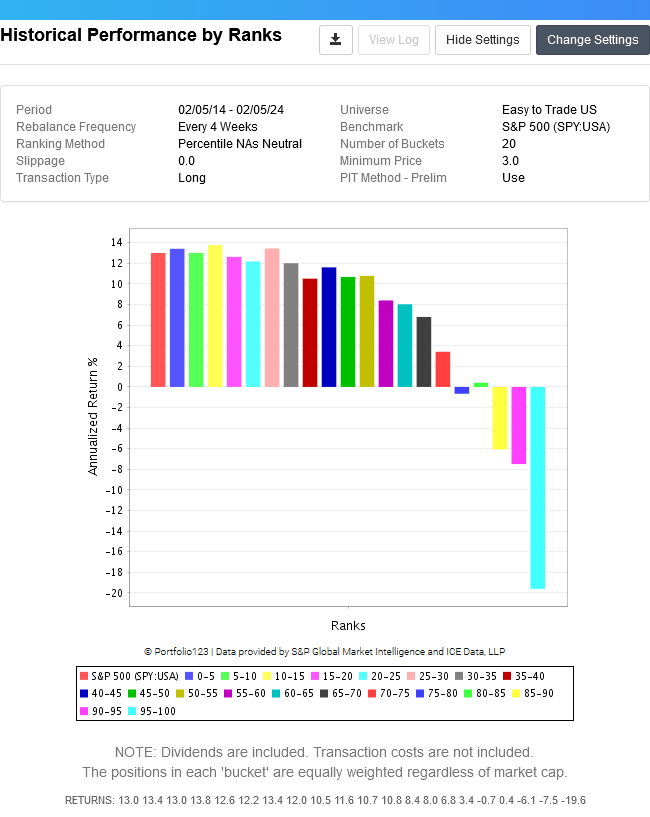
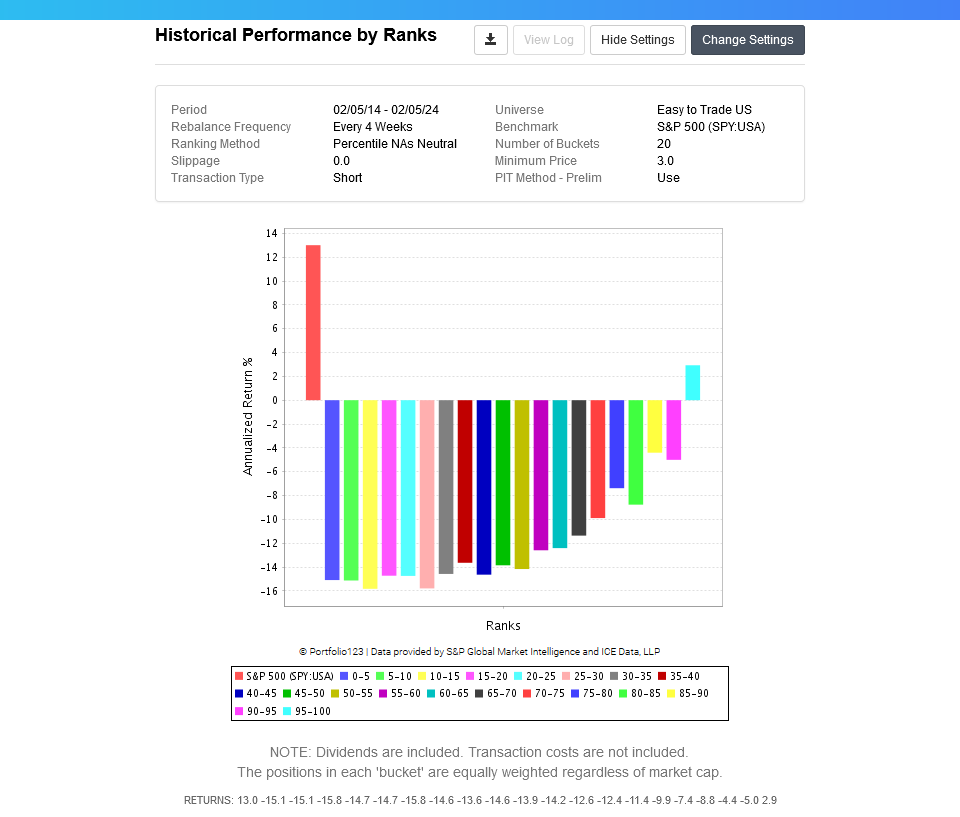
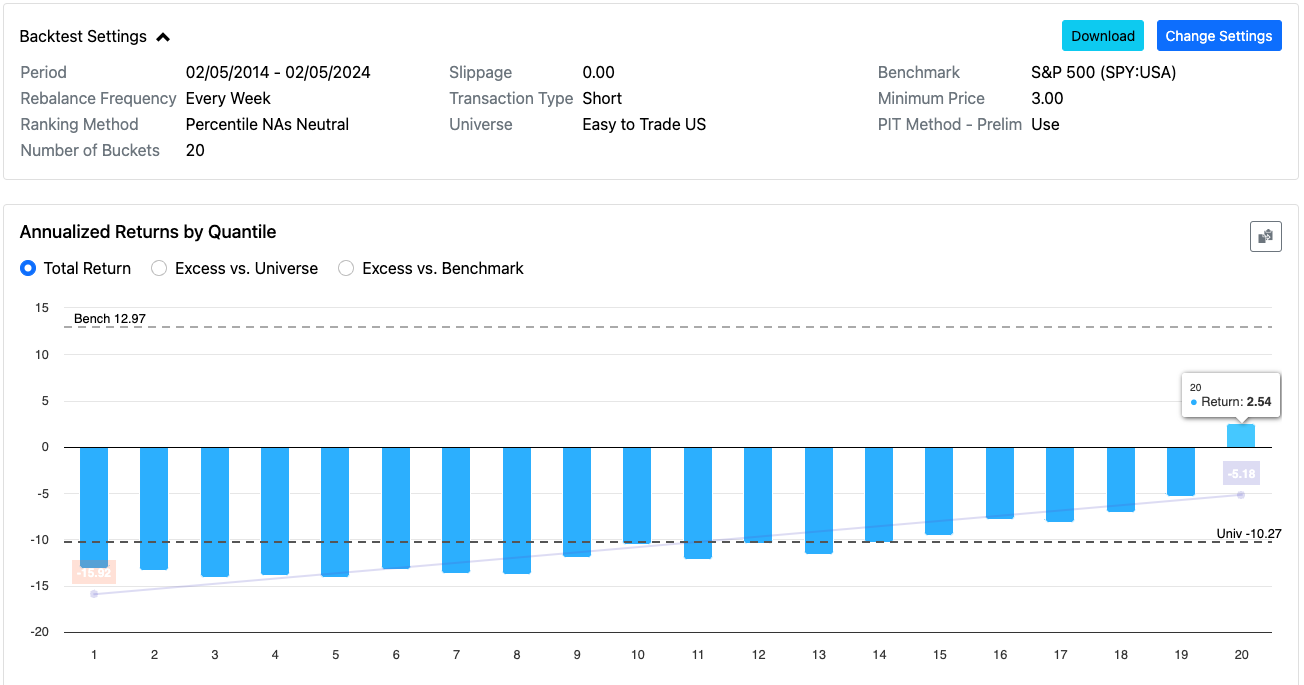
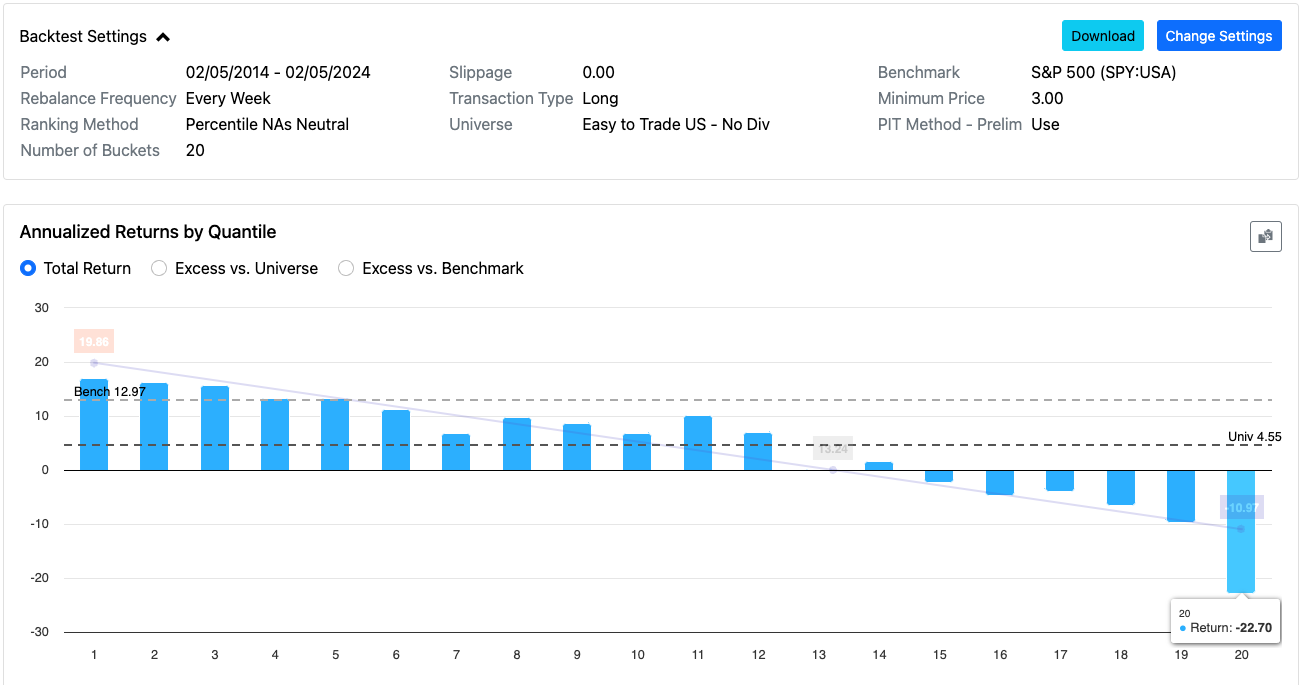
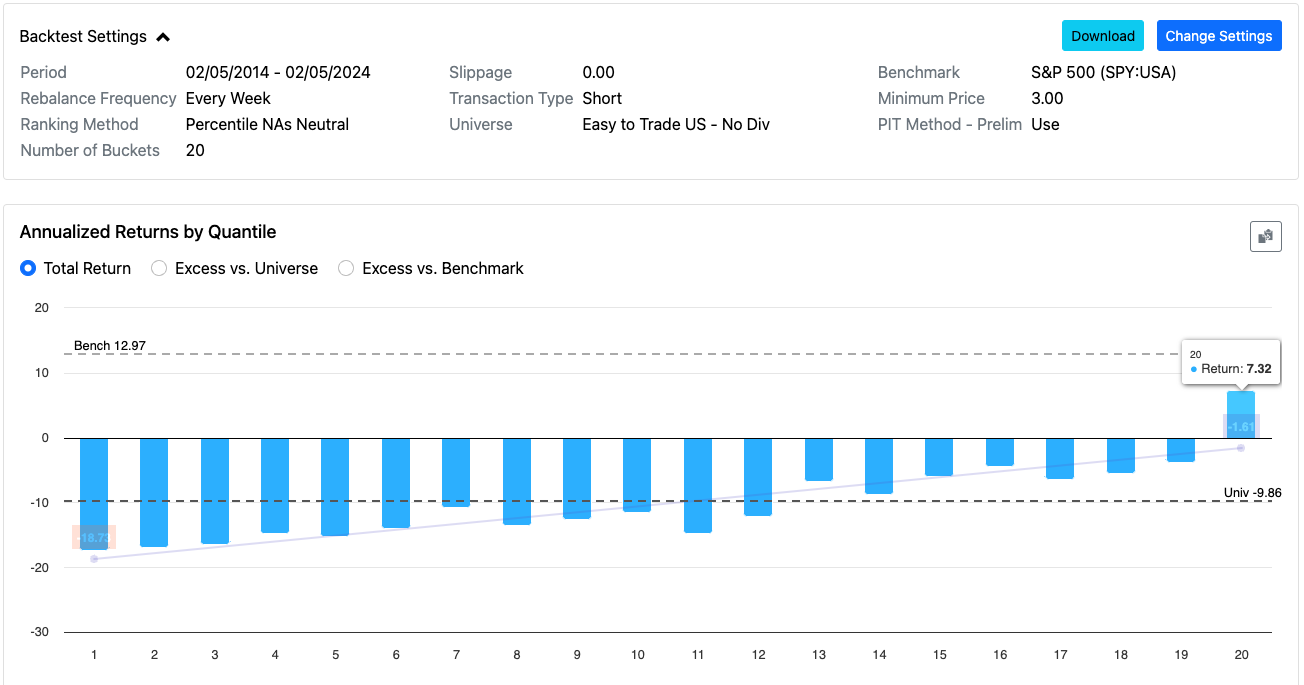
No, it’s the ranking system I use to buy put options. I’m trying to reconcile the right-most bucket of the ranking system (around -20% return) with the right-most bucket of exactly the same ranking system but using the “short” button instead of the “long” button (about 3% return). And I’m wondering how anyone can get 20% using the “short” button. At this proportion, that would mean getting -130% using the “long” button.
Even for the no dividends universe, I still see a large discrepancy between the long performance of the top bucket and the inverse of the short performance of the top bucket, so there must be some other factors at play.
@yuvaltaylor, can you check with the p123 developers to see if there’s a carry cost that’s hard-coded when you run with transaction type set to short? There’s no parameter exposed, but there must be something going on under the hood.
Aaron explained it to me. It’s the compounding effect. Two periods of a 10% gain compound to 21%. Two periods of a 10% loss compound to -19%. There’s no carry cost involved.
Hi, I have some questions,
Do you reduce short positions when it get bigger due to losses ?
I developed a good system that work well on screener and I want apply it to a (live) simulated strategy. However, I want to have my position equal weighted after each rebalancing.
I do not have access to dynamic weighting. Is there any option to have my position equal weighted w/o dynamic weighting ? or to reduce my positions that are far too big from ideal size ?
Yes, it’s possible to accomplish this with Weight or a combination of Eval and Weight. You could add a rule like “Weight > 20” to exit a position if it exceeds 20% of the portfolio value, and set “Allow Immediate Buyback” to Yes to allow the buy rules to repurchase.
An even more precise solution is to use Eval with Weight to specify how much of the position you want to sell. This usage is well documented in the factor reference for Eval:
To trim a position that gets too large in a Portfolio
SELL rules sell a position when any of the rules evaluates to TRUE, or 1. But a little known feature allows you to sell a portion of a position if a rule evaluates to a number between 0 and 1.0. For example to sell half a position if the weight exceeds 30% of the portfolio, and do nothing otherwise, enter the following SELL rule:
This may do what you want. I made a few edits from my original form, hopefully it still works as intended. Of course, replace the condition part of Eval with what you want. You’ll probably want to condition it with Weight>@ReBalTarget.
!SetVar(@ReBalTarget,10) // Ideal position weight is 10% of port value
!SetVar(@ReBal,@ReBalTarget/Weight) // Calculate portion that represents target
eval(Weight>@ReBalTarget*1.50,1-@ReBal,0) // trigger sell when position is 150% over @ReBalTarget
Thank you @WalterW and @feldy. It was really helpful.
These are my sell rules:
Rank < 90
Eval(Weight>10, 0.5, 0)
Eval(Weight<1, 1, 0) - this allows to cover short when position is very small (~ +90% positive return)
I have the some conclusions from research:
My ranking has < 10 factors, all fundamental (without: price volatility, mktcap, liquidity based factors).
My system works very well when I allow to sell small stocks within Easy To Trade and Russel 2000/3000 universe, (20 stocks, 10yr period, variable slippage). It is comfortably above 20-40% p.a. but when I switch universe to sp1500 then the return drops to negative returns at -10%.
One explanation is that, I used universe with small stocks for ML training. Possibly other factors will work better for sp1500 universe. In general this drop in returns should be expected but not by so high margin.
Looking forward, I would be happy to get 5-10% p.a. in sp1500 universe without allocating to much to Biotech stocks. Of course I will be buying options rather than selling stocks so the backtest has limited value.