Expectations when going short / buying puts

Greetings all,

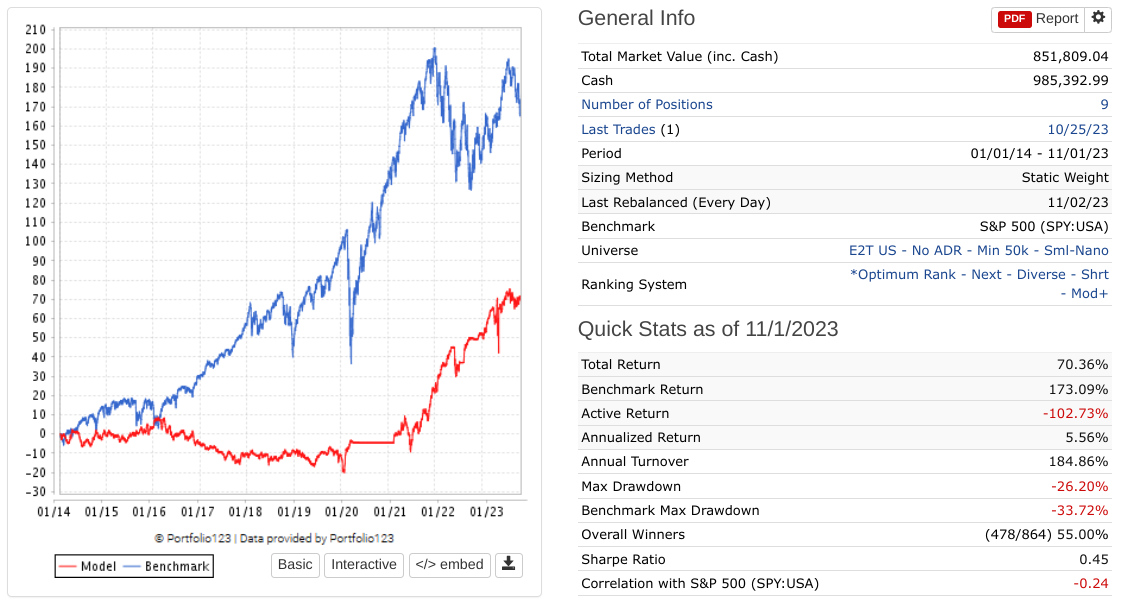
Most topics on the forum involve systems for going long. Hence, it is pretty easy to get a good idea of what returns to expect when building a ranking system or a simulation for these type of strategies.

But when it comes to to the opposite side of the spectrum, I have a harder time finding relevant information on what a realistic result would be.

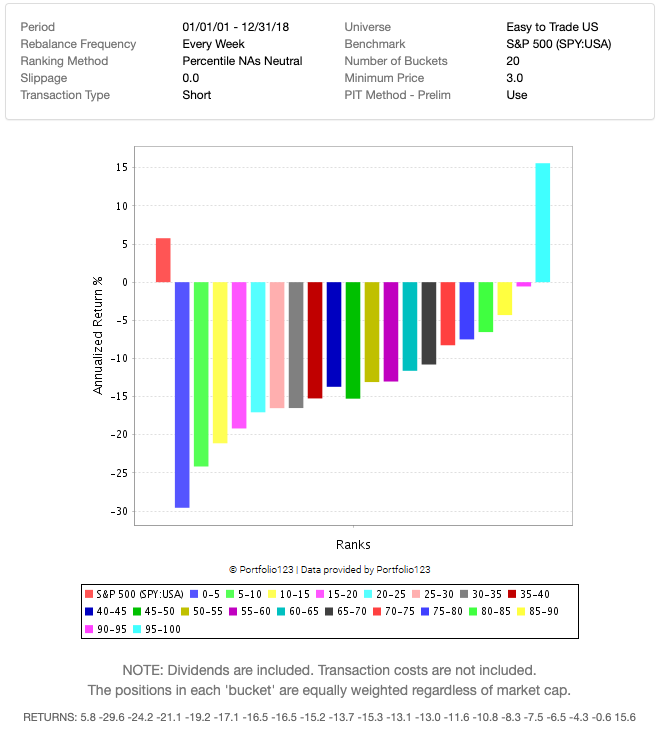
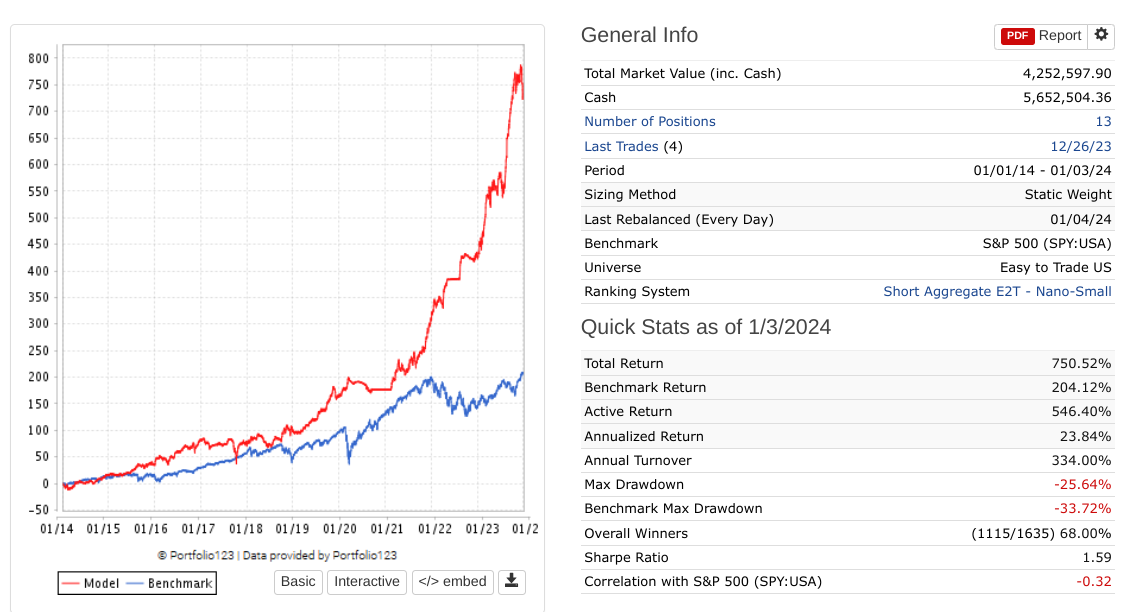
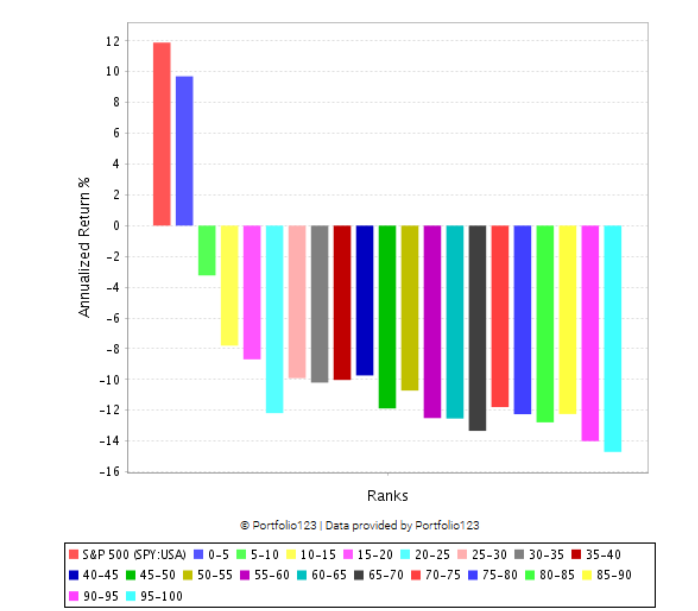
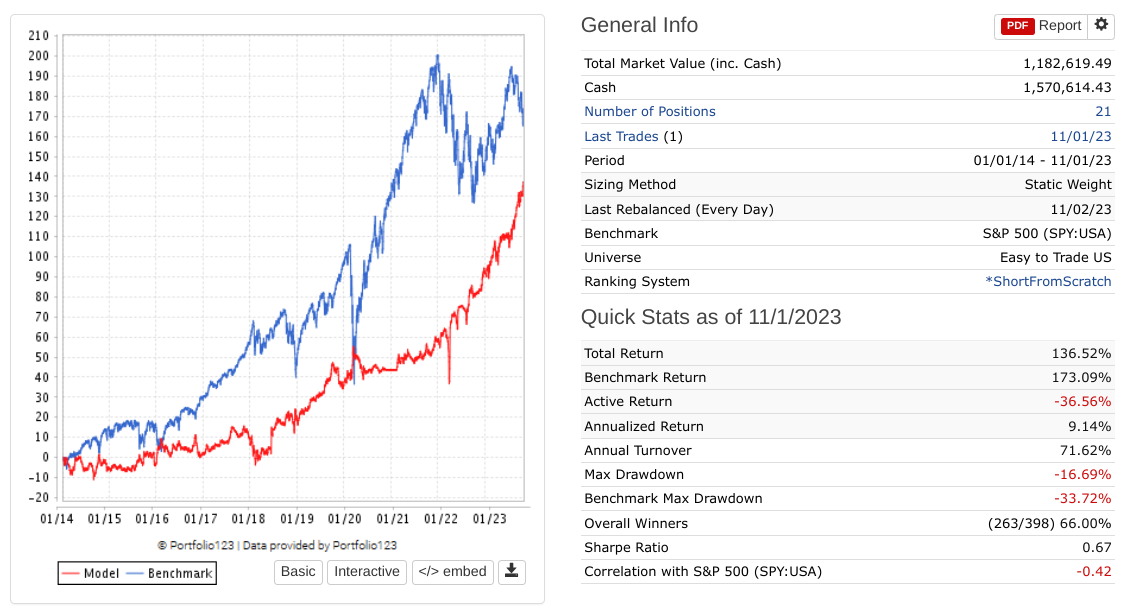
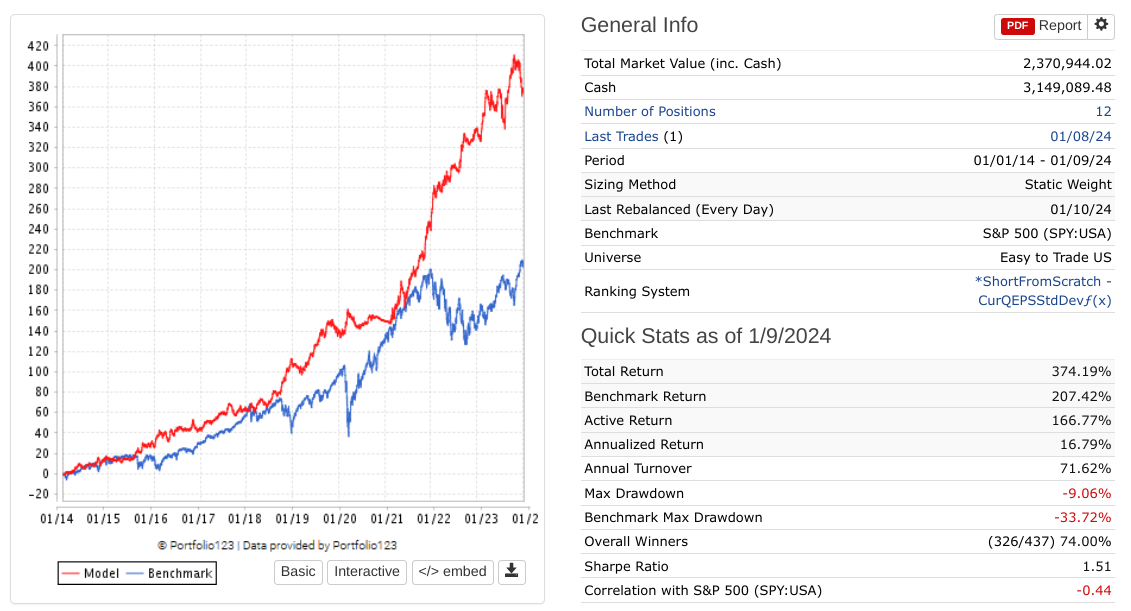
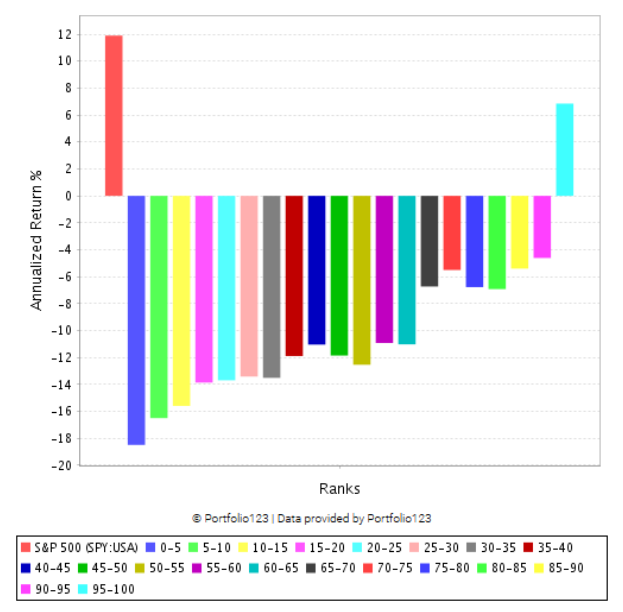
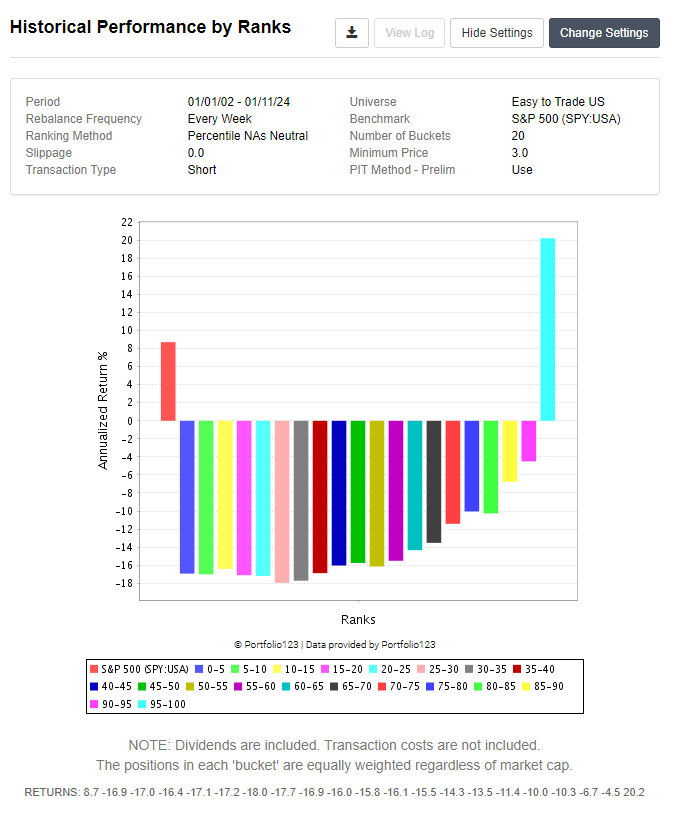
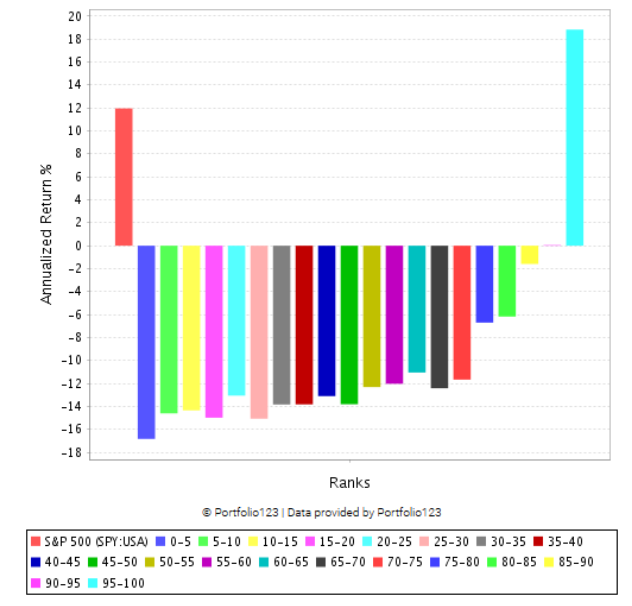
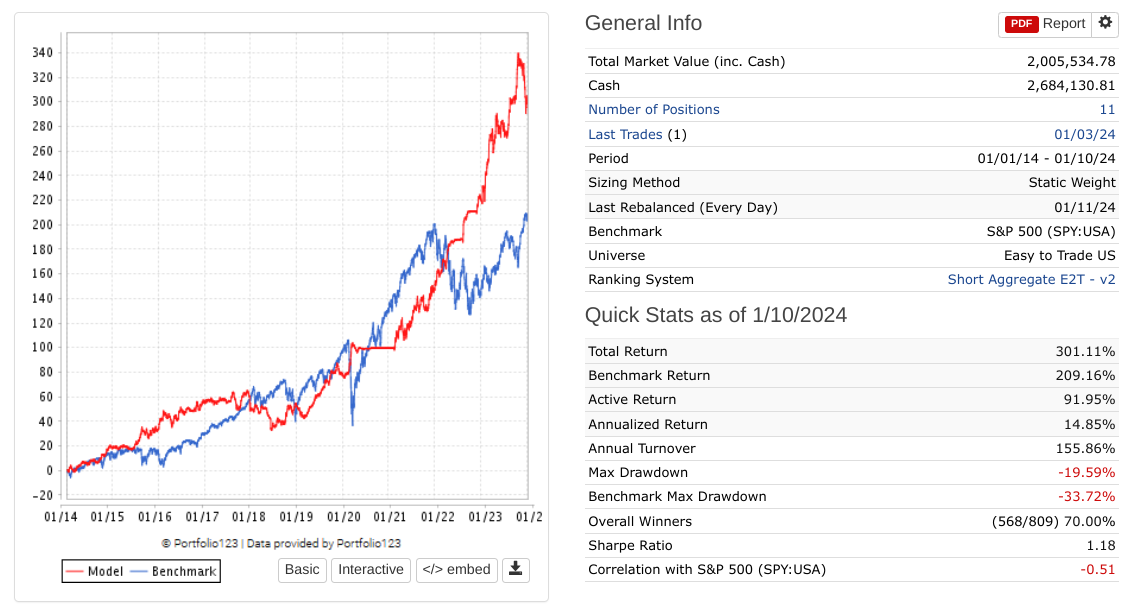
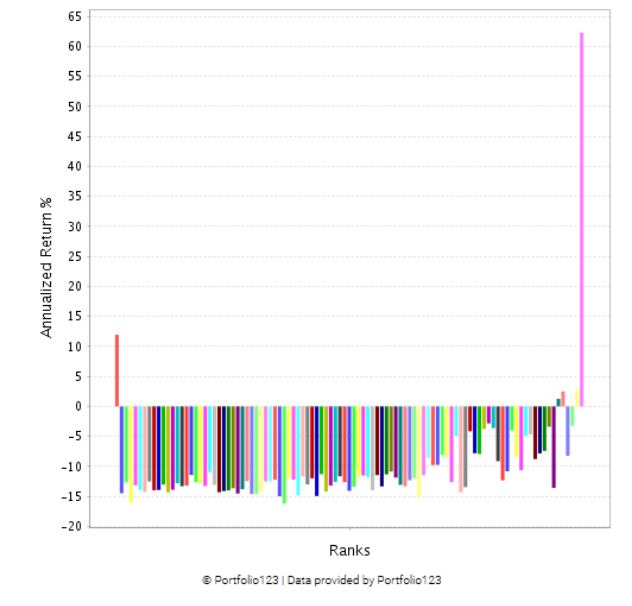
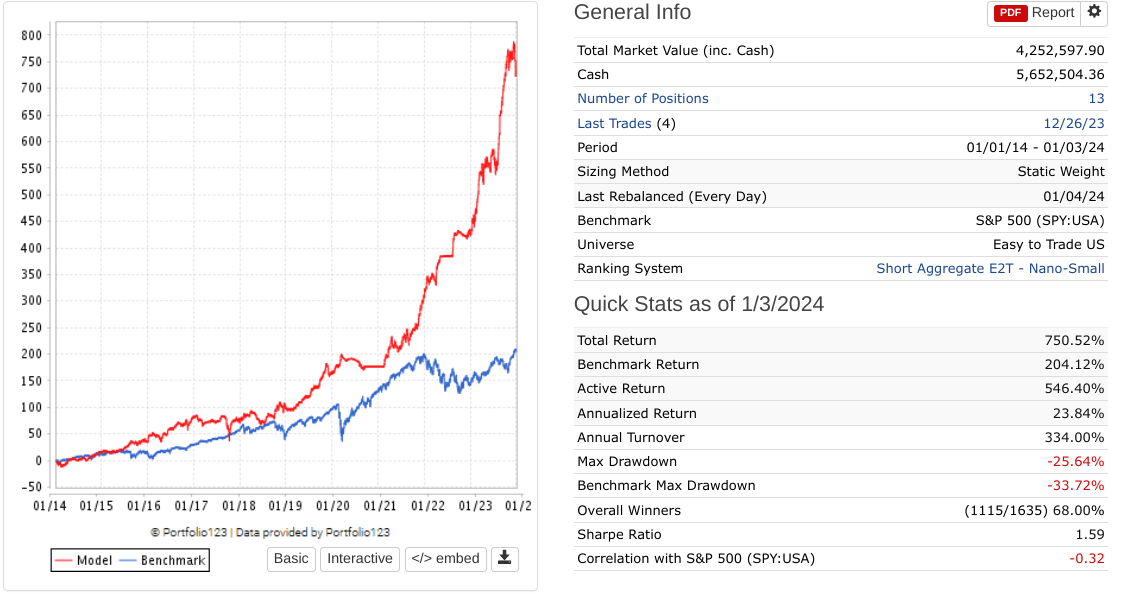
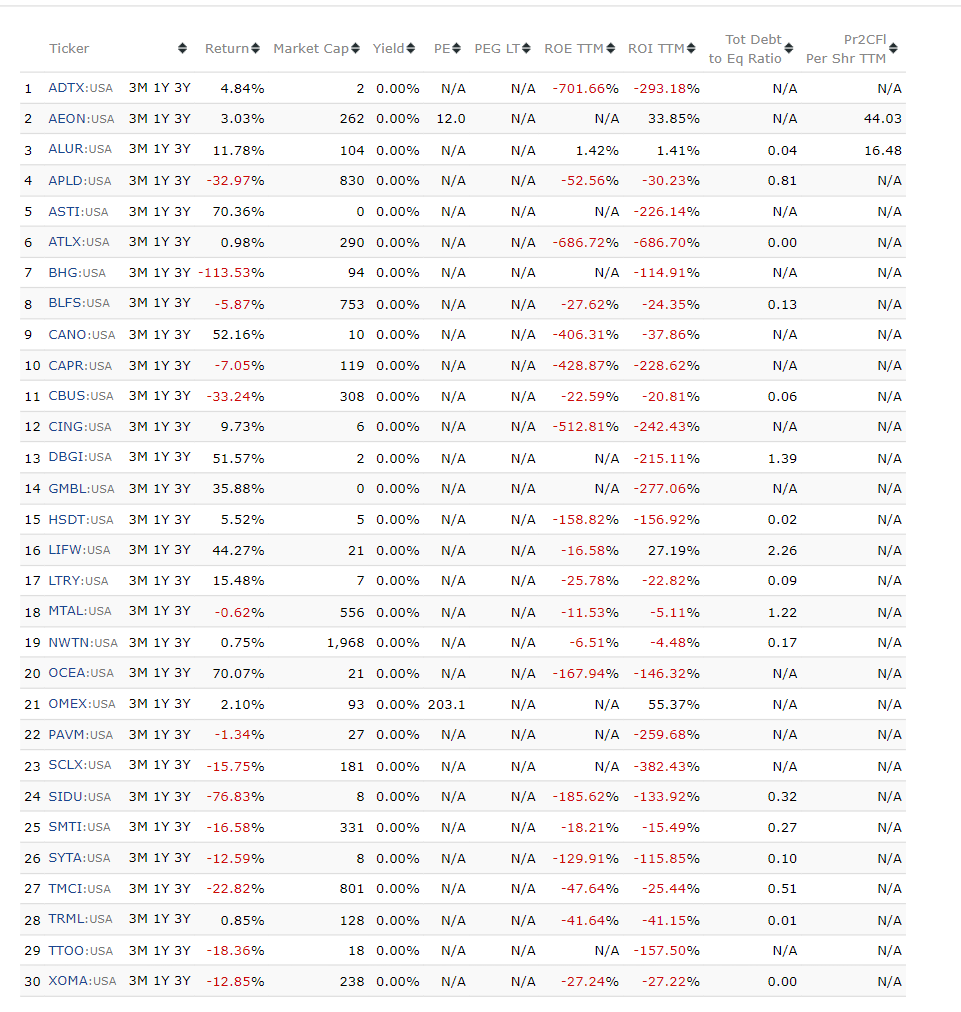
For example, let’s say you build a ranking system that has the goal of getting an as low as possible return for the top 5% bucket, would -20% be a roughly good aim (using the Easy to Trade USA Universe)?

Furthermore, In terms of the amount of factors to use, I have noticed that price volatility seems to be a factor that has a way bigger relative impact on the outcome of the ranking systems than any factor I have seen in my long only systems. Excluding it from the system drastically changes the performance of the top buckets. For any long only ranking system I would prefer to ‘diversify’ by using more factors, instead of relying so much on one.

I was wondering if someone would like to share their thoughts on their experiences with their systems for going short.

Kind regards,

Victor

I can’t offer much advice on short system design. For myself, the goal is to find a short system that I expect will break even over the long term, as opposed to generate profit. The purpose of a short system for me is to reduce the volatility of the long side.

The biggest problems with short systems are not in the design but in the trading. It’s hard to find a large enough universe of stocks with predictably priced options, and the spread on options rapidly kills any potential returns. It is hard to get reliable historical data on options to use to test theories.

If you directly short the shares rather than use options, you have a larger universe of stocks, and in normal times the availability of shortable shares and short borrow fees are generally reasonable. But in the volatile times, when you really want your short side to trade effectively, the fees, availability and even marketability of shorts become extremely difficult to manage. In periods like March of 2020, the actual performance of my shorts was dramatically worse than their simmed performance, and my review of it suggested that almost all of the underperformance was due to an inability to trade into or out of what the system recommended.

1 Like

I agree with both of you. Personally, I have not been able to find a system for shorts that would both hedge my longs and improve my returns. I believe that using put options is better, and I’ve had a great deal of success with that in the last two years. But there are other periods in which put options would completely fail. My most realistic backtest of a put-based strategy has a 99% drawdown at one point. That said, I’m betting that using a combination of moderate leverage (1.3X, maybe a little more) and a small puts-based hedge (15% to 20%) will improve long performance while keeping volatility low.

Like Victor, I’ve also found that price volatility is the number-one factor for successful short/put strategies. I’ve also found that value factors don’t work very well, and that stability, quality, and momentum factors are much better. I’m especially interested in factors that measure company instability based on changes in financial reports; and when it comes to quality, debt is very important.

If you’re using put options rather than shorting, you’ll want to really focus on stocks with extremely negative returns. If your price returns are between -20% and 95%, it’s better to use shorts. But if several of your positions fall more than 20%, then puts might work better. Shorts have a beta of -1 while puts have a beta of about -5.

I’m trying to do the same thing. I’m happy with any improvements in terms of returns on the ‘short side’.

I’ve put in some hours yesterday. Here are some factors that seem to enable me to reduce the weight of price volatility as a factor in my ranking systems without losing too much of the (negative) performance in the top buckets:

I’m also looking into finding ways to find facators based on financial reports, but up until now their impact hasn’t been as strong as the ones I’ve mentioned above.

In my research, I found high SGandAGr%PYQ to be a pretty powerful short factor, especially when combined with other quality and cash flow factors. It make sense intuitively. Bleeding cash while having to do a lot of heavy lifting to attract sales is probably not a good combination. Many of these companies are fallen growth angels and are desperate to pump up their revenue numbers to keep the narrative going for another quarter

This is a very interesting problem. My short systems- none of them, outperformed the market in the long term. They do indeed reduce the volatility. There are periods when companies ranked very high in my short system rankings grow very rapidly, which results in high drawdowns. One of my short system had a 50% drawdown during last 3 months for instance.
However, I find it very useful to use short system accordingly to US- 10y3m bond yield spread. When the spread is negative, short systems tend to give better results. Did you also observe it in your systems too? The moment when the curve disinverts, is an exeptionally good moment for hedging strategies, probably because it was a good predictor of the upcoming recessions in the past.

My experience is largely consistent with previous commenters. While I have good fidelity between my simulated/live long strategies and actual trading results, there’s a much bigger shortfall between my simulated/live short strategies and their actual results. Quite simply, having a single static borrow cost for the short strategy is far too unrealistic, both over time and cross sectionally across stocks.

One of my main goals for 2024 is to incorporate borrow fees into my short simulations and trading, so I’ll likely have to implement this off of portfolio123.

I think an aim of 20% for the top 5% of the Easy To Trade USA is too lofty of a goal. My best short system to date only yields 15.6% on the top 5% of that universe over 2001-2018:

In practice, I don’t use the Easy to Trade universe, because I implement higher liquidity and market cap thresholds in an attempt to steer towards stocks with lower realized borrow costs.

Some other thoughts:

  • Price volatility is definitely a factor (though not my biggest). As a result, your short system will skew towards volatile names and the overall performance will be volatile. Maximum drawdowns of 80% are not uncommon, but it’s hard to evaluate these in a vacuum as these strategies will likely not be traded on their own, but as part of a book paired with a long strategy.
  • I’ve used two ways to build short ranking systems: inverting a long strategy and trying to build a short-focused ranking system. Both are viable, but if you tend to focus on optimizing the performance of the top bucket or buckets of a system (rather than overall quality of ranking), then building a short-focused system will probably yield a better result for your approach.
  • Think about how you’d actually want to trade your long/short mix in actual trading. While the short side can reduce volatility, you can also use it to increase leverage on the long side of your book as Yuval pointed out. For example, you could trade a 100%/20% long/short book, have reduced volatility and collect the short interest credit on the 20% cash in your account, or you could lever to 120%/20% which may trade off a lower Sharpe for a higher expected CAGR.
2 Likes

Since you said “-20%”, I’m assuming you’re looking at the bottom bucket of a rank performance with transaction type set to Long. You may already know this, but you can’t just invert the sign of a long rank performance to estimate short performance because of the effect of dividends – the short rank performance of the top bucket will be worse than the inverted long rank performance of the bottom bucket.

The results will match closer on universe with no dividends, but still won’t match perfectly as some stocks on the bucket boundaries will shift buckets when you invert directions.

1 Like

It is indeed a nice addition. Other fundamental factors that I think are a good addition are an increase in inventory (to assets), three year total asset variability and any type of factor that checks for profitability or cashflow generative ability in the past few years.

Actually, I never really thought of this before. I guess this also means that there are factors that add (negative) returns to the bottom bucket in a Long system, but that do not add positive returns to a top bucket in a Short system. That’s actually quite confusing. I think in the future I will have to run it in both ways.

Besides this threat, I found these resources to be handy:

I’ve created a simple (equal weighted) public ranking system based on the factors listed there and added the factor mentioned by InmanRoshi (sgandagr%pyq), as well as the inventory increase factor, the asset variability factor and a cashflow generative ability factor I mentioned myself.

The ranking system can be found here: https://www.portfolio123.com/app/ranking-system/438228.

In this case the Easy to Trade US Long system generates about 14% return for the ‘worst’ bucket. In case of a Short system it is about zero.

I’m hoping this will lower the bar for others to share some more factor ideas for going short :slight_smile:!

Victor

I worked on the ranking system I posted earlier today to see if I can get the returns up, adding mostly fundamental factors. I’m at around 15% now for different universes, below is Easy to Trade USA. Thought I would share the graph to brag a little (kidding of course).

I’m still quite eager to see if I can get it up to 20%, any tips are welcome.

Victor

Can you include the “Show Settings” output in your rank performance chart? The benchmark result is different, so I wanted to cross check the benchmark asset and period.

Like this?

Not shorting individual names, but ETFs, mostly IWM as a hedge when market conditions turn sour…

So far the market calls have been o.k. https://maxquantstrike.substack.com/

Victor,

This is crazy impressive; even a 15% top bucket on EasyToTrade is Impressive! I’ve built multiple models and found many local minimum buckets when searching for an optimal solution. e.g., I followed the rabbit hole you created, starting with Price Volatility, Then Moving to Earnings Volatility, then Moving to Estimates Volatility, anchoring each as the primary driver against other sprinkled nodes. I’ve not even come close to your performance; attached are my feeble attempts that, while positive and valuable as a hedge against my main strategy, are still lacking; note one of the systems, I reversed the process and looked for the bottom bucket vs the top trying to take advantage of NA as Negative.

Also, I’ve noticed that even if I have a reasonable top bucket performance, I may have a lower performance when I apply that to the simulated strategy. Heck, applying a single factor CurQEPSStdDev while the RS is lower leads to outsized performance in the SS. (See Below)

Example Model built from your starting point with 4% across 25 Nodes.

This leads to this SS (new Rule Close(0, $VIX) < 20 Hat Tip Hemmerling + Ranking), which is quite good, but I’m hesitant to trust it!

Then I tried to build from Scratch without anchoring from your model and flipped the ranking to take advantage of NA as Negative. Where the anchor was on CurQEPSStdDev (40% weight)

This leads to this SS (Close(0, $VIX) < 20 + Ranking ), which is reasonable as a hedge, but again I’m hesitant to trust it!

But If I just anchor against CurQEPSStdDev (100%) I end up with the following Which is incredible for a single factor.

Finally I’ve had minimal success flipping a long model as shown below.

So no success in flipping and tailoring a strong long model to a short model. I don’t recommend it.

So all this long-winded analysis comes down to the question of “HOW in the world did you get to 15% top bucket performance?”

Tyler

I made it to 20% today! :smiley:

I would say that most of the factors I’m using focus on looking for companies where the situation is quite uncertain, not even ‘bad’ necessarily, just uncertain. CurQEPSStdDev is just one of the factors that measures this quite nicely.

Congrats! I was able to make it to 18+% with 20 buckets, and I like the idea of overall uncertainty ConsEstStdDev + other uncertain high variance StdDev Paradigms.

However, Here’s my problem, which deals with the SS Side of the Equation vs the RS Side:

  1. If I optimize for a wide bucket (95-100), I may end up with a more robust overall solution. See the Images Below, which have decent performance for a short strategy in an overall upmarket.

But if I optimize for the best solution while targeting the 99/100 bin, I end up with a better SS solution but may have a higher risk of lacking performance OOS. (See Image Below) So, I’m faced with the challenge of whether I believe my 99/100 solution or NOT?!?

Which should I target and why? What would you do?

Really interesting thread. Curious about the short-system holdings. Anyone care to share what their system holds?

Here are the current holdings for one of my short live strategies, although one that I’m not actively trading.

Note that most of these are currently easy to borrow at IBKR, with borrow fees of <1%. Exceptions are LAZR (11.36%), SHOT (117.72%, maybe no shares available), and VRCA (6.83%).

I haven’t checked for the borrowing cost on IBKR yet. Also, my ranking system currently consists of about 130 factors that are equally weighted. I’m planning to improve returns further by removing them one by one and working on the factor weights a bit.

Compared to feldy, I see the current overlap is APLD.

Hi!, How do you manage risk when you going short stocks? Do you use stop losses ?