I have the same feeling as you do: the Close(0, $VIX) < 20 rule boosts returns significantly (and even better is LoopMin(“Close(Ctr,$VIX)”,20) < 20), but should I trust that? I’d welcome anyone’s thoughts, especially those of @hemmerling . . .
I haven’t read through this thread and am just showing up as my name was mentioned. The linked article of mine uses a rule to short stocks when VIX is lower. Higher VIX either means raging bull rally or market crash which leads to correlated markets. For shorting stocks I prefer a high dispersion market. At least with the factors I use for shorting. Stock pickers market.
That's very helpful. Could you please provide the link? Thanks!
This one.
Thanks! I notice that you @hemmerling wrote, “The only time I don’t recommend shorting is when the market is down, the VIX has spiked and beginning to subside.” Is that still your practice? Do you have a formula for that which seems to work without too much whipsawing? I really appreciate your logic behind this: it’s very intuitive.
I have used two basic rules that have worked OK but still needs improvement. When VIX is under 20 or when VIX is more than what it was 20 days ago is when I feel comfortable shorting low quality stocks. But where I need to improve upon it is when VIX is under 20 but still rapidly compressing. There was a period from November - December where the high risk shorts got slaughtered. It is back to working again though. I have to find a way to include VIX stability or low variance when it is under 20.
You’re approach reminds me of what Verdad Advisors writes about the high yield spread (The Best Macro Indicator — Verdad).
Basically: when spreads are high (and preferably falling), small cap value stocks usually rally (they profit the most from liquidity flowing back into the economy).
The VIX and the High Yield spread are highly correlated (as can be seen by eyeballing CBOE Volatility Index: VIX | FRED | St. Louis Fed, which plots both historical VIX and HY-spreads).
Hence, if we accept that small cap value stocks do well when spreads are high (and thus when the Vix is high), it is safe to say that it might not be the best time to be shorting stocks during that same time as some of the most ‘risky’ stocks - pure small cap value stocks - actually outperform.
One thing that could form a solution for the problem you describe @hemmerling when the vix is ‘low’ but becomes even ‘lower’ might be to use a medium/long term moving average to define what low is, instead of holding on to the number 20. This is also exactly what Verdad does: they define a trailing median to define what ‘high’ and ‘low’ is.
To prevent whipsawing, I see that Verdad for example states the following: “(…) we use a simple definition of trend: whether current market prices are above or below the 200-day moving average. Specifically, when the price level of the risky asset (e.g., S&P 500 or gold) falls below its 200-day simple moving average for five consecutive days, we reallocate the risky share of the portfolio to 10Y US treasuries.” (Designing a Countercyclical Strategy — Verdad)
So perhaps something as simple as requiring 5 consecutive days could be enough to prevent whipsawing.
Just some of my thoughts…
I don’t short stocks, but I do short indices. My No1 rule in shorting indices or bonds is to never ever be short over TOM (Turn Of the Month), the buying pressure over TOM is just too strong.
And if you use USSLIND as filter (leading index falling) for when to be short you should have a quite good edge.
Here is quick test to be long RWM (Short Russell 2000) few days in to the month until a few days before end of month when leading index is falling.
2 Likes
P123, what is the proper way to access this series? Is it;
Close(0,GetSeries(“##usslind”)
or
Close(0,PITSeries(##usslind)
I used
close(0,##USSLIND)<close(1,##USSLIND)
Thanks for sharing this rule. It really works.
However I would use : Close(0,PITSeries(##usslind)) to avoid look ahead bias.
If you use close(0,##USSLIND), then value for 12/2023 of this series, would be available for you on 1st December during backtest while the value for 12/2023 was released on January 12, 2024. I maybe wrong but this is my best guess.
In addition probably the best way would be to aggregate many promising rules into one estimator, like this as an example:
avg(Close(0,PITSeries(##usslind))<Close(1,PITSeries(##usslind)), LoopMin(“Close(Ctr,$VIX)”,20) < 20, Close(0, $VIX) < 20)
this produce value between 0 and 1, and use this estimator to assign weight to your short exposure.
1 Like
I would be careful relying too much on VIX as an risk indicator. These last two years it has not behaved as expected .
That series starts mid-2018. Just sayin'
I got it to 20% using volatility lower is better, where these factors are about 3% of the total amount of factors (150) in the ranking system. My idea is that these stocks have a better chance of being ‘under the radar’.
Having said that, most of the stocks in the top ranks of the ranking system are still very volatile.
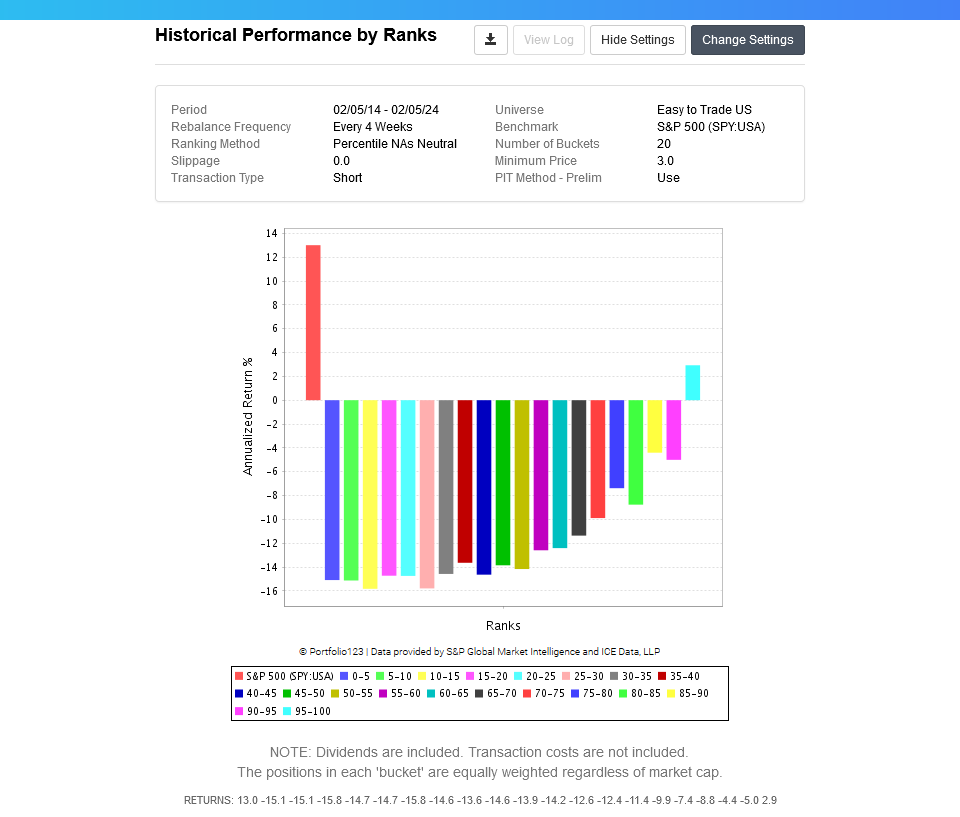
Running the RS as a shorting simulation with 30 stocks and 10% margin carry cost in the Easy to Trade US Universe, the system ends up with a 30% annualized return, which seems very attractive, especially because the returns occur in periods where markets (and my long systems) do not do so well.
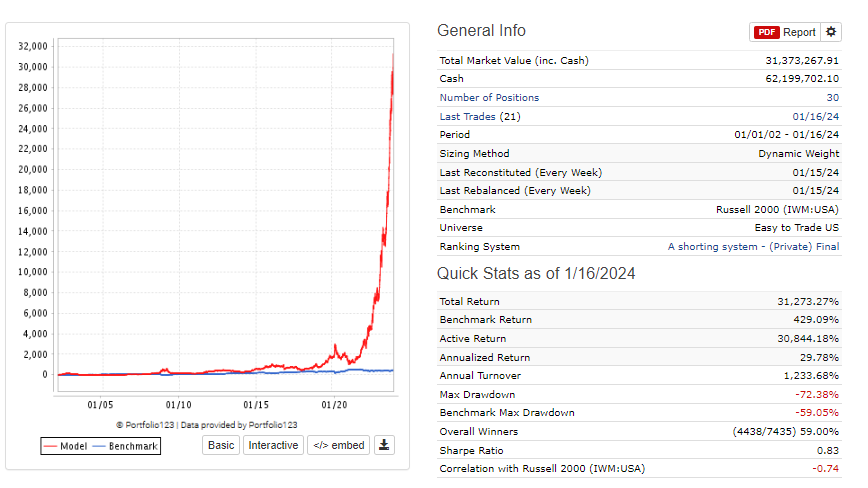
I’m still hesitant to implement it in practice via a book though, as I am unsure about how to deal with short selling restrictions or the situation where lending costs in practice will be higher than 10% for some stocks, especially because I like trading via the account strategies section of portfolio123 with a link to IBKR.
That doesn’t even take into account yet that about 50 out of 10.000 transactions (1 in every 200 transactions) in the past 22 years had a return lower than -100%, the worst transaction did -600%. That would have been hard to stomach.
I could set up a seperate IBKR account specifically for trading put options by an amount equal to about 10% of the long stock portfolio. But this would mean that I would have to transfer money from one IBKR account to the other every now and then to keep the balance at 90 / 10. That seems like too much of a hastle.
I still need to think this through…
Do you guys get the lendings for putting on the short and if yes which broker do you use?
Victor,
Am I reading you right that while a short or puts system usually looks for the most volatile stocks, you got the 20% short return by reversing that node? If so, that seems entirely counterintuitive. What made you think about trying it, and what’s the rationale? I can’t get anywhere near 20%, but I’m not really trying, instead trying to get negative alpha for top-ranked stocks with much longer holding periods over the last ten years (I use the rolling screen for testing rather than the rank performance) . . . But when I ran my ranking system after reversing my volatility node, my performance on this measure certainly did improve! What is going on here? If I optimize for long-term negative alpha, high volatility is my number-one node.
BTW, what does 20% in “transaction type: short” convert to if you use transaction type: long and reverse the ranking system direction? Does reversing the volatility node have the same effect if you do it that way?
I already managed to get 20% returns on Easy to Trade US (for what that’s worth) before inverting the node.
The reason for inverting the node was to see if I could make a ranking system that was less reliant on high price volatility. I don’t like reliance on any one factor. As you have written yourself (if I remember correctly), price volatility is likely a proxy for other ‘volatilities’ , so I try to look for factors that capture that volatility. Apart from that, with Black-Scholes being so main stream, I’m betting that other investors will also be comparing historical price volatility to implied volatility. Of course, price volatility is known to be pretty persistent, so if you look for highly volatile stocks, then more likely than not, they will stay highly volatile. But if we can find other factors that are predictive of riskiness, we might be able to buy put options that have low price volatility while in fact they are quite risky (and probably those put options will be relatively cheap).
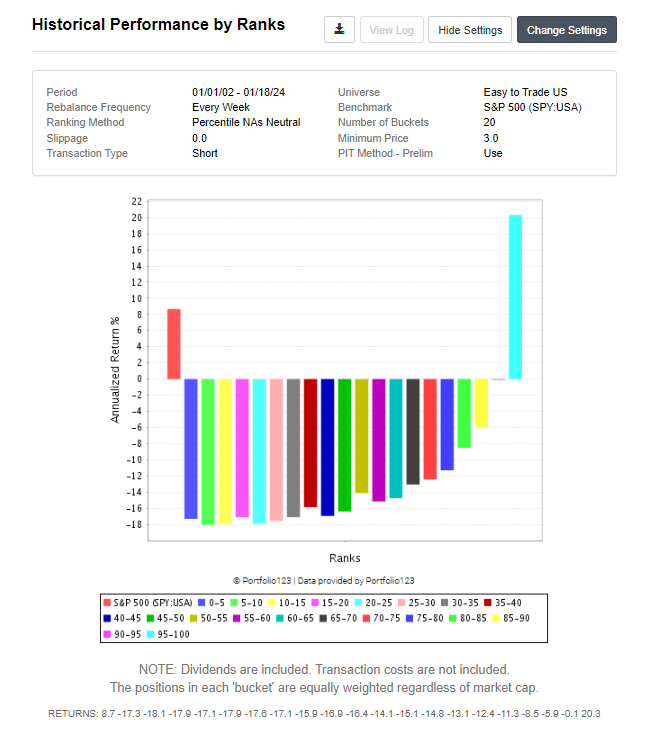
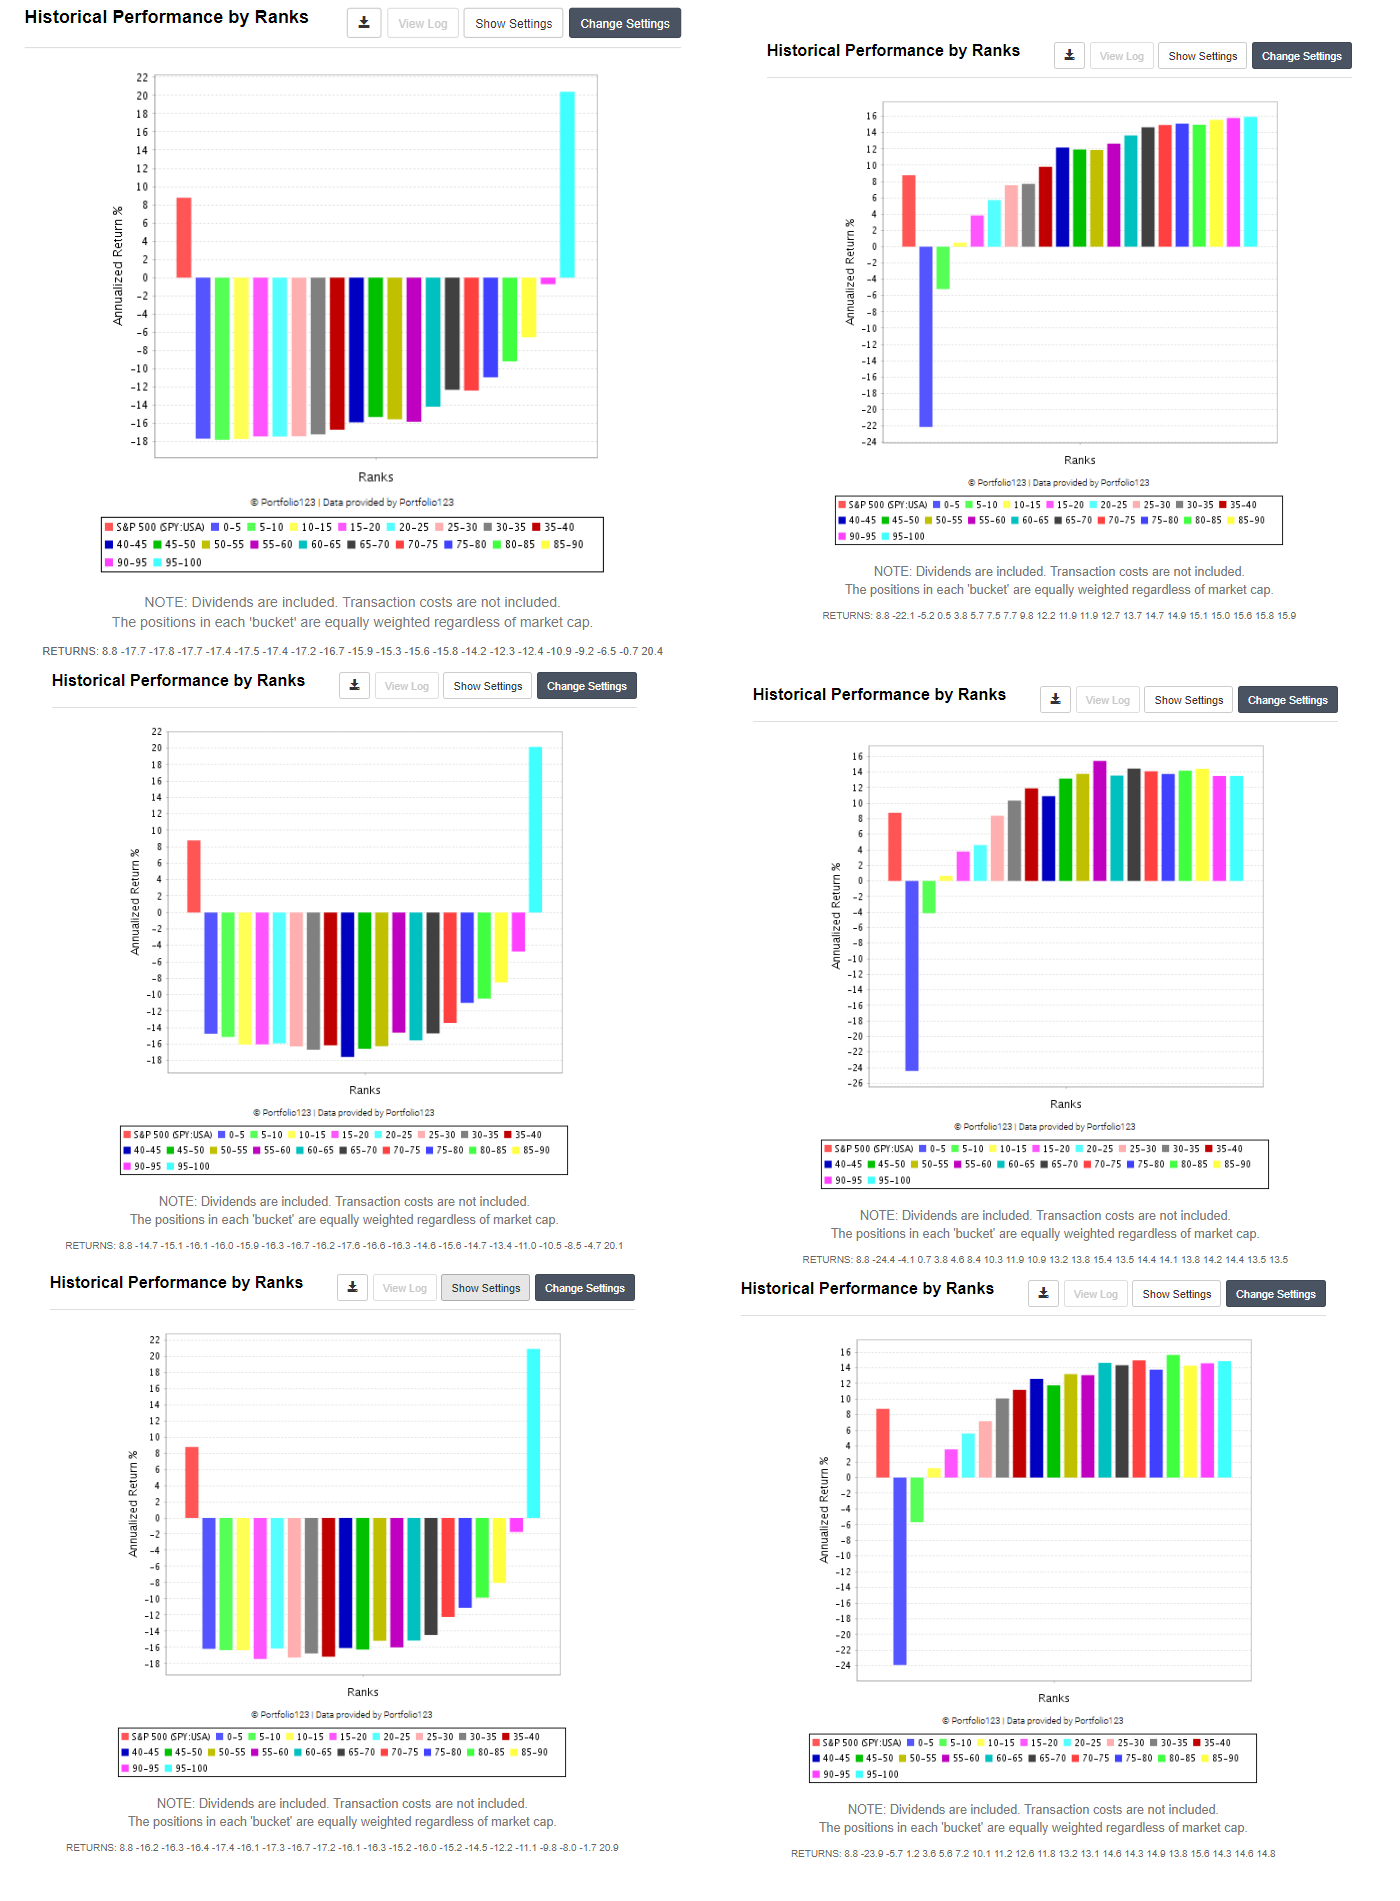
Below are the results for the ranking systems, where there first row is with volatility lower is better, the second is higher is better and the last one is without the node. From that I get the impression that the short system is not so reliant anymore on this one factor (results are the same when splitting the universe in 5 subsamples).
Thanks Victor for all your help; your ideas really helped me build a short only strategy. I’m still using a bit of weight into Price Volatility but it is by far not my highest weight. I took a different approach where I just hit RS of 21. I focused on the most uncorrelated factors with uncertainty (35 total) as IMHO I’ve seen noise and curve fitting be introduced when I add correlated factors. The more noise and nodes I added were detrimental to my overall strategy. The short strategy now performs reasonably against other universes and larger number of entries. Thank you for your help!
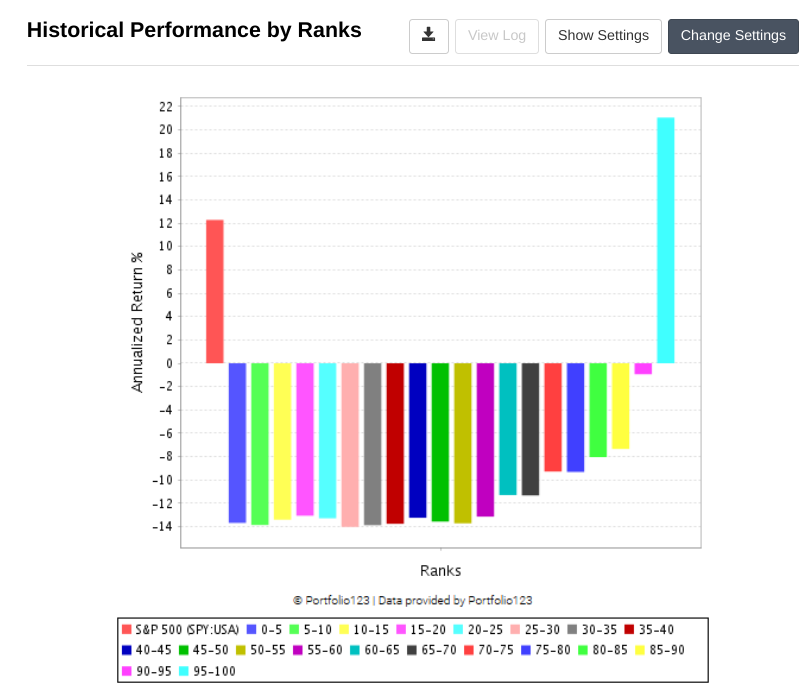
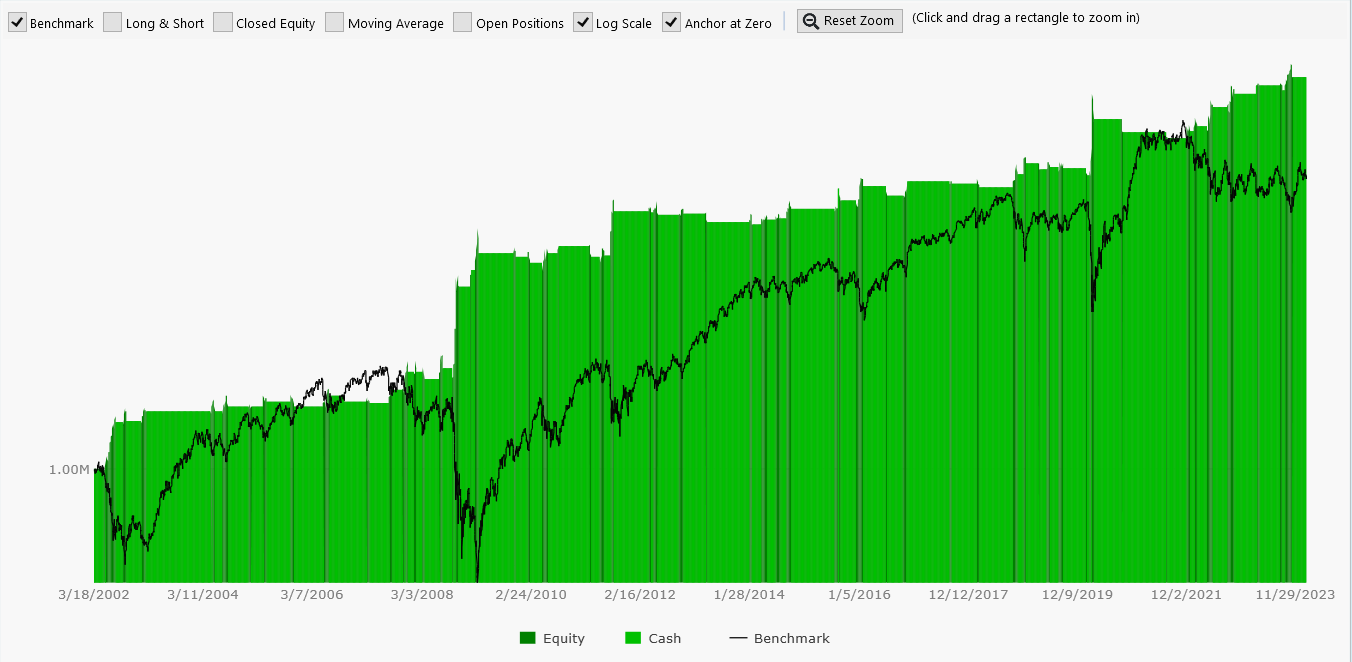
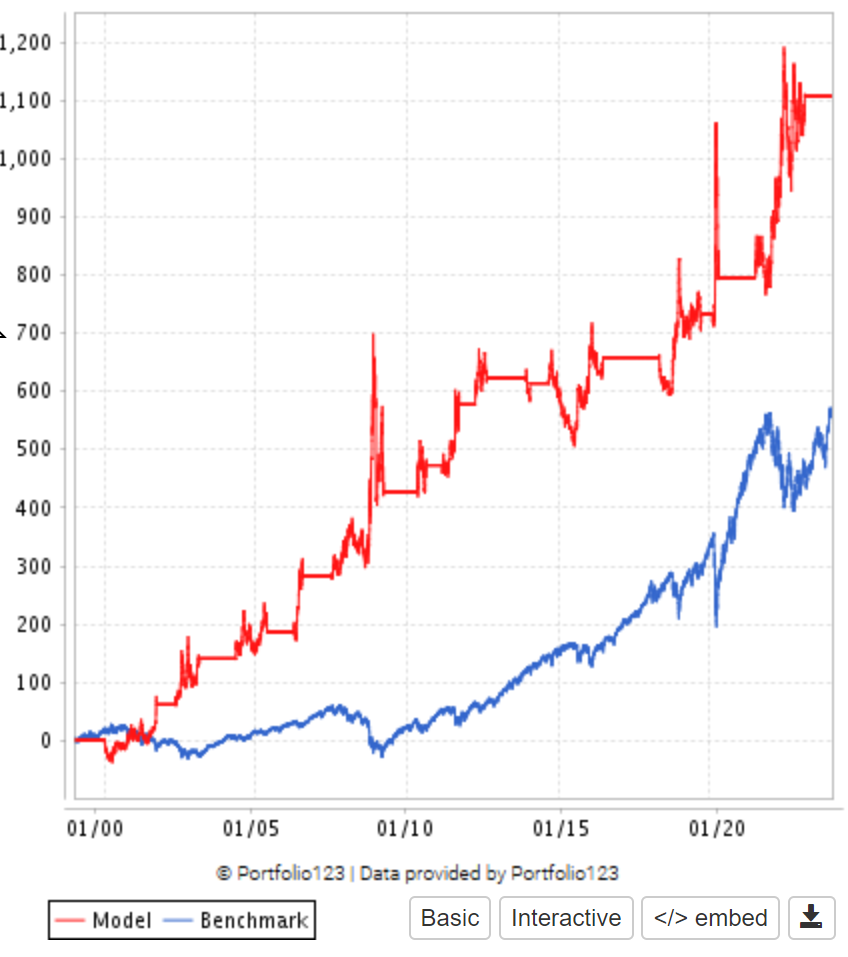
I don’t understand how you’re getting those charts. When I run long I get this:
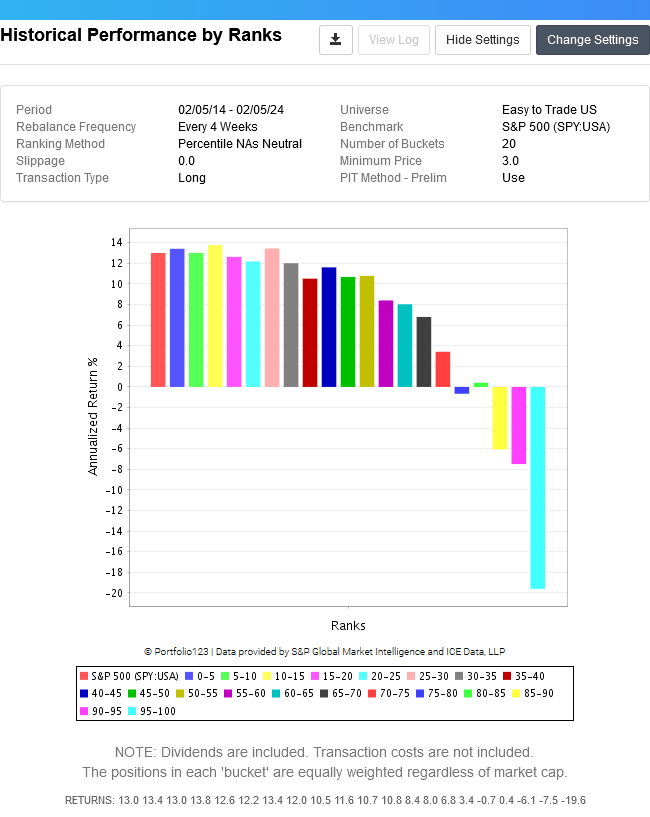
But when I run it short I get this: