TL;DR: Python’s scikit-learn library provides an r2_score metric that is distinct from Pearson’s rank correlation and may offer advantages over both Spearman’s rank correlation and Pearson’s rank correlation. The r2_score metric is pertinent for Python users doing machine learning as the r2_score metric is often the default metric in the ML models. Understanding its function is crucial for interpreting Sklearn’s model results and deciding its applicability to your analysis. If it is not applicable to your models, you can change metrics within Sklearn: Metrics and scoring: quantifying the quality of predictions
Summary of Metrics:
Spearman’s Rank Correlation: This non-parametric measure evaluates the accuracy of your ranking system by focusing on the order of stock rankings based on expected returns, irrespective of the magnitude of those returns. It is ideal when the primary concern is the relative ordering of stocks.
Pearson’s Rank Correlation: As a parametric measure, Pearson’s correlation assesses the linear relationship between two variables, accounting for both the order and the magnitude of the predicted returns. This metric is useful when the degree of returns is as significant as the ranking itself.
Sklearn’s r2_score: The r2_score from scikit-learn quantifies the variance in the dependent variable that is predictable from the independent variables, suitable for both linear and non-linear models. This metric is comprehensive, taking into account the magnitude of returns, which could provide a wider lens on model performance.
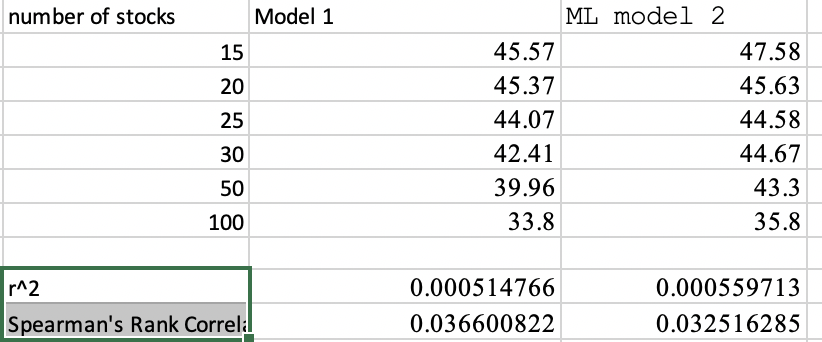
The accompanying example illustrates that scikit-learn’s r2_score has a stronger correlation with model returns compared to Spearman’s rank correlation, indicating its potential to provide deeper insight into the model’s predictive strength due to its magnitude consideration.
In any case, it is critical to note that the r2_score from scikit-learn is not merely the square of Pearson’s rank correlation; these are two separate metrics. For Python users, the r2_score is particularly valuable, capturing both prediction accuracy and return magnitude (in a non-linear manner), and could be a beneficial metric for evaluating stock ranking systems.
In conclusion, while Spearman’s correlation excels in assessing ranking accuracy and Pearson’s provides insight into linear relationships, scikit-learn’s r2_score presents a comprehensive view by recognizing non-linear relationships and the magnitudes of predictions. This metric could thus be a crucial addition to the toolkit for those analyzing stock ranking systems using Python.
Thanks Jim, going to take a look at it. I’ve been testing pearson, spearman, and kendall’s tau. Ironically for my model plain vanilla pearson seems to work the best.
misunderstood at first… looks like the r2_score is just a generalization of the normal r^2 that we are all used to from linear regression. is defined as the % of total variance explained, and for simple linear models is just the square of the standard pearson correlation coefficient.
Correct, I’m also in the process of learning about these metrics. It’s quite an intricate topic, isn’t it? Initially, I almost jumped to the conclusion that Pearson’s rank correlation was superior to Spearman’s based on my data., But I cannot conclude that from the data I shared as r2_score is distinct from Pearson’s rank correlation.
An interesting and important aspect to note is that the ( R^2 ) score can be negative, which is counterintuitive at first glance since Pearson’s correlation coefficient (( r )) squared (yielding ( R^2 )) is always non-negative. This is because we’re no longer talking about pure correlation but rather a coefficient of determination, which reflects how well our model predicts the dependent variable.
A few years ago, @InspectorSector and I were puzzled by a negative ( R^2 ) value from an early neural network model. It was a real “aha” moment that illuminated my understanding r2_squared but I almost forgot my lesson. So for those who might be as perplexed as I was back then, encountering a model with a negative ( R^2 ) score is a clear sign that the model is underperforming—even more so than the most basic model that simply predicts the average outcome every time.
Here’s a succinct explanation: A negative ( R^2 ) score suggests that the model is doing worse than a simple horizontal line representing the mean of the dependent variable. Essentially, the model’s predictions are poorer than if we had no model at all—a definite red flag.
In my earlier days, I misinterpreted the ( R^2 ) score as simply the square of Pearson’s correlation and didn’t consider computing Pearson’s rank correlation separately. So Pearson’s rank correlation is not in the data I shared.
I’d love to hear if others have further insights regarding these metrics.
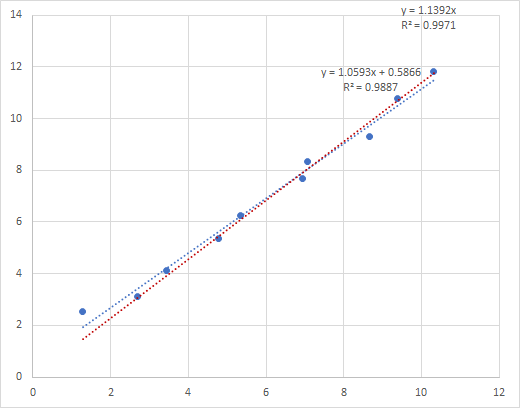
Something to note regarding R^2 (and, by extension, Pearson’s). Linear regressions with the intercept set to zero often have much higher R^2 than linear regressions with intercepts. This does not necessarily correspond to a better fit. R^2 is therefore not a very rich way to tell whether a line is a good fit for the data.
Here’s an example.
The red trend line has the intercept set to 0, and has an R^2 of 0.9971, while the other trend line has an intercept of 0.58 and a lower R^2. But the one with the lower R^2 is definitely a better fit. Why? Because the data was generated as follows. X values were Row()+Rand() and Y values were 1+Row()+Rand(). So the intercept should be around 1. Here the difference isn’t great, but I’ve seen much more extreme examples. The reason has to do with how R^2 is calculated.
This is correct. There’s this issue and others with R^2. The result is that regression models are almost always evaluated with MSE, RMSE, MAE, etc., and not R^2, in the stats/ML literature.
Thank you. My understanding is that P123 will be providing cross-validation for its ML implementation. It will be interesting to see what metrics P123 uses in addition to possibly using the metrics available in the rank performance test to select the best model (using cross-validation) .
Your list is worth considering if P123 does decide to add additional ML metrics, I think.