I just tested this. One has to be careful here. The BUY and SELL signals from an indicator must have a Friday date for Monday trades, other wise if the signals have a Monday date then the trades occur a week late on the following Monday.
This new tool works well. Thank you P123 team.
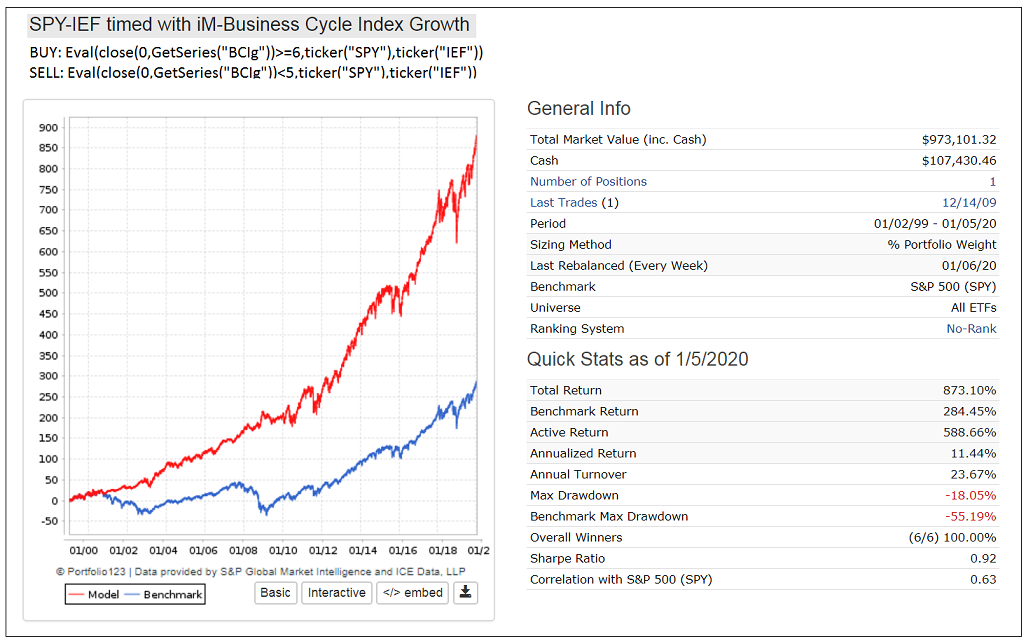
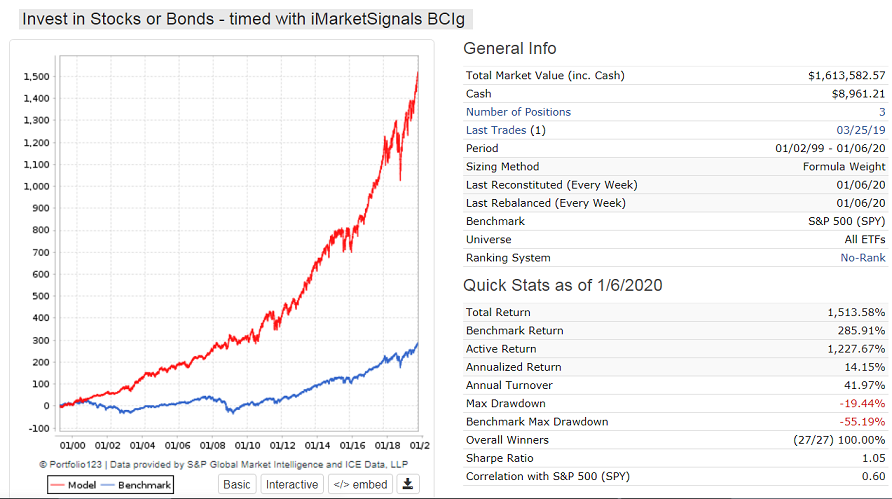
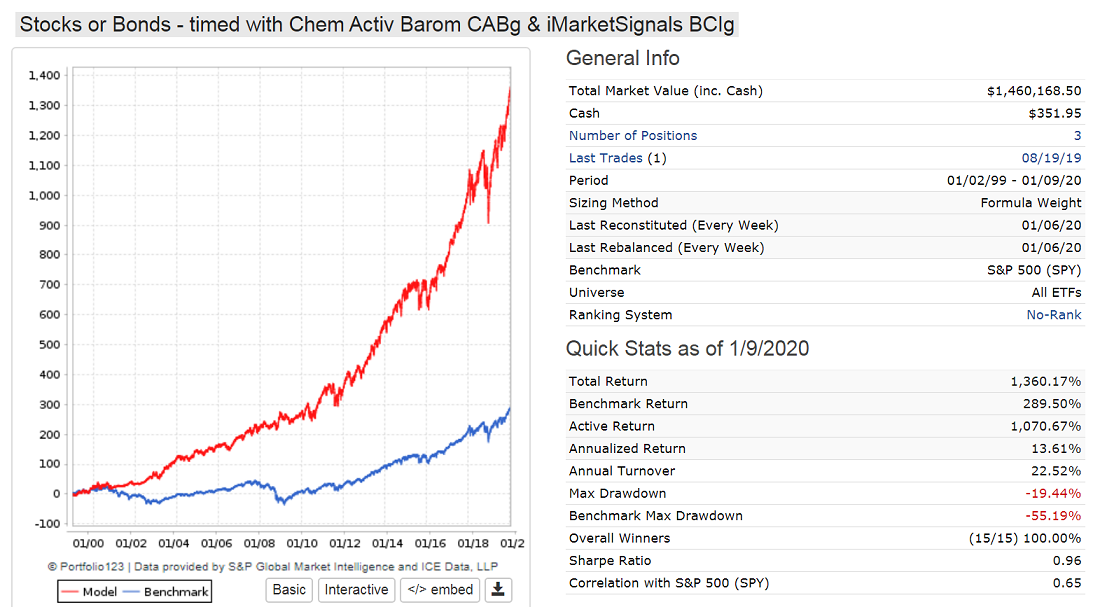
Here is SPY-IEF timed with the growth rate of iMarketSignals Business Cycle Index, BCIg.
You can download the BCI series here to try it out.
There are only 3 periods of SPY investment and 2 for IEF.
Much better than buy-and-hold SPY.
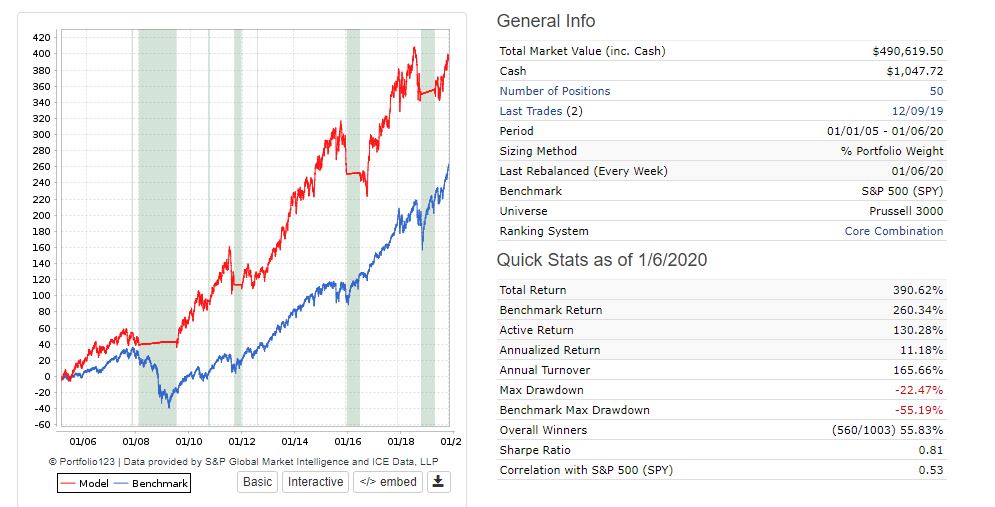
Here is a simple example of portfolio following a 50/200 SMA trend hedge of it’s own performance. This simple port is just yuval’s Core Combination rank against the Prussell 3000 with a Buy/Sell rule Rank > 90 with 50 positions (the max for my membership) with variable slippage on the next open. The hedge is off a data series that took all of 2 minutes to create and significantly lowered drawn down, raised sharpe without hurting overall performance. The model simply moves to short term bonds when it is out of favor and gets back in the market when it’s back in favor.
It’s pretty common to use a trend timing methods against a SP500, but if your model is skewed more towards something like small cap value and is not highly correlated with the SP500, why not just use your own index that reflects your model? What do you care if the SP500 is trending down if your model is flying high?
Next step is to create several portfolios that (in theory) have lowered correlation … likes say small cap value portfolio vs. large cap growth portfolio… and toggles in and out between them using their own trends and the Portfolio function in nested Evals.
https://www.portfolio123.com/port_summary.jsp?portid=1595820
InmanRoshi,
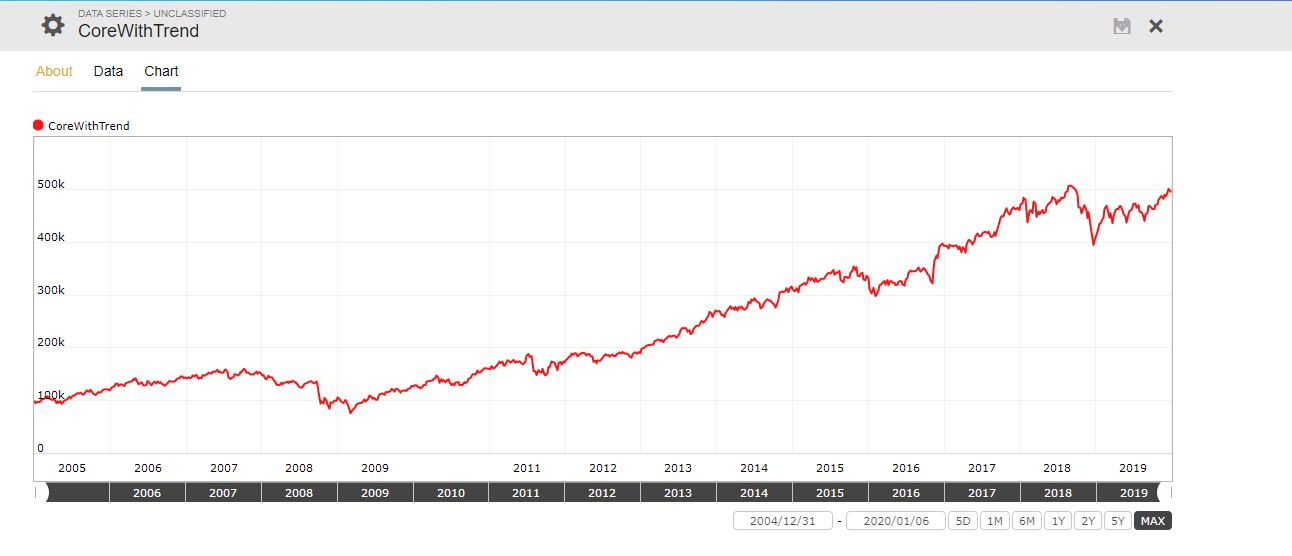
How did you determine the Series “CoreWithTrend” from the performance of the model?
Just ran a simulation of the portfolio over the maximum timeframe and exported the results into CSV keeping the Date and Total Equity column, then fed it into a new custom Data Series. If you wanted to follow the port live, you would have to refresh the series data with for every port rebalance by repeating the same process … but it takes 2 minutes to do (max).
Thanks, that’s what I thought you did.
It would be nice to have a dynamic series which does that. Perhaps P123 can make a variation of TotMktVal which references the port ID, like TotMktVal(portID).
You can almost do that now with the #Equity scope.
First in a buy rule;
isNA(SMA(50,0,#Equity)>SMA(200,0,#Equity),True) // need isNA to get the ball rollingNext add the complementary logic as a sell rule;
!isNA(SMA(50,0,#Equity)>SMA(200,0,#Equity),True)Now there’s a problem. When this sell rule triggers, all the holding are sold. Because of that, the equity curve can’t change and the previous buy rule will never go true.
One solution is to modify the buy rule to trigger on an external event;
(isNA(SMA(50,0,#Equity)>SMA(200,0,#Equity),True)) | (SMA(50,0,$SP500)>SMA(200,0,$SP500))But that changes the intent somewhat. This part needs more work. Maybe some qualifier with CashPct.
I think the custom series method also will suffer from the flat equity curve problem when processed in real-time (but I didn’t test that).
Walter
Walter, the problem with this method is that the SMA of #Equity (Portfolio/Sim total value) would then include the periods when you are not in stocks. So for the trend to be correctly identified you need 2 identical Ports, one to get the trend from and the other where the trend formula is applied to. The same applies to InmanRoshi method.
The idea is to have a self correcting strategy. As long as the strategy makes money it is used, and when the trend is against you, one would get out of stocks, or apply a hedge.
Agreed and that’s why strictly self-referential solutions won’t work.
There is another issue I have found with “Stock Factors” which is important.
Be aware, that one cannot overwrite Stock Factor data by simply uploading another CSV file to a $$ file.
What happens is that the old data is retained and the new data is added to it.
However it is a very neat addition to P123.
Here are market timer rules for the iM Business Cycle growth, BCIg.
When BCIg >=6 invest in stocks.
When BCIg <5.5 sell stocks and invest in bonds.
Buy: Eval(close(0,GetSeries(“BCIg”))>=6,$$Stocks=1,$$Bonds=1)
Sell: Eval(close(0,GetSeries(“BCIg”))<5.5,$$Stocks=1,$$Bonds=1)
$$Stocks: SPY, QQQ, VIG
$$Bonds: IEF, TIP, UST
Could someone clarify something for me? (in return I’ll give you a market timing indicator)
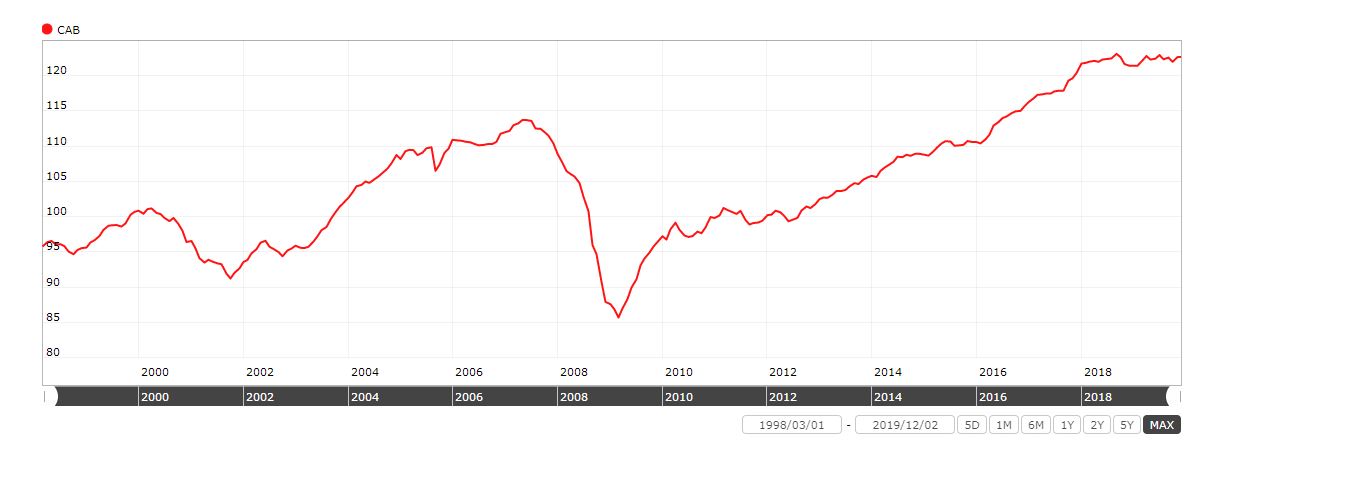
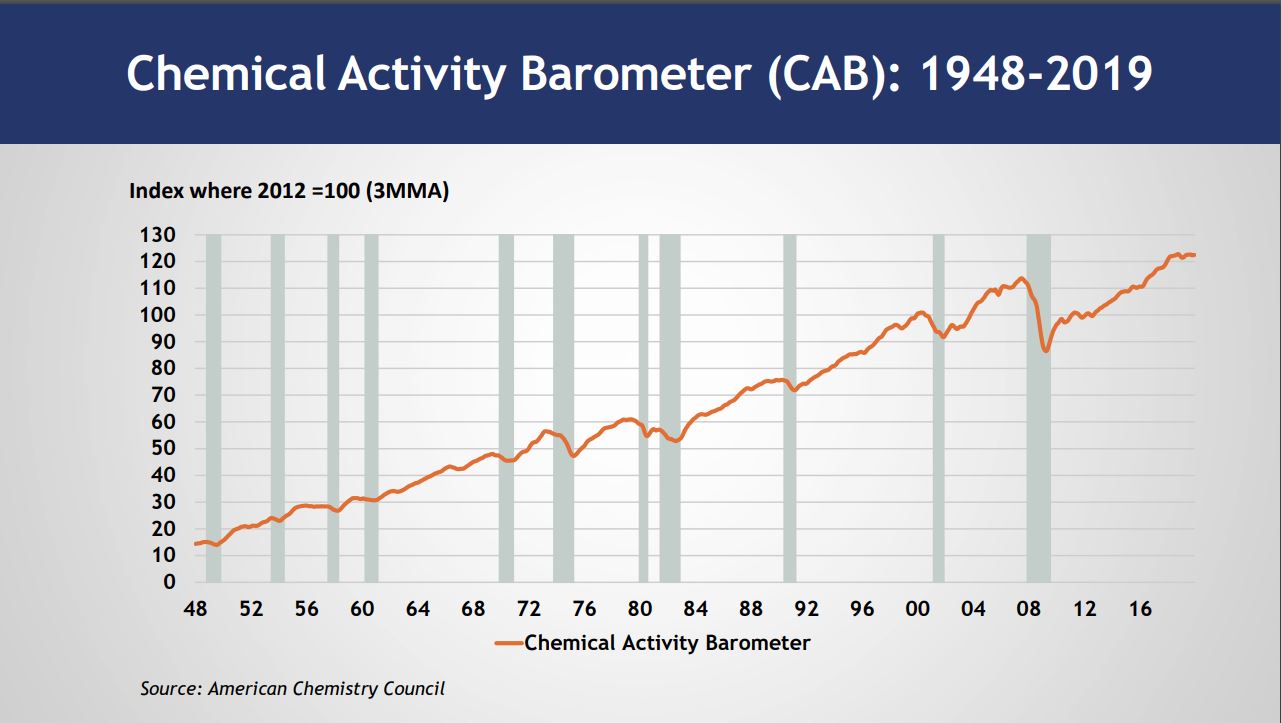
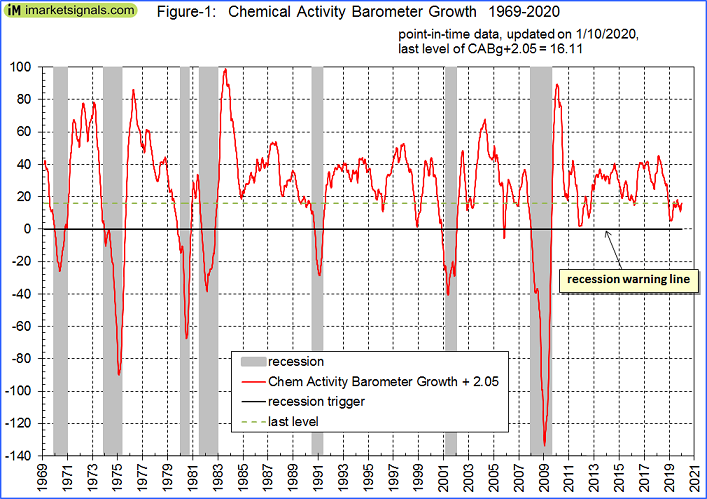
So I downloaded the data for the Chemical Activity Barometer here …
It’s monthly data, released on the 1st day of every month. I cleaned it up and fed it into a data series.
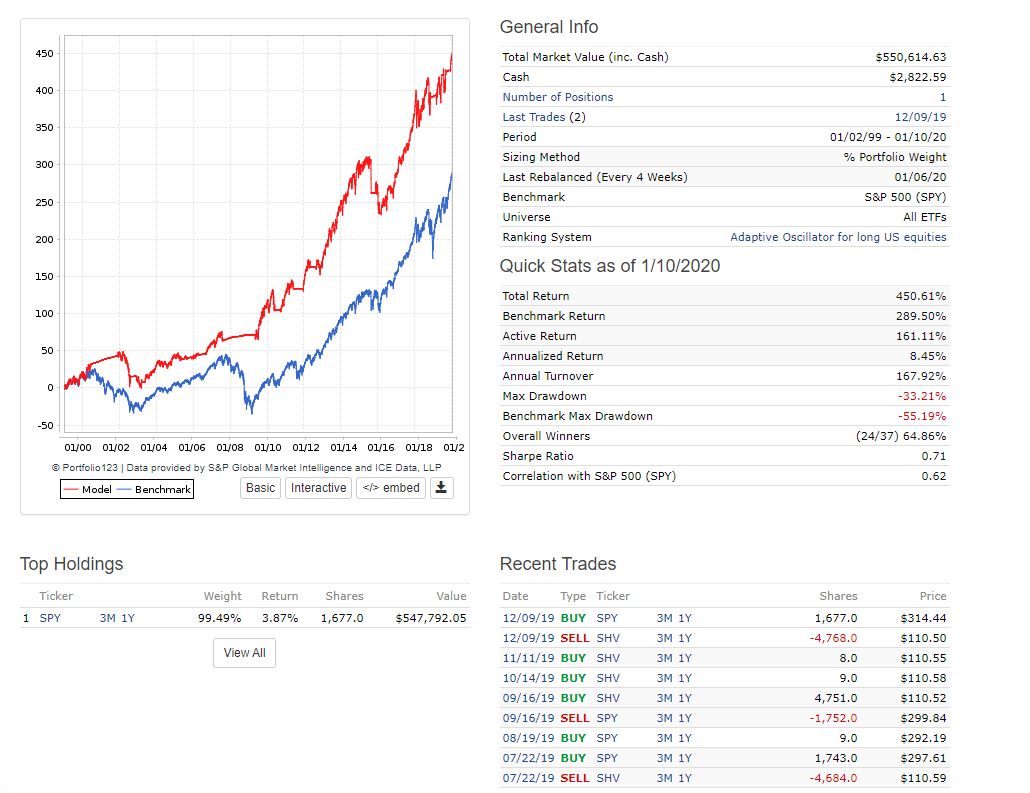
Now I run it in this sim …
https://www.portfolio123.com/port_summary.jsp?portid=1596278
monthly (4 week rebalance) with this buy rule…
EVAL(IsNA(SMA(2,0, GetSeries(“CAB”)) >= SMA(4,0, GetSeries(“CAB”)),True),TICKER(“SPY”),TICKER(“SHV”))
Sell rule:
1=1
So with 4 week reblancing, this buy rule is essentially comparing the SMAs of 2 months vs. 4 months for the CAB? Up to this point I’ve always run SMAs on a daily time period, so I’m unsure how it works on monthly…
SMA(2 . . .) always calculates the SMA over the last two bars, no matter how many or which dates are specified in the series. You’ll want to use SMA(42 . . .) or higher if you want two months and SMA(84 . . .) for four months.
That’s true. I think some of the confusion comes from Custom Series where weekly update frequency makes weekly bars. P123 isn’t always clear about issues like that.
Walter
Hi Cary, just a note in case you’re going for point in time data – unless they’ve changed recently - and can’t speak to release dates of historicals, but recently they’ve been releasing the CAB update data mid to late in the month. I follow this in an xls sheet and usually for the month in question it’s release anywhere from the 19th to 25th or so + or -. Below are the expected release dates I have recorded for 2020.
Expected CAB Release Dates for 2020
1/21/2020 (this would be for the January datapoint)
2/25/2020
3/24/2020
4/21/2020
5/19/2020
6/23/2020
7/21/2020
8/25/2020
9/22/2020
10/20/2020
11/24/2020
12/22/2020
That is correct. Dec data gets released end of Dec. So point-in-time would require the dates not to be the first day of the month, but the 25th day to be safe.
Also one should transfer the data to a growth series, similar to the ECRI WLI.
How to Calculate the Growth series from the Weekly Leading Index
ECRI’s weekly Excel spreadsheet includes the WLI and the Growth series, but the latter is a series of values without the underlying calculations. After a collaborative effort by Franz Lischka, Georg Vrba, Dwaine van Vuuren and Kishor Bhatia to model the calculation, Georg discovered the actual formula in a 1999 article published by Anirvan Banerji, the Chief Research Officer at ECRI: " The three Ps: simple tools for monitoring economic cycles - pronounced, pervasive and persistent economic indicators."
Here is the formula:
“MA1” = 4 week moving average of the WLI
“MA2” = moving average of MA1 over the preceding 52 weeks
“n”= 52/26.5
“m”= 100
WLIg = [m*(MA1/MA2)^n] - m
Also one can combine indicators. The 2nd Figure is a sim with the growth rate of the iMarketSignals BCI and the Chemical Barometer CABg.
Thanks so much for this idea, I didn’t know I needed it ![]() , but it should help keep me from jerking my ports out of the market when things get ugly.
, but it should help keep me from jerking my ports out of the market when things get ugly.
I’m not going to worry about running this on a live port, I think I’ll just update a sim with the hedge every weekend, and see if the hedge gets activated.
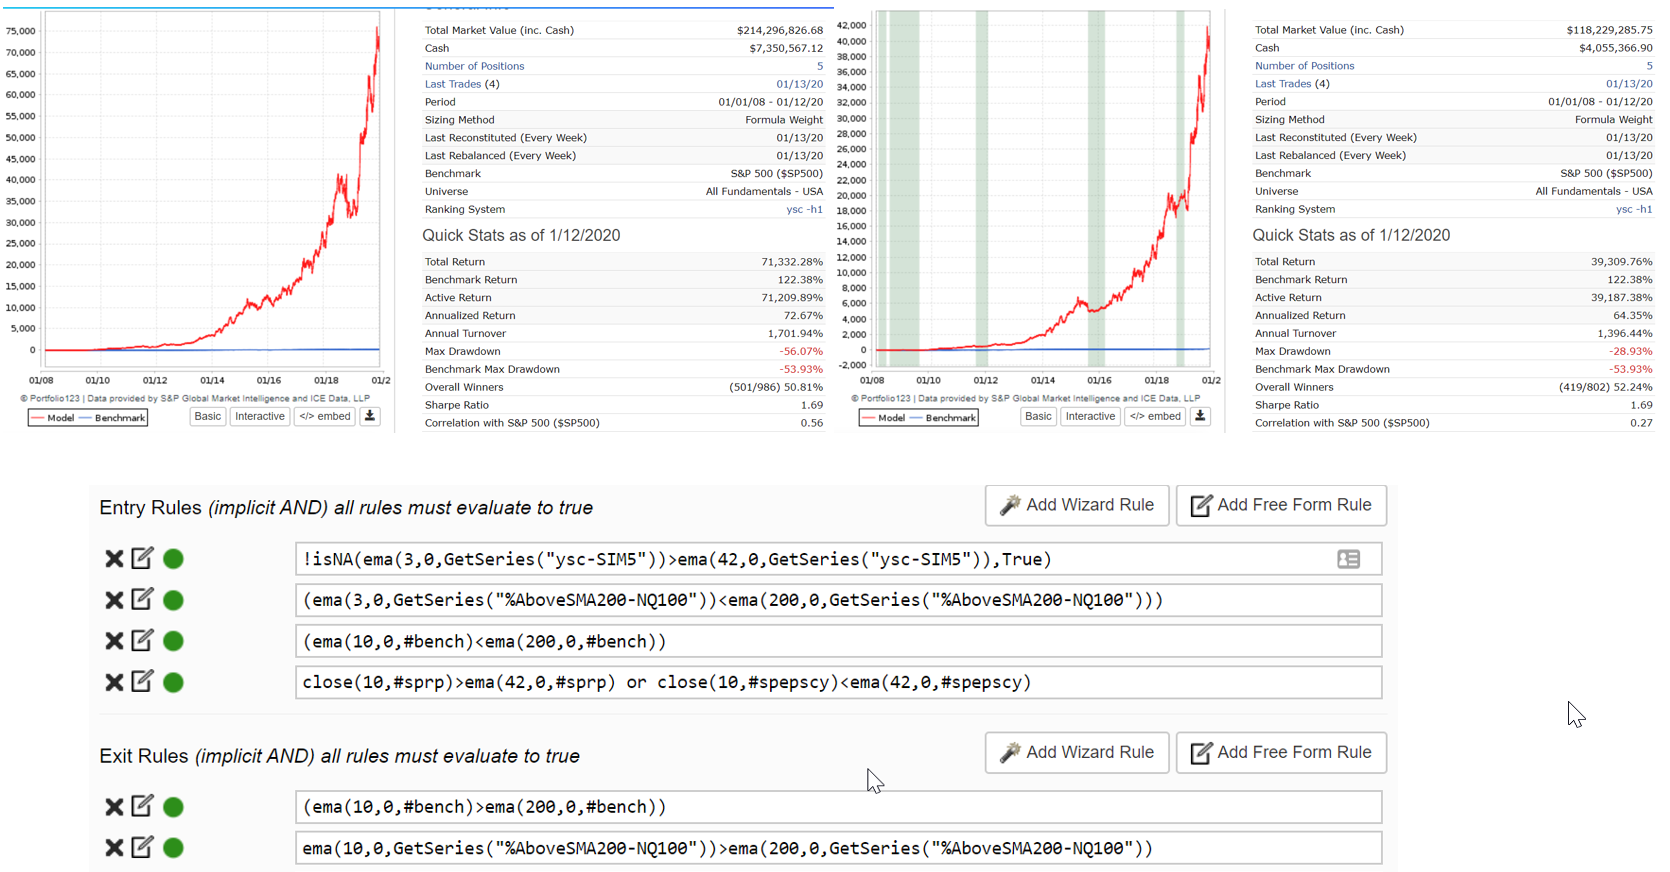
I tried not to do too much rule futzing here, but after a weekend of playing around with it, I convinced myself I needed rules based on benchmark performance, market breadth, macro conditions and the port’s own performance. I used 100% TLT as the hedge, but I will probably experiment with other forms of hedging.
Criticism welcome, don’t assume I know what I am doing.
Thanks P123 folks for the data series feature and the hedging module. These are the kind of things that make me embrace the whole platform more strongly.
Russ
No worries, found the error!
Just wanted to send kudos to the P123 staff for implementing these two new features. Though I’m still just scratching the surface on what we can accomplish with them, I’m excited about the possibilities.
Hi Georg and others:
I am still trying to get a hang of this. I was successfully able to make the file (the stock factor) aggregate series. How do i now input this to make this my universe for the SIM?
Please clarify