Factor Momentum

Georg,

Quality (QUAL) I guess. But I would not be getting rich quickly using only factor ETFs.

I actually share some of your skepticism. I also think you ask a geat question about factor ETFs and that you have an idea worth testing.

I just went to iShares site and found their factor ETFs: USMV, QUAL, VLUE AND MTUM.

With Portfolio Visualizer I backtested buying the ETF with the best relative strength over the last 3 months (buying at the next close with no slippage). And holding for a month.

Blue is the model with Portfolio Visualizer. Compared to equal weights and SPY. This model now holds QUAL

Excellent question and I am sure there are better ways to do this. First (and only) set of ETFs I tried after reading your post and I always use 3 months (for relative strength). Although 1 month did a little better in this instance.

To be clear, not a large effect, probably not statistically significant and no slippage (for ETFs traded monthly).

Georg, probably supports your point—at least regarding factor ETFs–if you think about it

Best,

Jim


Jim, use this 1-factor ranking system for those 4 ETFs from iShares. This shows growth of $100,000 to $346,000 from Jan-2-2014 to now. Sold MTUM on 3-1-2021 and bought VLUE. that’s about as good as it gets. Total return= 246% for 1 position model versus 164% for SPY. Annualized return= 18.2%. Easy to model on P123.

Ranking System: Avg(Close(0)/Close(63),Close(0)/Close(126),Close(0)/Close(252))

Buy rule: TICKER(“USMV,MTUM,QUAL,VLUE”)
Sell rule: 1stWeekofMonth

2 Likes

I have friends who have made similar arguments against factor investing. It can’t work, they say. How can you do better than Morgan Stanley, GS and the tens of thousands of big brains trying to beat the market unsuccessfully?

It’s like the old joke. An economist is walking down the street and sees a $100 bill on the floor. He doesn’t pick it up. Because it can’t be there. Someone else would have gotten it first.

Well, it’s a good question, but this stuff is working–at least for some of us.

There was clearly some factor momentum over the past twelve months, as high volatility, cheap value, and high PSR continued to outperform after the covid crash. And there was some factor momentum from the 2018 correction until the covid crash, with high quality large growth outperforming consistently. I actually predicted both periods in advance. At this point in the market cycle however, I expect the first bounce might be almost done. After that, the market will probably soon start to switch to a new set of factors (or type of stock) that it favors. This for me is the toughest part of the market cycle to predict which factors will start outperforming.

In general, how can you tell which factor is set to outperform? There are numerous indicators. Some are based on where you are in the market cycle. Some are based on factor mean reversion. Some are based on long term factor success. There are also valuation indicators, macroeconomic indicators etc. Some are more predictive and some are less predictive.

There is literature about this, for example, predicting momentum crashes.

But as always, the best way is to create hypothesis and set out to prove or disprove it. To make this kind of testing feasible I highly suggest that you think about allowing dynamic asset weights in books, and dynamic formula weights in ranking systems. I also don’t expect any system to be correct 100% of the time. We don’t need 100% accuracy. Did you know that if a ranking system misranks 99% of stocks, it can still earn 50% a year?

It’s a matter of back-testing to find the best indicators. But back-testing factors is very, very, hard using the current tools. Steve mentioned needing over a thousand custom formulas. That sounds about right. That’s one reason why I am advocating for rules in books. That should allow some simple factor switching. After that I would like to see dynamic asset ranking in books. Eventually I would like to see tools to chart correlations between various indicators and factor out-performance.

Some have reported no luck with dynamic factor weights. But some have reported double the excess returns. Who is right? They both are. It depends on which indicators you use to pick factors. But I have seen suggestions that in the right hands, factor switching can double the excess returns of a strategy.

1 Like

Georg, Thank you! -Jim

Thank you all for your answers. Good debate and great to see a diversity of opinions.

My original intention was to propose a way for each of us to check for ourselves whether factor momentum works or not.

Any feedback on my approach below? Particularly from those of you who are on the “it is real” camp?

Thank you

Jerome

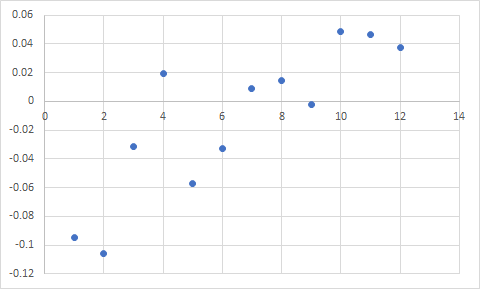
I think the most basic backtest should be to see if factor momentum even exists. To do that–and I’ve done it–you backtest 50 different strategies–some emphasizing value, some growth, some high volatility, some low volatility, some small caps, some large caps, etc.–over the past 22 years. Then you look at the correlation between returns over different periods. So, for example, I looked at the correlation between the returns of my 50 strategies over the nine months following a three-month gap (just to make sure I have new stocks) after 1 year, 2 years, 3 years, 4 years, 5 years, and so on. Here are my results, which reflect the average correlation measured on eight different starting dates. The X axis is the number of years looking back; the Y axis is the correlation with the returns of the nine-month out-of-sample period.

Of course, with correlations this low, there’s a lot of noise in the data. But the trend seems clear enough. You’re more likely to have factors work like they did in the past if you use a 10-year lookback period than a 1-year. If you use a 1-year period you’ll do better with a reversal than a continuation, since the correlation is quite negative. I’ve done this exercise with tons of different types of strategies, with tons of different OOS periods (I normally use 3 years instead of 9 months), over the last five years. The results are very consistent: anything less than eight or ten years has lower correlation.

Now, technically, using a 10-year lookback period is just as much “factor momentum” as a 1-year lookback period, and if so, I use factor momentum myself and strongly believe in it! It’s just the 12-month part that I find alarming.

All this presupposes that I’m understanding what is meant by “factor momentum.” But it might mean something entirely different, in which case all of this is entirely irrelevant. I have looked at all the papers that have been posted on this thread, but am no closer to really understanding what is meant by “factor momentum” than before.

By the way, our screens and simulations now allow you to use ten different ranking systems with the Rating and RatingPos commands. So backtesting a rotation strategy has never been easier. Not to say it couldn’t be even easier than that if we were to develop something along the lines you suggest, but choosing one out of ten ranking systems depending on certain conditions will give you a good sense of whether factor momentum (as I understand it) can work better than sticking with one ranking system. If your choice is purely portfolio-based, I suggest the following workaround: test 50 different portfolios with 50 different ranking systems, download the results into Excel, and choose the one with the best performance over the last X months for the next X months. That shouldn’t be too hard.

We have a ton of development work taking place over the next few months (which I’ll announce shortly). But after that, maybe we can look into rules-based books.

Lastly, our AI feature will be very adaptive and will change factor weights over time. It should be ready sometime this year.


correlation table.png

1 Like

This is a very interesting discussion. However, it is indeed going in two different directions. It seems to me that the majority view the definition of a factor as macro, i.e. value, sentiment, momentum, etc.

My work focuses on individual factors, 37 to be exact, things like p/s, eps growth, inst%own, p/e, yield, analyst estimate changes and so on.

It is fairly simple, however tedious, to determine which factors are working by using the performance buckets in ranker. Furthermore you can’t just select 10 factors you think are in momentum and then find the stocks with the highest composite rank.

The trick is once you find factors in momentum you must correlate them back to individual stocks. Not at all easy. Simply because yield is in favor it doesn’t mean you just buy stocks with high yield. You must mix the factors so as to blend them into the perfect stock. Having done that, you must then cook up a portfolio that once again blends the factors in favor.

After originating the portfolio you must regularly adjust positions to keep the port in correlation with the natural ebb and flow of the factors in momentum. I do this at the beginning of each month, others I know of prefer quarterly as most of the data is refreshed on a quarterly basis.

I mentioned above the books by Professor Haugen. “The inefficient stock market, what works on Wall Street” is a must read regarding factor momentum, but you should read “The New Finance” first. O’Shaughnessy’s “What works on Wall Street” is also of interest but over simplifies what it takes to truly uncover what’s working now.

I call my buy list the “Superstocks”. If you read Haugen you’ll understand why…

I’ll conclude by adding that factor momentum is just the beginning of my strategy. I also use a bit of MPT and rely heavily on a reward/risk component.

1 Like

Hmm. Let’s say that in recent months (or however long your lookback period is) high p/s stocks are really outperforming low p/s stocks. Do you change the direction of your ranking on that factor? Or do you simply change its weight to 0?

I programmed the 6-mo smoothed annualized growth rate of a stock or ETF as a custom formula.
I found the formula in a 1999 article published by Anirvan Banerji, the Chief Research Officer at ECRI: " The three Ps: simple tools for monitoring economic cycles - pronounced, pervasive and persistent economic indicators."

Using this growth rate (higher is better) in a one factor ranking system does provide fairly good results for factor ETFs.
I used the iShares ETFs USMV,MTUM,VLUE,QUAL which have an inception date of 4/16/2013. Since the growth formula has a lookback period of 52 weeks one can only start the backtest on 4/17/2014.

Total return was 239% versus 157% for SPY.

The model sold Value and bought Quality on 6/1/2021.


Yuval, I do none of this in the ranker. Its all coded into custom formula in screener. I have been begging for dynamic weighting in ranking systems for a decade. It would simplify my style in a huge way. Meanwhile I figured out how to do it in screener…

The factors are either outperforming, or they are not. Of the 37 I use, typically 8 - 11 of them are shown to be outperforming at each research cycle. Many are persistent, particularly those factors relating to earnings. So no I don’t flip it’s ranking, if one factor falls off, the portfolio is weighted more toward those factors that are working.

I score every non otc stock based on their mix of the factors in play. So for example if yield has momentum then the stocks are scored based on their place in the deciles of yield. Top decile high score, bottom decile low score. I do this for each factor passing the momentum test. Ultimately each stock is assigned a “Master Score”.

How do I determine which factors are working? I take my universe, and for each factor, a stock will fall into a decile for the factor. Each stock is assigned its 3 month percent return. I then average these returns for each decile. If the top decile average return for a factor is greater than the benchmark 3mo return, the factor passes.

To keep it simple, all factors that pass this test are assigned a weight based on the amount of return over the benchmark. Its heavier than that but you get the idea. And to answer the obvious question “Why not just use the ranker?”, this is impossible to do in ranking, rating, rating pos etc…

This is fascinating indeed. Here’s my follow-up question. If a factor’s BOTTOM decile outperforms the benchmark over the last three months, why don’t you switch its direction? Wouldn’t that be more sensible than leaving it out altogether?

Sometimes switching a factor’s direction makes sense. For example, I use net profit margin with lowest numbers best because it’s a great predictor of future earnings growth. And there are times when favoring high beta might be better than favoring low beta (at least in retrospect).

Here’s my next follow-up question. Doesn’t your strategy have enormous turnover if you’re using very different factors and factor weights every month?

Lastly, what brought you to the belief that factors that have outperformed over the last three months are more likely to outperform over the next month rather than reverting to the mean? Have you compared your approach with, say, favoring the factors that have performed well over the last ten years instead?

Yuval,

First, I probably do something more like you do—for now. So I am agnostic on what will work for most members.

But I have looked at what Steve is doing to some extent. He has found something that has worked out-of-sample so I defer to him on most of the answers for what actually works.

But it is pretty easy to test this. Like in this thread: Some Serious Mean-Reversion? . This particular time-period showed mean-reversion. There is always tension between trendng and mean-reversion. And I agree, a year usually shows mean-reversion.

I will say that for my tests 3 months tends to show a positive correlation (trending). And 3 months or 1 month is usually optimal for trending. With 3 months usually being best and with less volatility.

You can do it with the downloads from a sim using Excel, and check several different single factors (in the rank) in about 10 minutes .

Anyway, I think Steve is probably onto something with 3 months and it can be tested easily.

Jim

So, I just want to be clear that I am happy with P123 just the way it is.

Furthermore, I am thankful for Yuval, Marco and everyone at P123 for doing such good work on feature engineering: cleaning up the data, developing fallbacks, making it as PIT as possible, etc.

P123 has a lot of great tools. Full stop. That would include (but not limited to) rank performance, simulations, multiple downloads including the API etc.

Personally, I have been able to use P123’s data, P123’s tools and some outside machine learning methods of my own to develop some ports that are doing well out-of-sample. To be sure, I will want more data on my ports before I claim to have found the Holy Grail of investing.

In summary, thank you P123 and anyone reading this should make sure to sign up and develop their own methods to augment P123’s great tools (if they have not already).

But just an observation: Steve is using the beginnings of machine learning here. He is attaching a set of features (fundamentals over a 3 month period) to each stock and seeing how these affect his target (returns). I am impressed with what Steve has done.

For more about automating this type of thing you should email Steve Auger who is actively doing a lot with Python and Machine learning.

As for P123, if you do not want to see it develop any machine learning ideas, I think you will have to take that up with Marco. He seems to be committed to automating some of this; he uses the term AI.

I look forward to seeing what Marco has developed. But I am completely satisfied with what P123 is doing now.

I would be happy to share my experiences but Steve Auger is a professional programmer and has done machine learning professionally. He has some polished/professional methods. P123 will be providing some ADDITIONAL methods too: in addition to what they already provide.

Jim

Interesting question. I suppose it could be found that switching direction might be profitable, but that logic is counterintuitive to my work. The basic premise of my strategy is that “everybody screens”. So the presumption is that their screen will be for whatever the commonly understood best number would be, like low p/e or high yield. My 37 factors are also pretty much top line, commonly searched items.

As I’ve mentioned the factors do have persistence, so I’m not flipping the entire portfolio each cycle. I carry 18 - 22 stocks and historically rotate out 3 - 5 each month. Turnover tends to be about 150% annually. Of the 37 factors there is commonly between 6 and 11 that are in favor, and of those about half are already in the mix.

I also have a rule that forces me to not sell until at least 90 days after purchase. Unless of course some event happens. My strategy is a bit leading, so it can take a couple of months for the institutions to find my stocks.

Average return of the factor’s top decile stocks is the driver. So to be clear, I’m looking for 3 month outperformance of the factor to tell me what’s working. Then I want the one month factor return to be greater than the three month, this tells me money is flowing into a factor.

Early on my cut off was the factors’ three month vs one year return. This turned out to be a lagging indicator so I stuck with the shorter time frame.

As for ten year lookback my strategy is obviously momentum based, therefore ten years is of no interest. Not to say that ten years wouldn’t work, however if it did everyone would be using it and the factor would be too efficient.

2 Likes

Hello Andreas,

I am interrested to experiment with Factor Momentum. Can you share some of the techniques you used to implement Factor Momentum? You mentionned that you used it as Buy and Sell Rules? What does that look like (from a formula perspective)? Lets say one of your Factor is OpMgn%TTM. How would you impplement Factor Momentum?
Thank,

Hey Sraby,
Buy Rule: Rank > 90
Buy Rule: RankPrev(1) < 70

Also on Industry Group Momentum:
FRank(“Close(0)/Close(20)”,#industry,#DESC) > 90 (for example as a buy rule in a model

Best Regards
Andreas

1 Like

Timing equity factors - a good strategy or not? A very nice overview of factor timing research, including factor momentum.

I applied Markov process to calculate probability of style outperformance in which the probability of style outperformance depends only on the state attained in the previous event.
In other words the next (day) outperformer depends only on who was the previous (day) outperformer.

As my dataset I used five equity style ETFs from iShares(tickers as name of columns).
In the table below you can see daily returns of these ETFs.
Yesterday (last row) the best performer was the ETF based on SIZE factor ('state' column), 'priorstate' column has value VLUE meaning that it was the best performer a day before.


Probabilities of transition from one state to another are shown in the tables below.
For example, the bottom left corner 0.279221 means that if VLUE etf was the best performer yesterday then there is 27.9221% probability that the next day best performer is MTUM etf.

Max values for a row highlighted:
image


Min values for a row highlighted:
image


This is very basic research - more reliable approach would be to use longer period.... but I can provide some conclusions based on daily returns:

  • Momentum most often follows (as the winner) the other factors (momentum, size, lowvol, value but not quality).
  • The most momentum has Momentum factor (31.77%), the most reversal has Quality factor (12.98%).
  • Quality next day outperformance seems to be very random, (not connected to market regime ?)
  • The trade with the highest probability of success is to go long MTUM etf if MTUM etf is current winner (31.77%)
  • The best long-short trade for next day (1st April 2024) would be to go long momentum (29.8%) and short quality (13.5%).
3 Likes

Piotr,

I have my doubts on momentum on different factors but this is very interesting analysis.

Thank you for providing and sharing it with us.

Regards
James

Pitmaster,

How would you determine if your results are significant?

I thought a chi-squared test might do the trick as this is a classification problem (categorical variables). ANOVA more suitable for continuous variables.

The actual count is important for the chip-squared test and I did not have that. I am not sure how long each of those ETFs have been in existence. For simplicity I assume 10 years of data (the 2520 in the code is about 10 years of daily data).

Also, I assumed your probabilities reflect true proportions in some sense (theoretical or real) considering the frequentist nature of frequentist statistics.. I am sure I could think of other assumptions that went into this. MOST of them reasonable, I hope. In that regard, I am not sure if the assumption of independence of each ETFs returns on a give day is a major problem or not. Chi-square is a test for independence but not the type of independence I just mentioned, as you know.

This is more of a statistical exercise for me than any attempt to make any decisions (or judgements) about the ultimate usefulness of the strategy or the ultimate usefulness (or optimality) of these particular ETFs if one were to use this strategy. Also note, I probably would not have posted if the results were not significant. Highly significant (p-value < 0.0005). My results are in agreement with your post, I believe.

With these assumptions and with possible errors in my coding taken into account, I get that your results ARE highly significant. Or probably significant in this context—again, I might not have done it just right.

The code and results (expected frequencies cutoff in this screenshot):

1 Like