Super great concept:
Factor Momentum, super interesting!!! Factor Momentum → drives Price Momentum. I implemented Factor Momentum in my systems (some monts ago, and the results where spectacular (e.g. Backtest going from around 40% to up 62% in average and in the best systems over 75% (all with slippage + transaction costs!). Now I see this papers where they state the a certain factor momentum (Long Term Reversals, Size, International Value, Quality) trend (up and down) and this trend produces price (up and down) momentum…
Question: I was able to implement this factor momentum as buy and sell rules.
What would be really interesting, if we could rank stocks based on there factor momentum, e.g. based on there ROC they make within their ranking system…
I have used factor momentum as a core foundation to my strategy for over 20 years. I can tell you that it works very well.
I have about 35 factors I use, I settled on these after three years of testing. They have stood the test of time since 1997. Prior to P123 I did everything in Excel.
To give you a start, I have a ranking system with three composite nodes. The first calculates the percent change of each factor for one month, the second calcs the three month change. This is simply the percent change in value for each factor.
The factors inside these two composite nodes are given a weight of zero, or equal weight. The one month and three month parent composite nodes are given 1% weight.
The third composite node is (NodeRank(“1mo_Change”)-NodeRank(“3mo_Change”))/NodeRank(“3mo_Change”).
The third node is given 98% weight. This works for me but there may be other ways to go about this.
The trick is then what? Now you know what stocks have the highest factor momentum. But simply that a stock’s Inst%Owned went from 60 to 80 means nothing.
In my case I have developed a process which tells me which factors the market is currently rewarding. It was extremely complicated to develop on P123 (I crashed the servers a couple of times during development :). I spent years writing screens to do this, and wasn’t able to do it at all until variables were introduced. Not to mention my system uses about 1300 custom formulas to make it all come together. Once I finally put it all together it now takes about 30 seconds or so to run the screen on a 4500 stock universe.
The ranking system is just the starting point.
Bottom line, factor momentum works. Its been in use since the late 1980’s by various money managers.
Wow thank you sthorson for the encouragement and insights!
I am doing this for quite a while and it struck me that this is something money managers used for decades. Interesting also that
academics seem to be that late.
For me also interesting that they finally have an explanation how price momentum is caused. Factor momentum → price momentum.
I even got a theory now, how macro (rate of change of gdp and rate of change of inflation, Fed policy) is driving factor momentum.
E.g. Macro → influences Factors (e.g. which one are in favor) → Factor Momentum → Price Momentum.
So after 25 Years in the market, I think I have some insight on how this stuff is working, lol.
It might just be another theory, but its a (for me) a logic explanation framework, that helps me (unfortunatly I am one of those folks, who like
to know why).
Interesting also, that the macro services I use (Hedgeye and 42Macro) are using factor dispersion (e.g. what is in favour, what is not in favor) as confirming signal for their macro near casts and only if both are pointing in the same direction they put on the trades.
E.g. when ROC Inflation is up and GDP is up at the same time both value and growth are working at the same time etc.
So what now?
As outlined, I combine my ranking system with buy and sell orders that filter out stocks that have positive factor momentum and sell
stocks that have negative factor momentum…
I never had such good backtests and this beautifull captital curves and the first 4 Weeks of OOS and real time trading it, are very encouraging.
I use some factor momentum in my strategies, but have not really called it such. i.e. improvement of profitability over time etc. You’ve provided some great resources and ideas for further study.
The links to the literature on this are fantastic, lots to dig into!
I’m trying to get at the gist of this. If a factor has done well in the last month or so, it should get a higher weight than a factor that hasn’t? Is that what’s going on? Or am I missing something?
I don’t know about specific factor momentum, but if you have a broad all encompassing ranking system I often find that there is such a thing as “rank” momentum. For example, if a stock that is shoots up from an 84 on your rank to a 99 in a week, usually after a good earnings report, I generally find that’s a good time to get in because there is some good information there that probably hasn’t had time to disseminated completely through the market and you could have an informational advantage in that window before the market gets efficient. Particularly with a small or under analyzed company. So rather than just do a completely autonomous model where I’m just blindly taking the highest rankpos on a rebalance, I might take 20 or so of my the highest rated stocks in my ranking and see if any have had a huge spike in the ranking recently that would indicate recent unexpectedly good news. I tend to do this daily through a screen.
I’ve been skimming “A Reexamination of Factor Momentum: How Strong Is It?” by Fan et al. (ssrn 3844484). From the paper: “A factor momentum strategy is long recent top-performing factors and short poorly performing factors.”
So it’s not really the change in factor, but the recent performance of the factor that’s important.
From the conclusion: “Although the factor momentum trading strategy generates positive returns that are statistically significant, it does not outperform a simple strategy of longing these factors. From the perspective of market practitioners, factor momentum may not be an attractive trading strategy for investors who are seeking abnormal profits in financial markets.”
I’ve been testing adding a low-beta momentum node to my small cap model, Fan thinks that low beta has the most profitable factor momentum. I’m seeing some improvement, but I need to test more.
I researched factor momentum for 3 years back in the 1990’s. The book that sold me on the strategy is “The New Finance” by Robert Haugen. He followed up with a second book “The Inefficient Stock Market” which is also excellent. My work was fine tuned with this information.
They are both out of print but you may be able to find a copy online or possibly a PDF. Very much worth the read if you are passionate about factor rotation and momentum.
You have already shared a lot here and in previous posts.
If it is not giving too much away, is this the same method in which you use MPT (modern portfolio theory). Perhaps to determine the weight of the factors that are doing well, if it is part of this strategy?
I think what I do is entirely different but I rotate ETFs (made up of stocks with similar factors) using relative strength over a small number of months (similar time-frame to what Andreas uses) and use MPT to help determine the weights of the ETFs that are performing well. I think this offers general support for some of the ideas in this thread—assuming this actually works out-of-sample.
Anyway sounds like some good ideas that have merit to me: whether the general principle of what I do ends up being similar (in a few ways) to what you are doing or not.
I have always held my strategy very close to the vest on here because of the amount of work involved in it’s development. I was never looking to create a “home run” strategy, rather one that would outperform the S&P by 5% annually over time after fees and commissions. It has done far better than that.
As I get a little older I realize that I’m no longer competing with anyone but myself. So here is an excerpt from an old sales brochure that might help show a foundation of the nuts and bolts behind my strategy.
Factor Momentum: which factor is in favor → Yes, Darius Dale from 42 Macro and hedgeye use this to get a price confirmation in which macro regime we are.
I do NOT use this factor momentum in my trading systems (I let Darius do the work in this area), but I use pretty much all major factors
in my ranking system: value, momentum, industry momentum, quality, growth, size (or better low volumne!), as Yuval and also Non-Prophet Capital (see twitter) pointed out several times.
Factor Momentum: The stock jumping from let say Rank 70 to 90. From what I understood, this is the subject of the paper.
Give Ralph Sueppel a follow, very good picking of new and innovative papers:
To get this straight for myself, I think this thread is talking about two different types of momentum - Factor (price) momentum vs Factor change momentum.
Factor (price) momentum – based around autocorrelation, those factors most recently performing well should continue to do well, until a “momentum crash”. The papers noted in Andreas’ initial post talk about this type of momentum (as far as I can tell). There are differing opinions in the papers whether timing these factors is worth it long term, compared to simply buying and holding.
Factor Change momentum – how the individual value of a factor (not price) changes over time. i.e. is profitability suddenly improving? Or a sharp increase in EPS? Or take the aggregate rank of all factors in a strategy, how is the rank of an individual stock changing recently? Say your strategy requires stocks to have a rank of 90 or higher to be considered a buy. Does a sudden increase in rank, say from 60 to 90, result in a higher return compared to one that is rising from rank 85 to 90?
Or does factor change momentum drive factor price momentum? Quite possibly.
I have to say that I am struggling to understand the academic papers and in particular the basic steps of
how they construct factor portfolios and
how they actually observe that there is a ‘factor momentum’ effect.
Would any of you be able to translate academic parlance into something understandable?
I made an attempt below…
Here is an extract page 5 of Factor Momentum Everywhere.
I found that this is the clearest in explaining what they actually do. “We form factors as follows.
First, we cross-sectionally winsorize the top and bottom 1% of raw characteristic values each period.
Next, we split the universe into large and small stocks with a cutoff equal to median NYSE market capitalization (or 80th percentile of market capitalization for international stocks).
Within size bins, we divide further into low/medium/high characteristic values according to a 30/40/30 percentile split. Breakpoints are taken over NYSE stocks for the US sample or all stocks in the international sample.
Within these six bins, we form value-weighted portfolios, and then combine these into an ultimate long-short factor portfolio according to 0.5×(\Large High” + \Small High") {0.5×(\Large Low" + \Small Low"), re-constituting portfolios each month."
My problems start with the terminology e.g. “characteristic values”, “value-weighted portfolios”, etc.
I assume “characteristic values” are the factors we want to look at?
Here is my attempt at translating in plain English:
Sort your universe of stocks by your chosen factor e.g. Price to Book. Say Lower is better. This means that the top-ranked stocks are value / cheap stocks.
Manage the tails/outliers (winsorize). We all know that the data at extremes can be weird (N/A, zero values, infinite values etc). We now have a 2-column matrix with {column 1, column 2} = {stock name, Price to Book ratio with extreme top/bottom 1% values winzorised}
Not sure why they need to split out by size first. To me, this means that they know that the size factor trumps any other factor and unless you cast it aside, it will blurry the picture and the role of all other factors.
Take your 2-column matrix and split it into 3 subsets of rows (top 30%/ middle 40% / bottom 30%) i.e. (Value stocks, middle-of-the-pack, expensive stocks) in my example
What does “value-weighted portfolios” mean in practice?
In my example, and for the portfolio of ‘Value stocks’ i.e. the top 30% in step 4. I assume it means I weigh stocks in this portfolio by calculating for each stock the ratio of (PtoB of this stock / PtoB of the total portfolio)? Or is it the ratio (PtoB of this stock / PtoB of the total universe)?
Now that I have my value-weighted portfolios, I track the price difference over time of {my value portfolio - my expensive portfolio}. Every month, the composition and internal weighting of these portfolios will be updated. In other words, my value portfolio will keep holding top value stocks (with a heavier weight on the most value) while the expensive portfolio will keep holding expensive stocks.
Jerome, the whole factor exercise is a lot of nonsense in my opinion.
Look at the factor ETFs. One would think that there should be some rule which determines which factor should be doing best at any time. But there is nothing. This is just a marketing ploy so that the ETF providers can make more money.
Can anybody please tell me which factor ETF I should invest in now, and why?
If “factor momentum” means “invest using the strategy that has worked the best over the last 12 months” then the concept is not only counterintuitive but dangerous. Any study of mutual funds will show that strategies tend to mean revert over such a short period, and any backtest of a variety of different strategies using Portfolio123 will show the same. Would you advocate switching, in April 2021, to the strategy that worked the best over the previous 12 months? If so, you’d be committing your portfolio to buying the riskiest possible stocks. What if stocks with extremely high price-to-sales and extremely high volatility outperformed? That was the case in the twelve months ending April 1. But a long-term study of such a strategy would show that it would normally have been a disaster. And then, if you switch your factor directions and weights every month depending on what has worked for the twelve previous months, you’ll never hold onto a stock for more than a month. Is that what you want?
But maybe “factor momentum” means something different and I’m missing the point . . .
There definitely were times where I knew that a particular factor was going to outperform, or that it had been lagging and would probably continue to lag until the tide turned.
But I would be surprised if twelve months was the optimal lookback period.
Quality (QUAL) I guess. But I would not be getting rich quickly using only factor ETFs.
I actually share some of your skepticism. I also think you ask a geat question about factor ETFs and that you have an idea worth testing.
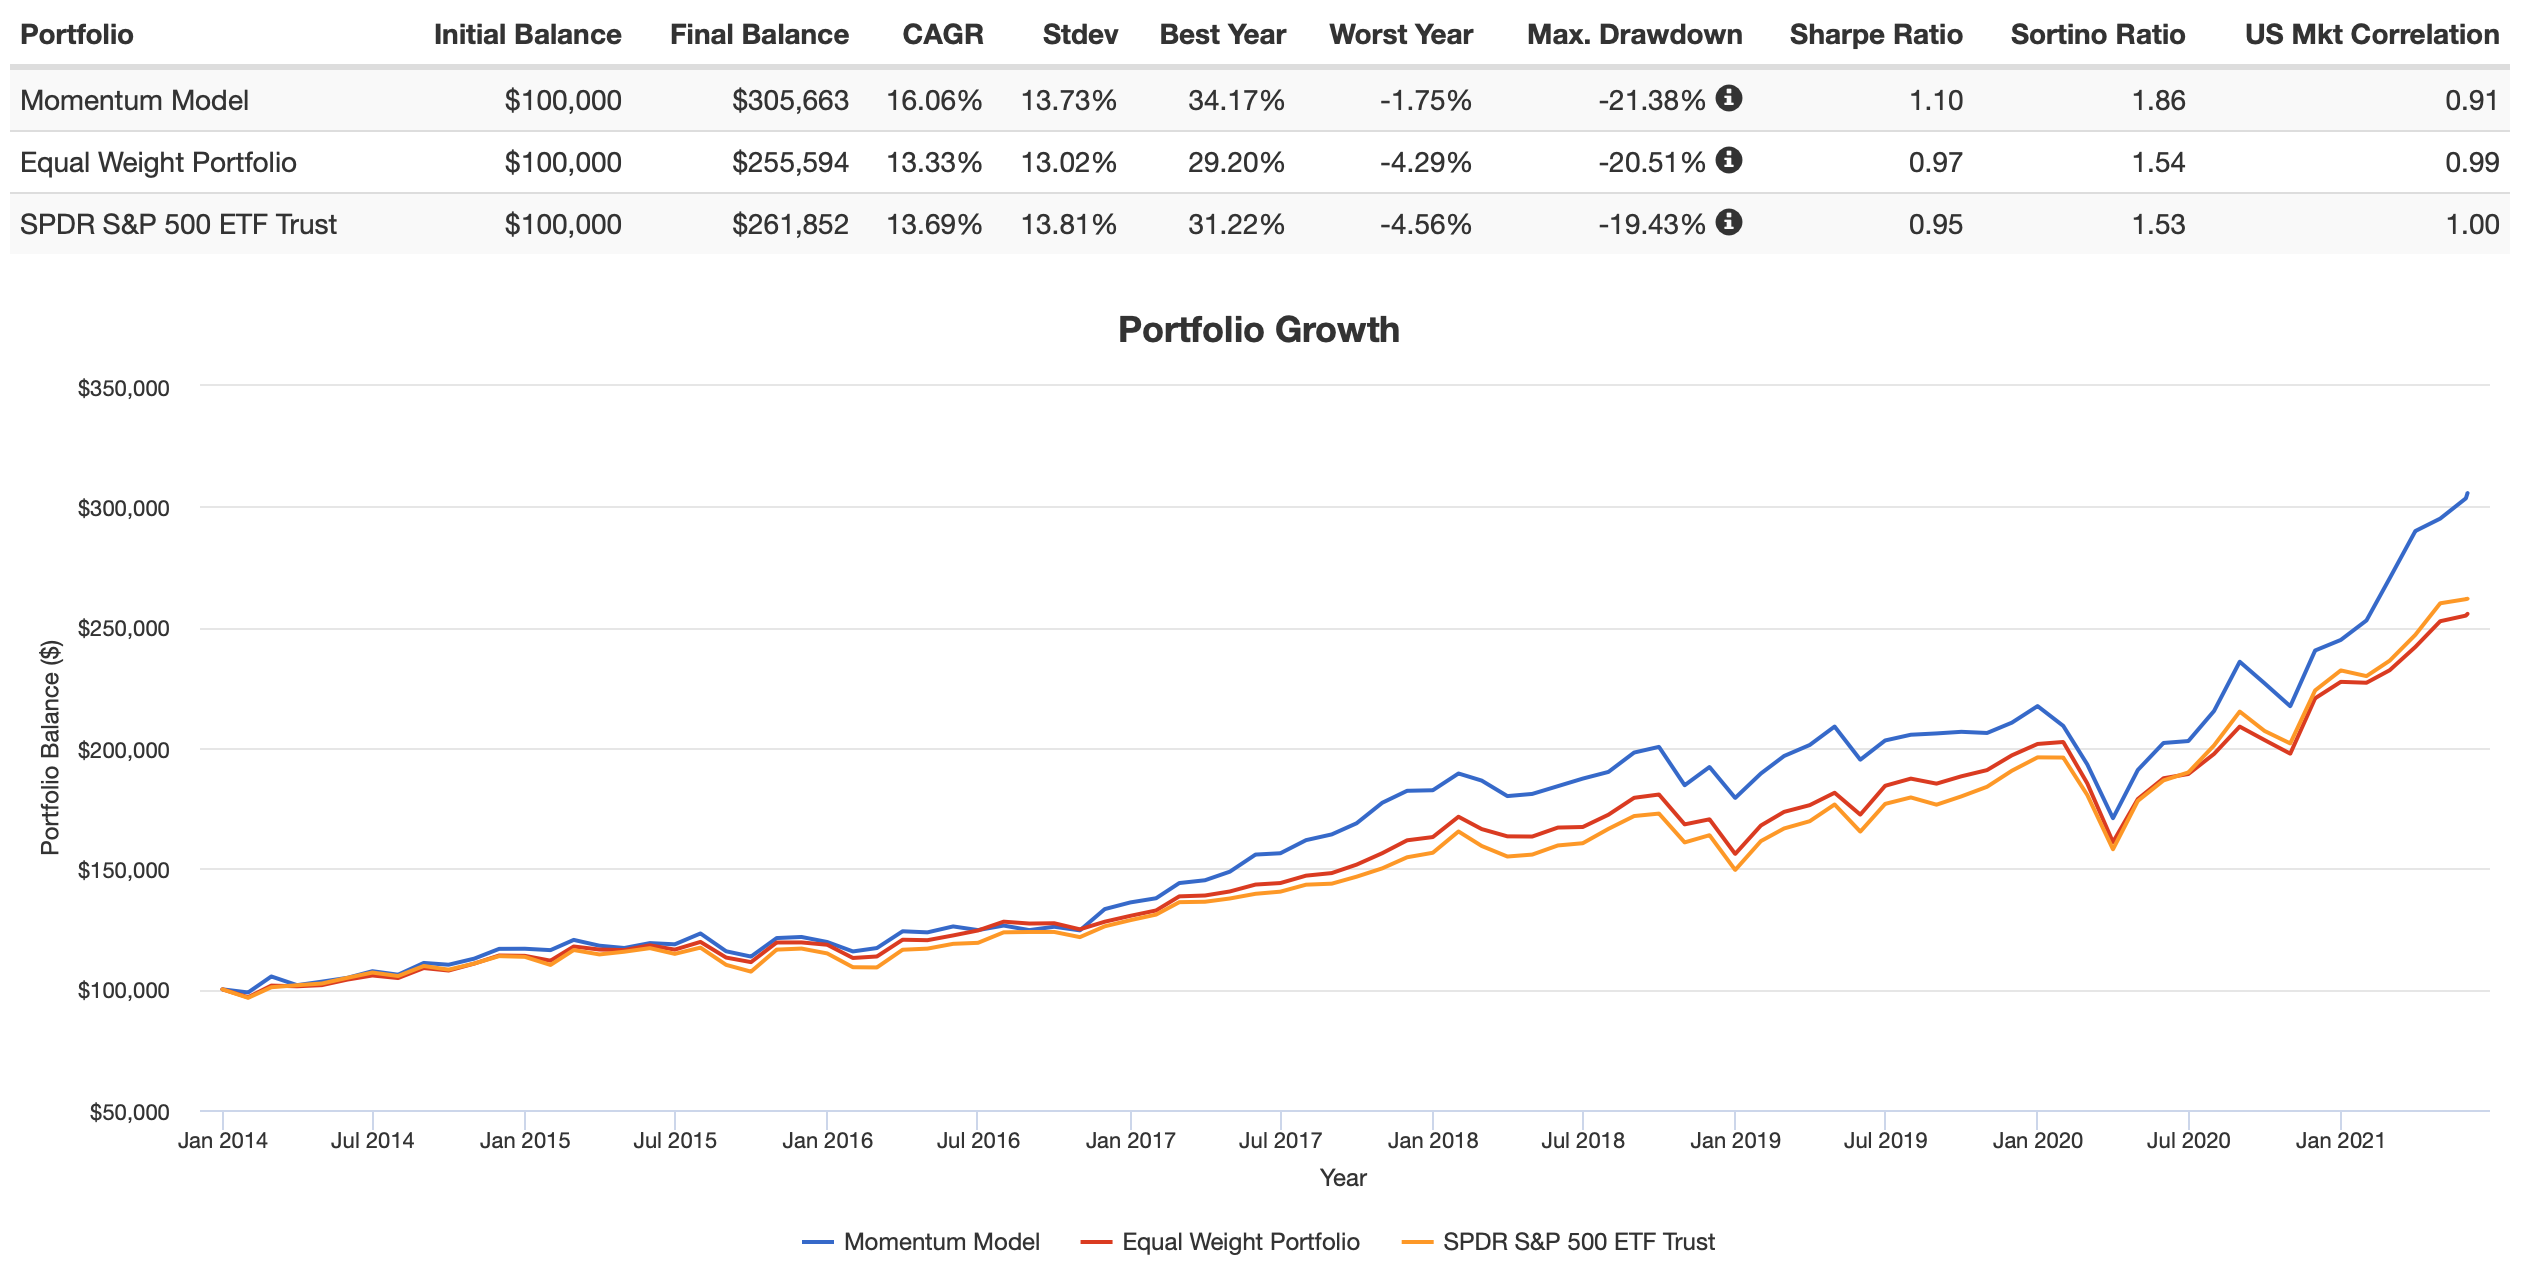
I just went to iShares site and found their factor ETFs: USMV, QUAL, VLUE AND MTUM.
With Portfolio Visualizer I backtested buying the ETF with the best relative strength over the last 3 months (buying at the next close with no slippage). And holding for a month.
Blue is the model with Portfolio Visualizer. Compared to equal weights and SPY. This model now holds QUAL
Excellent question and I am sure there are better ways to do this. First (and only) set of ETFs I tried after reading your post and I always use 3 months (for relative strength). Although 1 month did a little better in this instance.
To be clear, not a large effect, probably not statistically significant and no slippage (for ETFs traded monthly).
Georg, probably supports your point—at least regarding factor ETFs–if you think about it
Jim, use this 1-factor ranking system for those 4 ETFs from iShares. This shows growth of $100,000 to $346,000 from Jan-2-2014 to now. Sold MTUM on 3-1-2021 and bought VLUE. that’s about as good as it gets. Total return= 246% for 1 position model versus 164% for SPY. Annualized return= 18.2%. Easy to model on P123.
I have friends who have made similar arguments against factor investing. It can’t work, they say. How can you do better than Morgan Stanley, GS and the tens of thousands of big brains trying to beat the market unsuccessfully?
It’s like the old joke. An economist is walking down the street and sees a $100 bill on the floor. He doesn’t pick it up. Because it can’t be there. Someone else would have gotten it first.
Well, it’s a good question, but this stuff is working–at least for some of us.
There was clearly some factor momentum over the past twelve months, as high volatility, cheap value, and high PSR continued to outperform after the covid crash. And there was some factor momentum from the 2018 correction until the covid crash, with high quality large growth outperforming consistently. I actually predicted both periods in advance. At this point in the market cycle however, I expect the first bounce might be almost done. After that, the market will probably soon start to switch to a new set of factors (or type of stock) that it favors. This for me is the toughest part of the market cycle to predict which factors will start outperforming.
In general, how can you tell which factor is set to outperform? There are numerous indicators. Some are based on where you are in the market cycle. Some are based on factor mean reversion. Some are based on long term factor success. There are also valuation indicators, macroeconomic indicators etc. Some are more predictive and some are less predictive.
There is literature about this, for example, predicting momentum crashes.
But as always, the best way is to create hypothesis and set out to prove or disprove it. To make this kind of testing feasible I highly suggest that you think about allowing dynamic asset weights in books, and dynamic formula weights in ranking systems. I also don’t expect any system to be correct 100% of the time. We don’t need 100% accuracy. Did you know that if a ranking system misranks 99% of stocks, it can still earn 50% a year?
It’s a matter of back-testing to find the best indicators. But back-testing factors is very, very, hard using the current tools. Steve mentioned needing over a thousand custom formulas. That sounds about right. That’s one reason why I am advocating for rules in books. That should allow some simple factor switching. After that I would like to see dynamic asset ranking in books. Eventually I would like to see tools to chart correlations between various indicators and factor out-performance.
Some have reported no luck with dynamic factor weights. But some have reported double the excess returns. Who is right? They both are. It depends on which indicators you use to pick factors. But I have seen suggestions that in the right hands, factor switching can double the excess returns of a strategy.