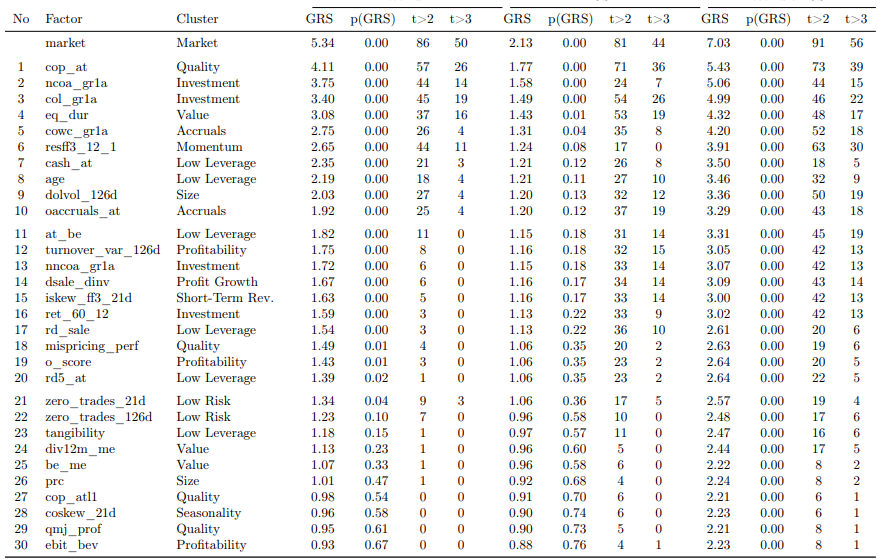
“Using a comprehensive set of 153 U.S. equity factors, we find that a set of 10 to 20
factors spans the entire factor zoo, depending on the selected statistical significance level.
This implies that most candidate factors are redundant but also that academic factor models, which typically contain just three to six factors, are too narrowly defined. When repeating
the factor selection to factors as they become available over an expanding window, we find
that newly published factors sometimes supersede older factor definitions, emphasizing the
relevance of continuous factor innovation based on new insights or newly available data.
However, the identified factor style clusters are quite persistent, emphasizing the relevance
of diversification across factor styles.
Furthermore, we document that using equal-weighted factors as opposed to capped valueweighted factors requires more than 30 factors to span the factor zoo, indicating that equalweighted factors exhibit stronger and more diverse alphas. Finally, applying our factor
selection strategy to a set of global factors results in a similar set of selected factors”
Anyone with some understanding of the research paper that wants to create an equal weighted 30 factor system?
1 Like
Would make a nice project for p123 for addition to their Live Strategy section.
Yes, that would be great! This is way over my head to create, so my hope is that someone will try to make a RS with the 30 factors.
I started with the system here: https://www.portfolio123.com/app/ranking-system/426451
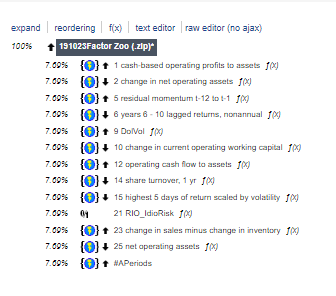
Its some cut and paste from other system. A lot is from Yuval Taylor - Factor Zoo.
The number of the factor in the RS, is taken from the list under. (Not “APeriods” (Firm Age).
I will try to add more, but probably need help with most of them.
| No |
Factor |
Description |
Cluster |
|
RMRF |
Excess market return |
Market |
| 1 |
cop_at |
Cash-based operating profits-to-book assets |
Quality |
| 2 |
noa_gr1a |
Change in net operating assets |
Investment |
| 3 |
saleq_gr1 |
Sales growth (1 quarter) |
Investment |
| 4 |
ival_me |
Intrinsic value-to-market |
Value |
| 5 |
resff3_12_1 |
Residual momentum t-12 to t-1 |
Momentum |
| 6 |
seas_6_10an |
Years 6-10 lagged returns, annual |
Seasonality |
| 7 |
debt_me |
Debt-to-market |
Value |
| 8 |
seas_6_10na |
Years 6-10 lagged returns, nonannual |
Low Risk |
| 9 |
zero_trades_252d |
Number of zero trades (12M) |
Low Risk |
| 10 |
cowc_gr1a |
Change in current operating working capital |
Accruals |
| 11 |
nncoa_gr1a |
Change in net noncurrent operating assets |
Investment |
| 12 |
ocf_me |
Operating cash flow-to-market |
Value |
| 13 |
zero_trades_21d |
Number of zero trades (1M) |
Low Risk |
| 14 |
turnover_126d |
Share turnover |
Low Risk |
| 15 |
rmax5_rvol_21d |
Highest 5 days of return scaled by volatility |
Short-Term Rev. |
| 16 |
seas_11_15na |
Years 11-15 lagged returns, nonannual |
Seasonality |
| 17 |
o_score |
Ohlson O-score |
Profitability |
| 18 |
niq_at |
Quarterly return on assets |
Quality |
| 19 |
seas_16_20an |
Years 16-20 lagged returns, annual |
Seasonality |
| 20 |
ni_ar1 |
Earnings persistence |
Debt Issuance |
| 21 |
ivol_ff3_21d |
Idiosyncratic volatility FF 3-factor model |
Low Risk |
| 22 |
ni_me |
Earnings-to-price |
Value |
| 23 |
dsale_dinv |
Change sales minus change inventory |
Profit Growth |
| 24 |
ni_be |
Return on equity |
Profitability |
| 25 |
noa_at |
Net operating assets |
Debt Issuance |
| 26 |
age |
Firm age |
Low Leverage |
| 27 |
ret_12_1 |
Price momentum t-12 to t-1 |
Momentum |
| 28 |
aliq_mat |
Liquidity of market assets |
Low Leverage |
| 29 |
nfna_gr1a |
Change in net financial assets |
Debt Issuance |
| 30 |
at_me |
Assets-to-market |
Value |
Isn’t this academic curve-fitting at its worst? The lagged-returns factors are clearly correlated (despite one of them not being in the “Seasonality” category), using the debt-to-market factor would mean you’d increase your position every time a company’s debt increased, and the intrinsic value measure here is a million miles from what investors actually use. These guys aren’t looking at the factors themselves to figure out what might go with what and what would work in the real world, but are doing a crazy number of multiple linear regressions, which is a much worse way to figure anything out than using combined ranking. If I were teaching finance (God forbid), I’d give this paper a C.