FactorMiner is live! Faster factor discovery for alpha research and AI feature engineering

I had a glitch when trying to run it: “Analysis failed: expected non-empty vector for x”

Factor list: “Test2”; 2567

2026-05-06 14:04:51,964 [INFO] Analyzing factors...
2026-05-06 14:04:52,000 [INFO] Workers launched: 16
2026-05-06 14:04:57,166 [ERROR] EXCEPTION: expected non-empty vector for x

concurrent.futures.process._RemoteTraceback:
"""
Traceback (most recent call last):
File "/usr/local/lib/python3.14/concurrent/futures/process.py", line 254, in _process_worker
r = call_item.fn(*call_item.args, **call_item.kwargs)
File "/app/src/core/calculations/factor_analysis.py", line 174, in _process_factor
factor_metrics = calculate_factor_metric(aligned_returns[valid], benchmark_returns_valid, worker_ctx.periods_per_year)
File "/app/src/core/calculations/utils.py", line 34, in calculate_factor_metric
beta, alpha = np.polyfit(x, y, deg=1)
~~~~~~~~~~^^^^^^^^^^^^^
File "/usr/local/lib/python3.14/site-packages/numpy/lib/_polynomial_impl.py", line 645, in polyfit
raise TypeError("expected non-empty vector for x")
TypeError: expected non-empty vector for x
"""

The above exception was the direct cause of the following exception:

Traceback (most recent call last):
File "/app/src/workers/worker.py", line 208, in main
results = run_analysis(
update,
...<3 lines>...
DatasetDetails(fl_id=fl_id, user_uid=user_uid),
)
File "/app/src/workers/worker.py", line 123, in run_analysis
factor_stats = analyze_factors(
core_df,
...<5 lines>...
on_progress=lambda completed, total: update({"progress": AnalysisProgress(completed=completed, total=total)}),
)
File "/app/src/core/calculations/factor_analysis.py", line 224, in analyze_factors
res = f.result()
File "/usr/local/lib/python3.14/concurrent/futures/_base.py", line 443, in result
return self.__get_result()
~~~~~~~~~~~~~~~~~^^
File "/usr/local/lib/python3.14/concurrent/futures/_base.py", line 395, in __get_result
raise self._exception
TypeError: expected non-empty vector for x

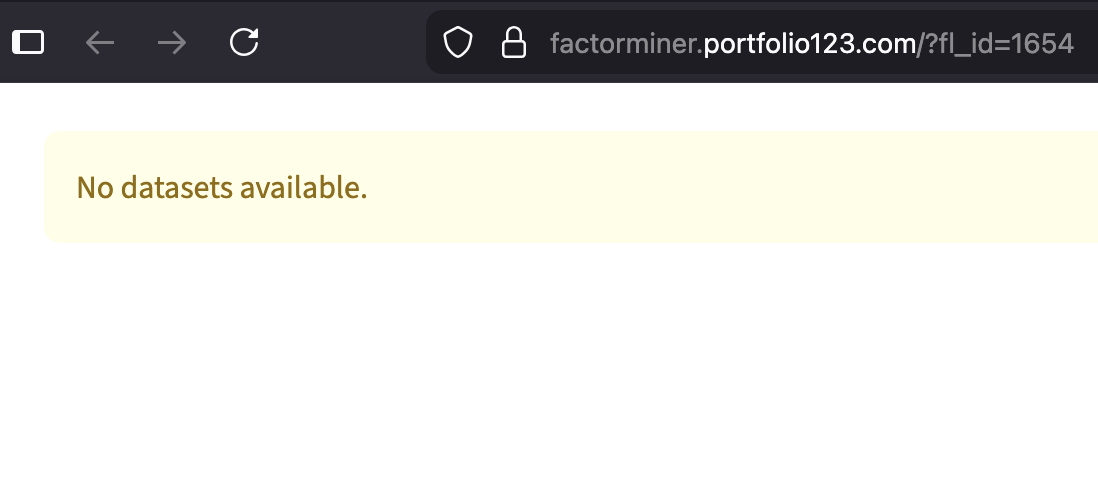
Received this error message :frowning:

@Trebz It's been resolved now!

I am also getting Analysis failed: No valid rebalancing dates found error.

https://factorminer.portfolio123.com/results?fl_id=2963&id=analysis_7

**Resolved now, thanks Walter.

Ran a factorminer with Dow Jones as the universe. Is there just not enough data? Hmm.

Error:

Analysis failed: expected non-empty vector for x

https://factorminer.portfolio123.com/results?fl_id=3000&id=analysis_1

Investigating thanks. The error message definitely could be better.

One of the factors is returning mostly NAs across the historical cross-section, which triggers the "Analysis failed: expected non-empty vector for x" error. Please review your factors for NA generation.

We're aware this error message isn't very descriptive and a more informative one is in the works.

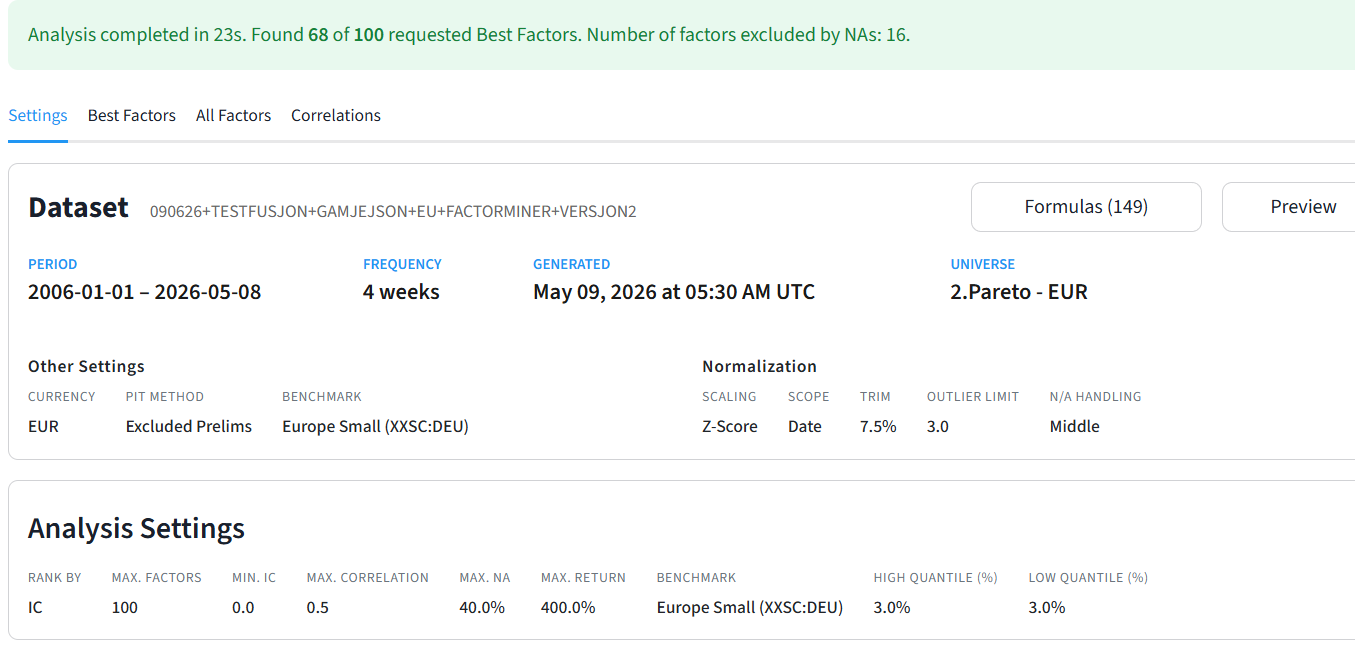
Everything should work better now. The main culprit was if you have factors that have all NA’s in the past. The period start date is advanced to where all factors have some values. This made some things not align properly. We added several other enhancements to the UI to surface issues with NAs.

Let us know

Thanks

1 Like

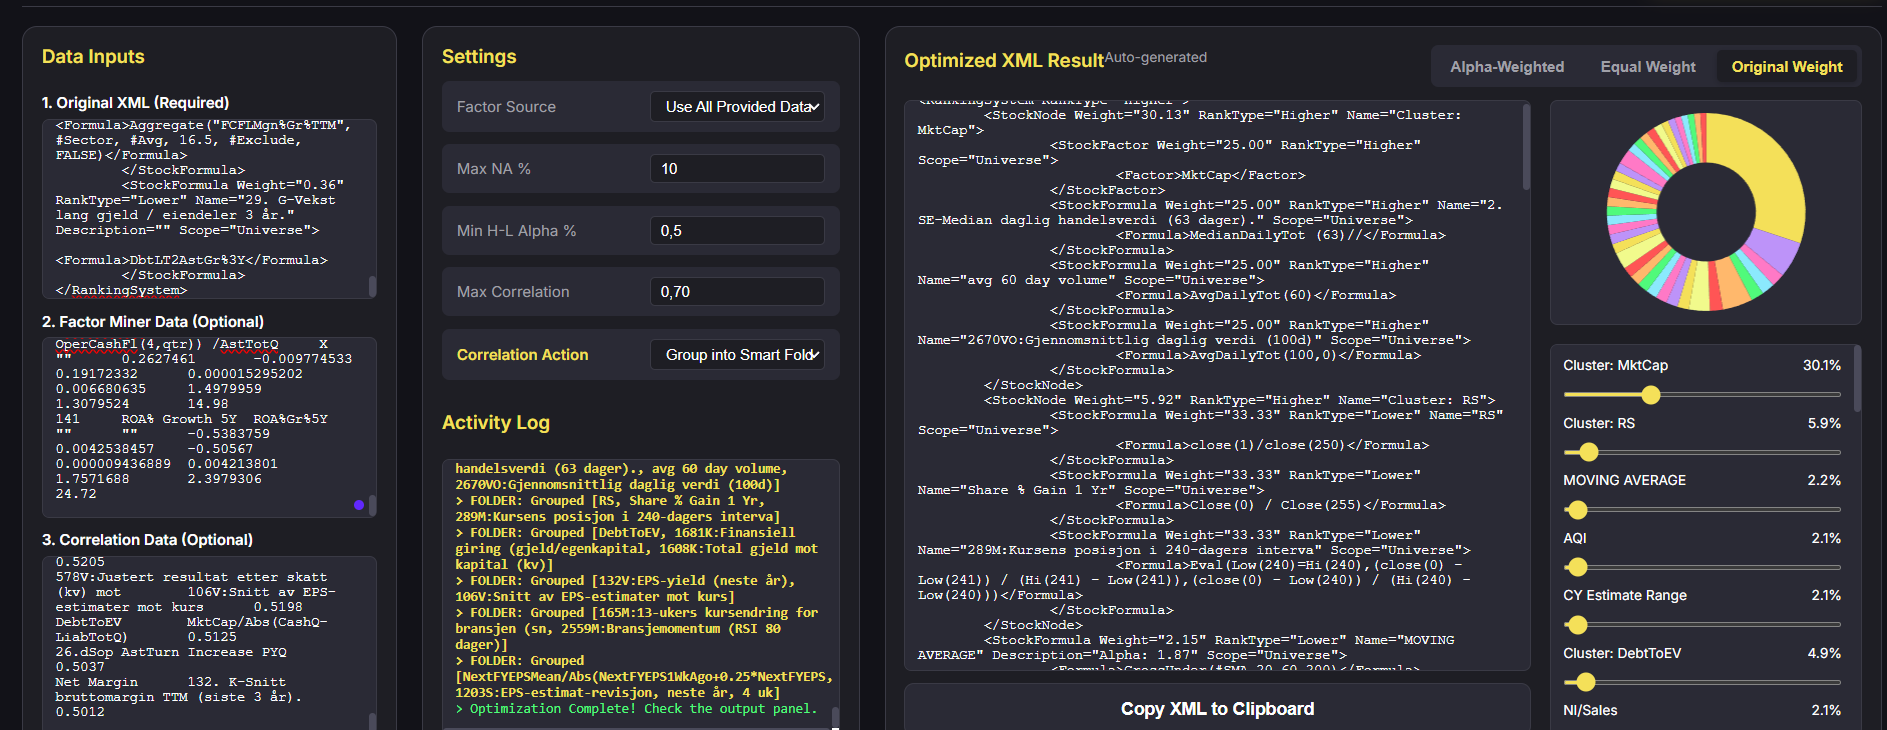
I believe solutions like this are excellent, and I hope P123 and its members continue to improve it. I have started working on a dashboard to facilitate the transition from raw data output to ranking systems. I aim for simpler ways to modify ranking compositions, merge highly correlated factors, remove factors with low Alpha, etc.

This is just a preliminary test version; please feel free to suggest improvements. If you prefer not to use my solution, it's just as easy to run it offline for those who wish to do so. Just download the HTML

Here is a , step-by-step guide on how to use the P123 XML Optimizer:

1. Paste Your Data (Left Column)

  • Box 1 (XML): Paste your original Portfolio123 ranking system XML code.
  • Box 2 (Factor Miner): Paste your TSV (tab-separated) table containing the H-L Alpha and NA% statistics.
  • Box 3 (Correlation): Paste your TSV table showing factor correlations.

2. Configure Your Rules (Middle Column)

  • Set your limits for Max NA% (factors with higher missing data are removed) and Min Alpha (underperforming factors are removed).
  • Set your Max Correlation threshold (e.g., 0.70).
  • Choose your Correlation Action:
    • Group into Smart Folder: Groups highly correlated factors into a single sub-folder (<StockNode>) to maintain diversification.
    • Fuse: Deletes the weaker correlated factors and transfers their weights to the strongest one.
    • Remove Weaker: Deletes weaker correlated factors without transferring weight.

3. Run and Select a Strategy

  • Click Run Optimization.
  • In the right column, choose one of the three suggested XML outputs using the top buttons:
    • Alpha-Weighted: Distributes weight based on each factor's performance.
    • Equal Weight: Gives all surviving factors the same weight.
    • Original Weight: Maintains your initial weights (and includes fused weights if applicable).

4. Fine-Tune and Export

  • Adjust Sliders: If you want to make manual adjustments, drag the sliders in the right panel. The donut chart and the XML code will update automatically to maintain a 100% total weight.
  • Copy: Click Copy XML to Clipboard and paste the optimized code back into Portfolio123.
1 Like

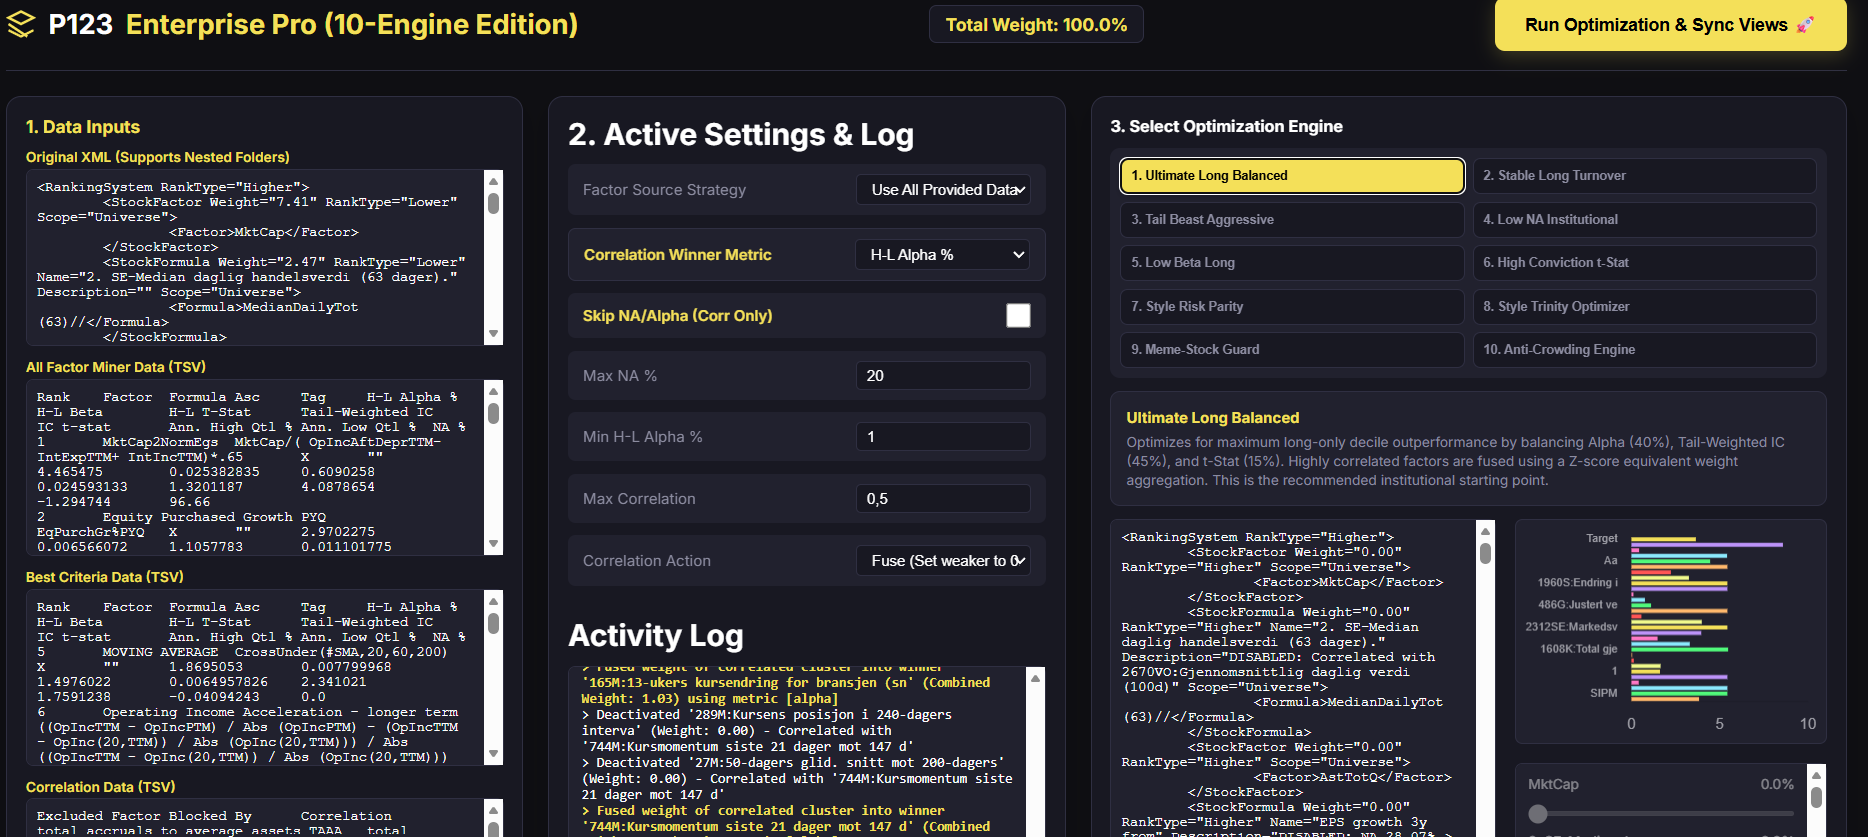
VERSION 2.0


  1. Recursive XML Parsing: Parses nested groups, preserving the P123 folder hierarchy and weighting structures rather than flattening.

  2. 10 Long-Only Engines: Adds 10 MPT presets (Balanced, Stable, etc.) that adjust parameters and calculate optimal fitness scores dynamically.

  3. Smart Direction: Auto-detects negative IC, reversing factor direction to Lower (Ascending) and using abs(IC) instead of discarding.

  4. Multi-Metric Mapping: Extracts Alpha, Beta, t-Stat, Tail-Weighted IC, and Top-Decile Returns to build advanced long-only fitness scores.

  5. Weight Renormalization: Interactive sliders auto-balance adjacent active weights, ensuring total weights always sum to exactly 100.0%.

  6. Zero-Weight Deactivation: Retains all original factors in the XML; disabled or filtered factors are set to 0.00 weight for easy audit.

  7. Adaptive Charts: Automatically switches from a doughnut chart to a horizontal bar chart when active factors exceed 8, preventing clutter.

  8. Dynamic Column Mapping: Scans TSV headers dynamically to map inputs, eliminating crashes from column order changes in P123 exports.

  9. Name Normalization: Strips casing, quotes, and whitespace to match Norwegian custom formula names with English Factor Miner datasets.

  10. Session Auto-Save: Saves inputs and settings to browser localStorage on the fly, instantly restoring your workspace on page refresh.


Quick Start Guide

This app optimizes your Portfolio123 Ranking Systems by merging your original XML structure with statistical data (TSV) from the Factor Miner.

Step 1: Input Your Data (Column 1)

Copy and paste your data into the four boxes on the left.

  1. Original XML: Paste the raw XML code of your ranking system directly from Portfolio123.

  2. All Factor Miner Data (TSV): Copy your full factor performance table (from Excel/P123) and paste it here.

  3. Best Criteria Data (TSV): Paste your filtered "Best Factors" table here. (Note: This is mandatory if you plan to use Engine #11).

  4. Correlation Data (TSV): Paste your factor correlation matrix here.

Note: TSV means "Tab-Separated Values". You can simply highlight the cells in Excel/Google Sheets, press Ctrl+C, and paste them into the boxes.

Step 2: Select an Optimization Engine (Column 3)

On the right side, choose one of the 16 optimization engines.

  • Engines 1-10: Uses advanced mathematical scoring (combining Alpha, IC, t-Stat, and Turnover) to intelligently weight your factors.

  • Engines 11-16: "Pure" engines that strictly sort, filter, or build based on exact metrics without blending formulas.

Step 3: Adjust Settings (Column 2 - Optional)

When you click an Engine, the settings in the middle column automatically update to recommended values. You can manually tweak them:

  • Max Factor Weight %: Prevents any single factor from dominating the system.

  • Min Active Criteria: The "Guardrail". If your strict filters (Alpha/NA) kill too many factors, the engine will automatically relax the rules to ensure you keep at least this many active factors.

  • Correlation Action: Choose whether to Fuse (combine the weight of correlated factors into the strongest one) or Remove the weaker ones.

Step 4: Run the Engine

Click the big yellow "Run Optimization & Sync Views :rocket:" button at the top right.

  • Check the Activity Log in the middle to see exactly which factors were removed, kept, or fused together.

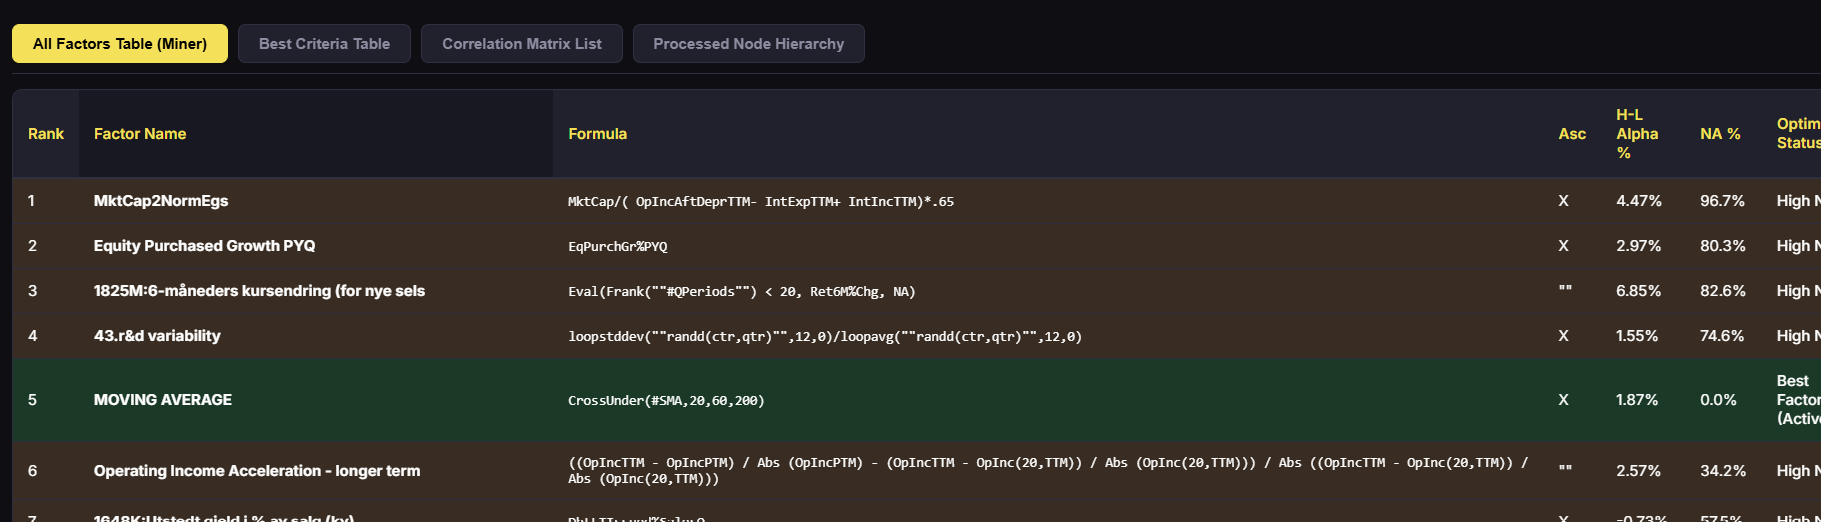
Step 5: Review the Results (Bottom Tabs)

Scroll down to the bottom section. Click the tabs to inspect the exact decisions the engine made:

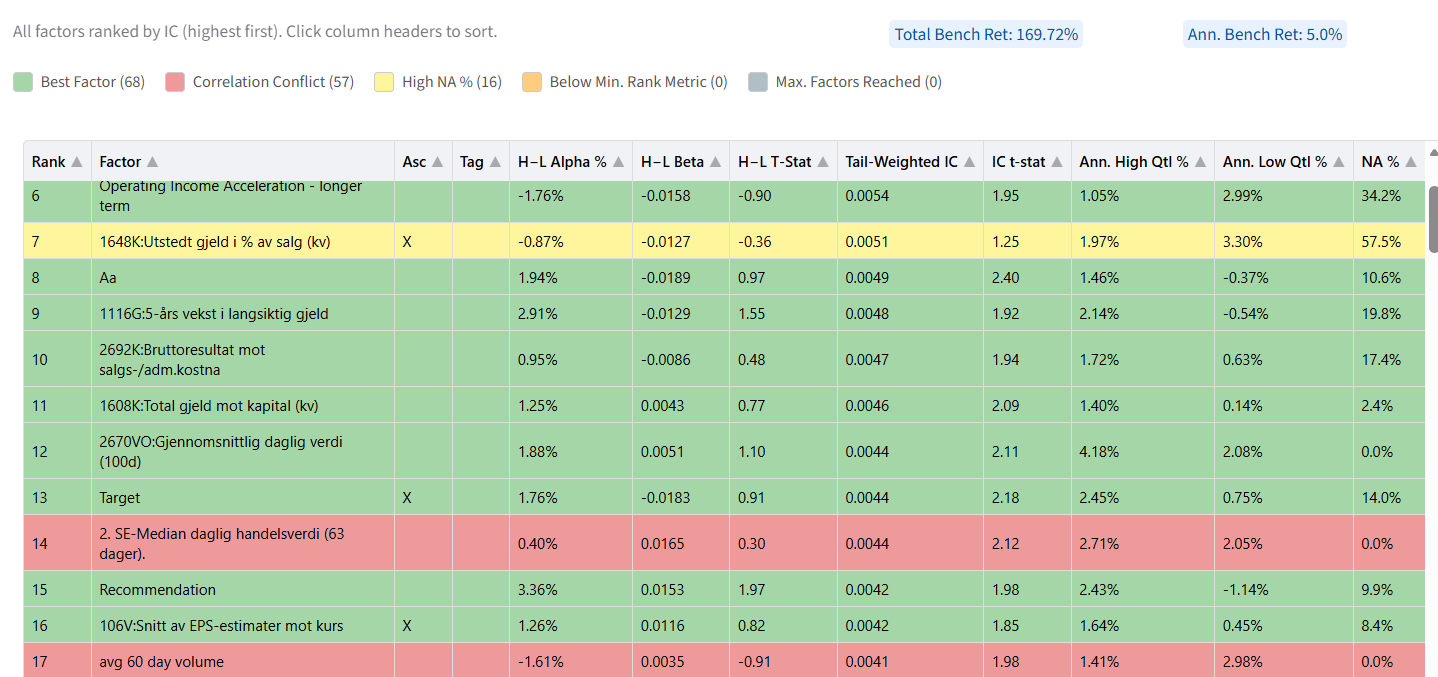
  • All Factors Table: Highlights which factors are active (Green), removed due to filters (Orange), or removed due to correlation conflicts (Red).

  • Correlation Matrix List: Shows exactly which factors blocked each other.

  • Processed Node Hierarchy: Shows your new XML structure with the new weights.

Step 6: Manual Tweaks & Export

  1. Sliders: Next to the chart on the right, you will see sliders for all active factors. If you manually move a slider, the app will automatically re-balance all other factors so the total stays at exactly 100%.

  2. Export: Click the "Copy XML to Clipboard" button below the code box. Paste this directly back into Portfolio123 as a new Ranking System.


Pro Tip: Your inputs and settings are auto-saved to your browser. If you accidentally close the tab, just reopen it and your data will still be there.

1 Like

I have two questions:

  1. How does Factor resolve correlation conflicts when two factors are highly correlated and need to be incorporated into "Best Factor"? Does it remove both highly correlated factors, or does it retain one of them, and if so, which one – the one with the highest weight or IC?

  1. I only run long portfolios, but which settings do you recommend?