Using Factset data, how would I look at EPS estimate for the next twelve months going back in time, like what it was 13 weeks ago? I tried this formula but the results are sporadic: ConsEstMean(#EPSNTM,0,13)
Thanks
Using Factset data, how would I look at EPS estimate for the next twelve months going back in time, like what it was 13 weeks ago? I tried this formula but the results are sporadic: ConsEstMean(#EPSNTM,0,13)
Thanks
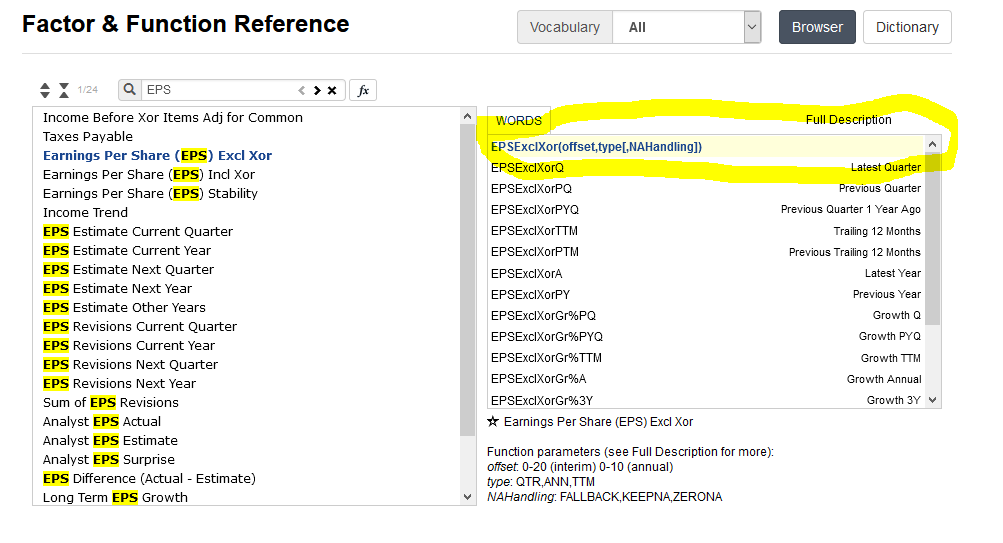
For comparing to historical analyst estimates use EPSActual() or the HistQ1EPSActual series that are different ways of calling the same thing
https://www.portfolio123.com/doc/doc_detail.jsp?factor=EPSActual&popUpFullDesc=1
also note from the link: “HistQ1EPSActual is equivalent to EPSActual(0,QTR)”
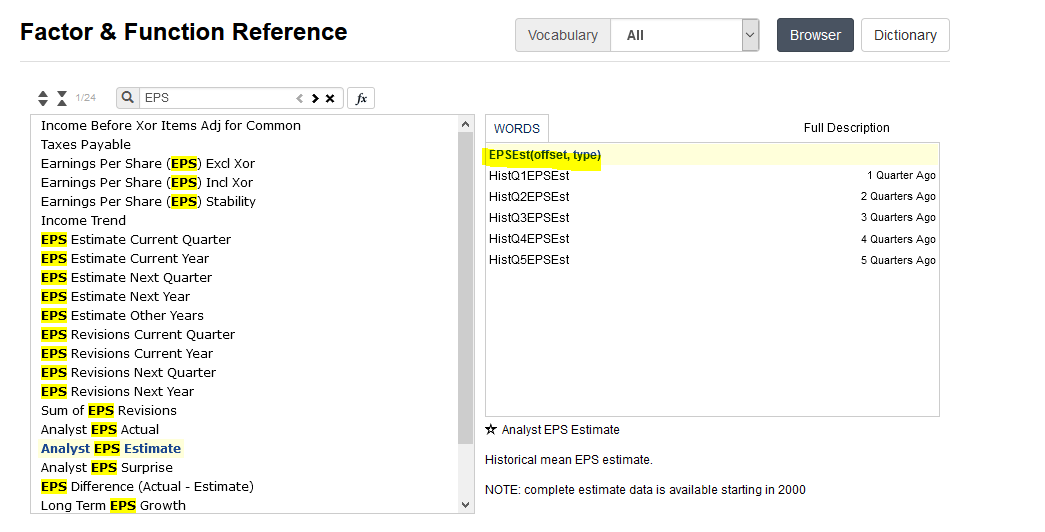
The historical analyst estimate is found in the EPSEst()
https://www.portfolio123.com/doc/doc_index.jsp?vocabType=&cids=&what=E&sortBy=sname
You can use EPSSurprise() for the difference between the reported and prior analyst estimates
https://www.portfolio123.com/doc/doc_detail.jsp?factor=EPSSurprise&popUpFullDesc=1
I always have trouble keeping them straight and have to take care to make sure I don’t misuse/misreference them.
I’m not sure exactly why, but ConsEstMean(#EPSNTM,0,13) is indeed returning very few values. I think it’s because thirteen weeks ago, NTM was entirely different than it is now for most companies. After all, ConsEstMean(#EPSNTM,0,1) returns plenty of values.
You might want to use FHist(“ConsEstMean(#EPSNTM,0)”,13) to get what you’re looking for.
Thanks, that looks like it works
BattleFutures, I think I misread and misinterpreted your question. Apologies.