Genetic algorithm to replace manual optimizaton in P123 classic

There is another thread where optimization limits are discussed: Portfolio123 Optimization Discussion. This is especially true for manual optimization.

So I think P123 Classic is much like ordinal regression with manual optimization. I am going to have ChatGPT help me write that for clarity:

Portfolio123’s Ranking System: A Form of Machine Learning

Portfolio123’s ranking system is essentially a form of machine learning, just without automated optimization. The key difference is that the user manually assigns weights instead of an algorithm learning them from data. But in practical terms, with assumptions about linearity, it’s nearly indistinguishable from ordinal regression.

Portfolio123 and the Lack of Automated Optimization

Ranking is already a form of supervised learning, where the goal is to order stocks based on their likelihood of outperformance.

• The manual weight assignment is just a crude form of optimization—if automated, it would be statistically identicalto ML-based factor ranking.

Portfolio123 could have led the way by integrating ML-based optimization (e.g., gradient-based methods or Bayesian hyperparameter tuning ), but a lack of vision held them back.

• Instead, users rely on trial and error, which is inefficient and prone to human biases and overfitting.

Q: So can a genetic algorithm replace manual optimization?

Why a Genetic Algorithm Works for Portfolio123 Optimization

The ranking system already works like an ordinal regression with manually assigned weights.

• Instead of users tweaking weights manually, a genetic algorithm (GA) can evolve the best set of factor weights over multiple generations.

No assumptions about linearity are required, making GAs more flexible than traditional regression-based models.

The Best of Both Worlds: Manual & Automated Optimization

Portfolio123 is already a great system, but it could be automated to find the optimal solution faster, with built-in cross-validation to ensure robustness and prevent overfitting.

And it might even outperform traditional methods that assume linearity .

The best part? It’s intuitive—people already use and understand it.

• Those who prefer manual control can continue adjusting their own weights.

• Others could benefit from an automated, hands-off solution for faster, data-driven optimization.

A Next-Level Upgrade: LLM + Automated Optimization

An automated solution coupled with an LLM to assist in feature selection would be a powerful marketing tool.

Imagine a system that:

:heavy_check_mark: Suggests optimal features based on data patterns

:heavy_check_mark: Optimizes factor weights automatically using a GA

:heavy_check_mark: Runs cross-validation to prevent overfitting

:heavy_check_mark: Provides explainability through an LLM interface
This would make Portfolio123 far more attractive to both systematic investors and discretionary traders looking for AI-assisted insights.

1 Like

BTW, Sklearn has a Genetic Algorithm module that I’ve used in the past for feature selection coupled with Elastic-Net regression .

I wouldn’t necessarily recommend using Elastic-Net regression with a genetic algorithm for several reasons , but the Sklearn Genetic Algorithm module itself works well and is intuitive . It has a few hyperparameters you’ll want to read about, but overall, it’s a solid tool for optimization tasks.

I don't understand how you get machine learning with a user manually assigning weights. It seems comparable to saying I'm using AI because I'm consulting a dictionary.

This section of your post, and what follows, is great. Thanks!

I misspoke or wrote that poorly, As you say it is not machine learning when the optimization is done by a human (by definition). It becomes machine learning only when the optimization is automated by a machine (again by definition), as can be done with a genetic algorithm similar to what Sklearn provides.

Thank you for the correction and I appreciate your input on the potential usefulness of a genetic algorithm for automating optimization.

I think an automated RS optimizer would be a great idea, but what should be optimized? What's the metric? I've been experimenting with using a weighted excess return from a rolling screener, maybe that could work?

Great question! And why would P123 limit us to just one metric? It doesn’t have to—just like Sklearn doesn’t restrict us to a single metric, such as MSE, for evaluating models. In Python, changing the metric is straightforward, and we can also write our own metrics as functions.

I like your idea, along with using slope, etc. But I’ve actually used returns on a 15-stock screen as the selection metric in a genetic algorithm. The screen can be automated in Python with the P123 downloads and fed into Python’s genetic algorithm as a function, so there are literally no limits to what can be used as a metric—not even practical limits.

For example, the Sharpe ratio of the screen could be another potential metric, along with any others you find useful. These could be formatted into a single table for easy comparison. And from a programming standpoint, it’s not hard to implement—it’s already built into Sklearn’s module.

P123 could also easily incorporate cross-validation and a hold-out test sample. A simple approach could start with equal-weighting features (with mutation enabled in the genetic algorithm) and use early stopping on a validation set.

This might be too technical for some readers, but the key point is that cross-validation is trivial to implement and could eliminate overfitting in P123 Classic once and for all. With a hold-out test sample, I don’t think this is an exaggeration.

@Marco, as per our discussion, wouldn’t more than a few enterprise customers appreciate this method? Also, you’ve mentioned that you don’t mind programs that require moderate compute power. This certainly falls into that category. It’s not high, in my opinion, and the number of iterations or “generations” could be controlled to manage computational load.

Note that this also a feature selection tool which you are working on, I believe. In other word it can assign weights AND remove factors at the same time with the proper settings. .

@Yuval, purely as a question—I don’t pretend to know the answer—but could this method be adapted for your professional work? I don’t think this is the only good solution for finding weights in P123 Classic, and if you were to say this isn’t the best approach, I might just agree and wouldn’t be offended in the least. But I do think it’s a pretty solid method.

Of course, there’s nothing stopping any of us from adding a few manual tweaks after the program has run to add a human touch. Maybe it gets us into the ballpark—or at least the parking lot of the ballpark… and if fully automated, maybe it could be designing ranking systems for us while we’re out watching a real game at a real ballpark. :slightly_smiling_face:

And while not strictly necessary, couple that with a solid LLM suggesting features to new members, and I think none of them would ever leave—retail or enterprise customers. Well… except to go to the ballpark, watch their kids’ Little League games, or maybe a ballet lesson or two—all while P123 keeps working, designing ranking systems, and automatically renewing their subscriptions.

1 Like

Indeed, it might be. I'd have to try it and see!

1 Like

For what it's worth, I did this many years ago using a genetic optimizer to determine the optimal weights for my factors. It effectively solved the problem of finding the best weight distribution.

From my experience, the AI factor module seems to achieve a similar outcome but with far less transparency - which can be unsettling.

3 Likes

What metric did you use? I find the problem on how to measure the performance of a ranking system to be more important/difficult than the algorithm used to optimize the weights

This was many years ago so my memory has faded some but I most likely averaged slope / correlation and hi-low.

This was to provide explanatory power and ensure the predictions didn’t overfit at the tails.

2 Likes

Deleted

Excellent idea! You’ve articulated my thoughts on this almost word for word. Thank you for writing about it, and now I feel a bit ashamed that I didn’t create such a thread myself earlier. I’ve tried using the 'importance' of different types of predictors with modifiers like the slope of factor weight decay, but it didn’t provide a consistent advantage over the 'equal weight for each factor' benchmark. Your suggestion is brilliant, especially after implementing K-Fold. Thanks for your posts—they’re some of the most interesting on this forum!

1 Like

@test_user this is probably a central question in the context of this method and AI in general. Using a metric that specifically focuses on the stocks you plan to buy is not just a good idea—it’s a crucial insight.

The advantage of this method is that, regardless of which metric or metrics you choose, it allows you to prioritize the stocks you’re most interested in.

This differs from linear regression or elastic-net regression, which fit a line to all the data, including many data points that may not relate to the stocks you’ll actually buy. Even random forests, though different in their approach, typically rely on a metric like MSE for the entire dataset—some of which will never result in actionable trades and may only add noise.

In that sense, this isn’t just a good question—it’s a key insight. It explains why this method has been so productive for P123 members when applied manually, and why it’s worth exploring as an automated P123 AI feature.

If P123 were to provide this AI-driven approach, it would be unique. To the best of my knowledge, no other platform offers a comparable AI method.

The concept is intuitive, offering an accessible middle ground for P123 users:

• For those who don’t have a deep theoretical math background or want to avoid wading through complex proofs, it provides a method that “just makes sense.”

• For experienced machine learners, it serves as another respected optimization technique—different from the typical gradient descent optimizer, yet yielding comparable results on average.

In summary, being able to use a metric that focuses on the stocks you’re going to buy is a critical insight.

I also think the cross-validation process could benefit from early stopping. Including early stopping as part of the cross-validation would add an additional layer of refinement to the optimization process. I think something like k-fold would essentially average the results of different data sets and block bootstrapping would expand the data set theoretically. I think this could all be incorporated into this method.

Thank you for your comments. I won’t get bogged down in debating specific metrics here—there are likely many strong choices— but whatever metric is chosen the ability to focus on the stocks you considering buying is probably a key feature for this method.

2 Likes

Hi Jim,

Thanks for the thread. I'm still a bit lost. To make things a little less abstract and more concrete, could you provide a few examples of metric that may be used?

Hi Walter,

Great question!

For comparison, let’s start with a common approach like a random forest. Typically, a random forest might rely on a metric like mean squared error (MSE). In simple terms, the model tries to predict the returns of every stock in the entire universe, and the MSE tells us how far off those predictions are for each stock. This is useful for general predictive accuracy, but it may not align perfectly with what we’re really interested in.

Why? Because when we focus on picking stocks to buy, we aren’t necessarily looking to predict the returns of every single stock. We’re interested in a smaller, more specific group of stocks—the ones we actually plan to invest in. As Daniel Kahneman points out in Thinking, Fast and Slow, sometimes we end up answering a simpler question rather than the one we really want to solve. A traditional approach like MSE might inadvertently do the same: it answers “How well can we predict returns for the entire universe?” rather than “Which stocks will give us the best outcomes?”

That’s where a more targeted metric comes in. For instance, I’ve used a genetic algorithm that evaluates ranking systems by directly measuring the returns of a 15-stock portfolio built from each system. Instead of asking “How well does this ranking system predict returns for every stock?”, the metric focuses on a practical result: “How well does this ranking system perform when applied to a 15-stock portfolio?”

Another great example, credit to @pitmaster for suggesting it, is the Sharpe ratio of a screen as the metric for a genetic algorithm. By optimizing for the Sharpe ratio of a portfolio generated by the ranking system, you can directly assess the trade-off between return and volatility—something that’s highly relevant for many investors.

In short, the key is to ask yourself what you actually want the ranking system to achieve. If it’s higher returns for a 15-stock portfolio, use that as the metric. If it’s a better risk-adjusted return (Sharpe ratio), use that. By focusing on a metric that directly reflects your investing goals, you can make the optimization process more meaningful.

I also think that, when using these more targeted metrics, cross-validation becomes even more important. Preventing over-optimization to a single metric ensures that the results are robust and not just a product of overfitting.

This is, of course, a "brief" response. I’d be happy to dive deeper into any of these points if you’d like!

Edit: So I just want to add that using a metric like that has the advantage of making this a non-linear method which gives it an obvious advantage over linear regression models (but not tree models).

Genetic algorithms have a unique way of handling feature interactions that is worth consideration also. I won't address that here.

Jim

1 Like

@DesireX @test_user @WalterW @korr123 @yuvaltaylor and anyone interested,

TL;DR: This genetic algorithm approach seems to work well, and maybe P123 could automate something like this.

I modified my code to do something similar to what I perceive many are doing with optimizers—but with a genetic algorithm twist.

What’s the twist?

Genetic algorithms use crossover, which allows factors that perform well together to remain intact in the “genetic code” instead of being randomly split. This can help preserve synergies between factors that work well in combination.

The Results:

• The model was trained using a screening backtest.

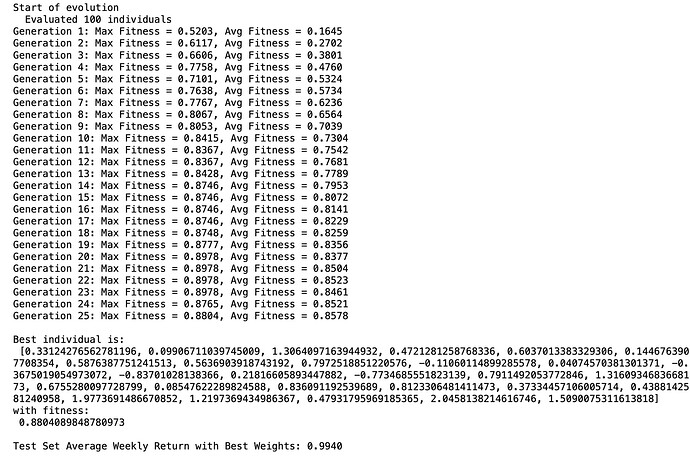
• The test set which was out-of-sample achieved an average weekly return of nearly 1% (0.9940%) .

• The GA also produced optimized factor weights, making it possible to see which features were prioritized by the model. I did not include the names of the features.

Mathematically, this should converge to at least a local maximum with enough generations.

Here’s an example of the output, showing the progression across generations and the final results:

This raises an interesting question: Could something like this be automated within P123? Cross-validation could be added which I did not attempt with this code.

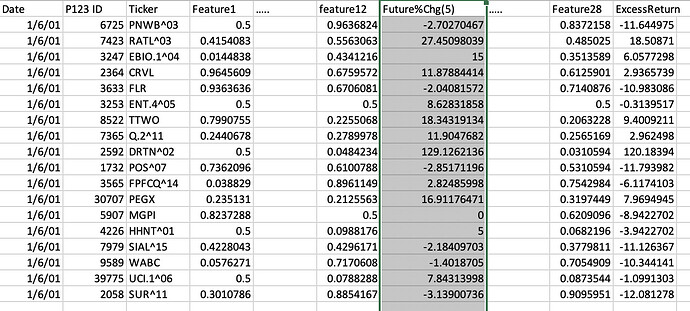
Code. You will need to create a column called 'ExcessReturn' that has your excess returns relative to the universe in a column.


import pandas as pd
import numpy as np
from sklearn.preprocessing import StandardScaler
import warnings
import random
from deap import creator, base, tools, algorithms

# Suppress warnings
warnings.filterwarnings("ignore", category=RuntimeWarning)

# ---------------------
# Data Loading & Prep
# ---------------------
# Read your eight CSV files and concatenate them
try:
    df1 = pd.read_csv('~/Desktop/DataMiner/xs/DM1xs.csv', parse_dates=['Date'])
    df2 = pd.read_csv('~/Desktop/DataMiner/xs/DM2xs.csv', parse_dates=['Date'])
    df3 = pd.read_csv('~/Desktop/DataMiner/xs/DM3xs.csv', parse_dates=['Date'])
    df4 = pd.read_csv('~/Desktop/DataMiner/xs/DM4xs.csv', parse_dates=['Date'])
    df5 = pd.read_csv('~/Desktop/DataMiner/xs/DM5xs.csv', parse_dates=['Date'])
    df6 = pd.read_csv('~/Desktop/DataMiner/xs/DM6xs.csv', parse_dates=['Date'])
    df7 = pd.read_csv('~/Desktop/DataMiner/xs/DM7xs.csv', parse_dates=['Date'])
    df8 = pd.read_csv('~/Desktop/DataMiner/xs/DM8xs.csv', parse_dates=['Date'])
    df = pd.concat([df1, df2, df3, df4, df5, df6, df7, df8], ignore_index=True)
except FileNotFoundError as e:
    print(f"Error: {e}")
    raise

# Sort by Date and set as index
df = df.sort_values('Date')
df.set_index('Date', inplace=True)

# Replace NaN values in 'ExcessReturn' with 0
df['ExcessReturn'].fillna(0, inplace=True)

# Define features (using your provided list)
features = [Your features here]

# Check for missing features
missing_features = [f for f in features if f not in df.columns]
if missing_features:
    print("Missing features:", missing_features)
    features = [f for f in features if f in df.columns]
    print("Using available features:", features)

# Split data into training and test sets
train_data = df[df.index < '2020-01-01']
test_data = df[df.index >= '2020-01-01']

X_train = train_data[features]
y_train = train_data['ExcessReturn']
X_test = test_data[features]
y_test = test_data['ExcessReturn']

# Standardize features
scaler = StandardScaler()
X_train_scaled = scaler.fit_transform(X_train)
X_test_scaled = scaler.transform(X_test)

# Save the original indices for grouping by week later
train_dates = X_train.index
test_dates = X_test.index

# -------------------------
# Genetic Algorithm Setup
# -------------------------

# Define the fitness function: for an individual's weight vector, compute the dot product
# with each stock's features, group by week, select top 15 stocks, and take average return.
def evaluate(individual):
    weights = np.array(individual)  # Convert list to numpy array
    # Compute predictions using a simple dot product
    predictions = np.dot(X_train_scaled, weights)
    
    df_scored = pd.DataFrame({
        'date': train_dates,
        'actual_return': y_train.values,
        'predicted_score': predictions
    })
    
    weekly_returns = []
    # Group by week using the date index
    for date, group in df_scored.groupby(pd.Grouper(key='date', freq='W')):
        if group.empty:
            continue
        # Select the top 15 stocks based on predicted score
        top15 = group.nlargest(15, 'predicted_score')
        weekly_return = top15['actual_return'].mean()
        weekly_returns.append(weekly_return)
    # If no weeks were processed, return a very low fitness
    if not weekly_returns:
        return (-9999.0,)
    avg_weekly_return = np.mean(weekly_returns)
    return (avg_weekly_return,)

# Use DEAP to define the individual and the genetic algorithm
creator.create("FitnessMax", base.Fitness, weights=(1.0,))  # We want to maximize average weekly return
creator.create("Individual", list, fitness=creator.FitnessMax)

toolbox = base.Toolbox()
# Attribute: a random weight for each feature; here we use a uniform distribution between -1 and 1.
toolbox.register("attr_float", random.uniform, -1.0, 1.0)
# Individual: a list of floats of length equal to number of features.
toolbox.register("individual", tools.initRepeat, creator.Individual, toolbox.attr_float, n=len(features))
# Population: list of individuals.
toolbox.register("population", tools.initRepeat, list, toolbox.individual)

# Register evaluation, crossover, mutation, and selection operators.
toolbox.register("evaluate", evaluate)
# Crossover: blend crossover (adjust alpha as needed)
toolbox.register("mate", tools.cxBlend, alpha=0.5)
# Mutation: Gaussian mutation with mu=0 and sigma=0.2; indpb is the independent probability for each attribute to be mutated.
toolbox.register("mutate", tools.mutGaussian, mu=0, sigma=0.2, indpb=0.2)
# Selection: tournament selection with tournament size 3.
toolbox.register("select", tools.selTournament, tournsize=3)

# -----------------------
# Run the Genetic Algorithm
# -----------------------
random.seed(42)  # For reproducibility
population = toolbox.population(n=100)
NGEN = 25
CXPB = 0.5  # Crossover probability
MUTPB = 0.3  # Mutation probability

print("Start of evolution")
# Evaluate the entire population
fitnesses = list(map(toolbox.evaluate, population))
for ind, fit in zip(population, fitnesses):
    ind.fitness.values = fit

print("  Evaluated %i individuals" % len(population))

# Begin evolution
for gen in range(1, NGEN + 1):
    # Select the next generation individuals
    offspring = toolbox.select(population, len(population))
    # Clone the selected individuals
    offspring = list(map(toolbox.clone, offspring))

    # Apply crossover and mutation on the offspring
    for child1, child2 in zip(offspring[::2], offspring[1::2]):
        if random.random() < CXPB:
            toolbox.mate(child1, child2)
            del child1.fitness.values
            del child2.fitness.values

    for mutant in offspring:
        if random.random() < MUTPB:
            toolbox.mutate(mutant)
            del mutant.fitness.values

    # Evaluate the individuals with an invalid fitness
    invalid_ind = [ind for ind in offspring if not ind.fitness.valid]
    fitnesses = map(toolbox.evaluate, invalid_ind)
    for ind, fit in zip(invalid_ind, fitnesses):
        ind.fitness.values = fit

    # Replace the old population with the offspring
    population[:] = offspring

    # Gather all the fitnesses in one list and print stats
    fits = [ind.fitness.values[0] for ind in population]
    print(f"Generation {gen}: Max Fitness = {max(fits):.4f}, Avg Fitness = {np.mean(fits):.4f}")

# Identify the best individual in the population
best_ind = tools.selBest(population, 1)[0]
print("\nBest individual is:\n", best_ind)
print("with fitness:\n", best_ind.fitness.values[0])

# --------------------------------
# Evaluate on the Test Set
# --------------------------------
def evaluate_on_test(individual):
    weights = np.array(individual)
    predictions = np.dot(X_test_scaled, weights)
    df_scored = pd.DataFrame({
        'date': test_dates,
        'actual_return': y_test.values,
        'predicted_score': predictions
    })
    weekly_returns = []
    for date, group in df_scored.groupby(pd.Grouper(key='date', freq='W')):
        if group.empty:
            continue
        top15 = group.nlargest(15, 'predicted_score')
        weekly_return = top15['actual_return'].mean()
        weekly_returns.append(weekly_return)
    if not weekly_returns:
        return -9999.0
    return np.mean(weekly_returns)

test_performance = evaluate_on_test(best_ind)
print(f"\nTest Set Average Weekly Return with Best Weights: {test_performance:.4f}")

1 Like

It's surprising that Portfolio123 still lacks built-in optimization capabilities. Years ago, this may have been understandable, but given the proliferation of readily available off-the-shelf algorithms today, it feels like a missing feature. Every systemic strategy optimizes implicitly or explicitly.

I'd be interested in understanding the rationale behind this—why hasn't optimization been incorporated into the platform yet?

Regardless, you'd still need a risk management system in place to minimize errors.

2 Likes

@Jrinne How are you generating your CSV files in this sample? Or perhaps you could paste a a few lines from one here.

Thanks
Tony

I hope this is clear. I have deleted some of the columns and replaced them with [,,,] to fit into the screenshot. Excess return was generated in Python which added it to the csv file. It can do that because this spreadsheet has all of the data necessary to calculate the universe returns for each week:

Cool! I recommend using a lot more than 15 stocks though. I use between 100 and 200.