I'm wondering if other users can say what range of values they are gettingfor Gini, etc. When I ask chatGPT:
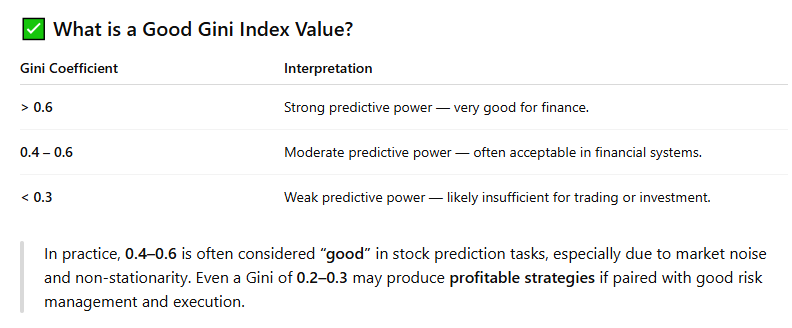
I'm generally getting values < 0.4 for Gini with ~100 features models.
I'm wondering if other users can say what range of values they are gettingfor Gini, etc. When I ask chatGPT:
I'm generally getting values < 0.4 for Gini with ~100 features models.
Are you using Gini to assess feature importance? It is mostly used for classification say win/loss rather than magnitude of win loss. I would not use Gini solely.
Yes, feature importance. So far I've been using AI exclusively on large cap models and have a few that have significant excess returns. Before P123 launched AI, my AI knowledge was about zero. When I ask one of the AIs what is the ideal number of features to use (20 years of data fundamental data on 5000 stocks) they typically say 100 +/- 50. From what I've read, I need to be concerned about having too many features (over-fitting), so I'm spending a lot of time on feature selection. This seems to be going well based on my results but when I look at the Gini and Moro Index values they are not good. I really have no context for comparison with other P123 users, and for all I know chatGPT, grok, etc, might be wrong to begin with both for number of features and how to measure their importance. Thanks
I would be curious to know as well what coefficients people are seeing
Some color as the discussion unfolds:
The gini coefficient is a measure of how good the SOLO feature is at splitting winners and losers at each split across all trees. (Win/loss composition. Gini is typically used for inequality studies in economics)
The goal of the algo is to reduce MSE for the final model. A feature with a low gini can still improve MSE if that solo feature interacts well with others so if I ever remove one based on gini I would want to compare MSE or results before and after.
The other useful measure is mean standard error reduction or variance reduction (also SOLO) across splits and trees for each feature. This is separate from the final MSE.
I have been trying to learn more as well. If anyone has any corrections on this it would be helpful to improve my understanding as well. Basically we cannot disregard low gini features without further review
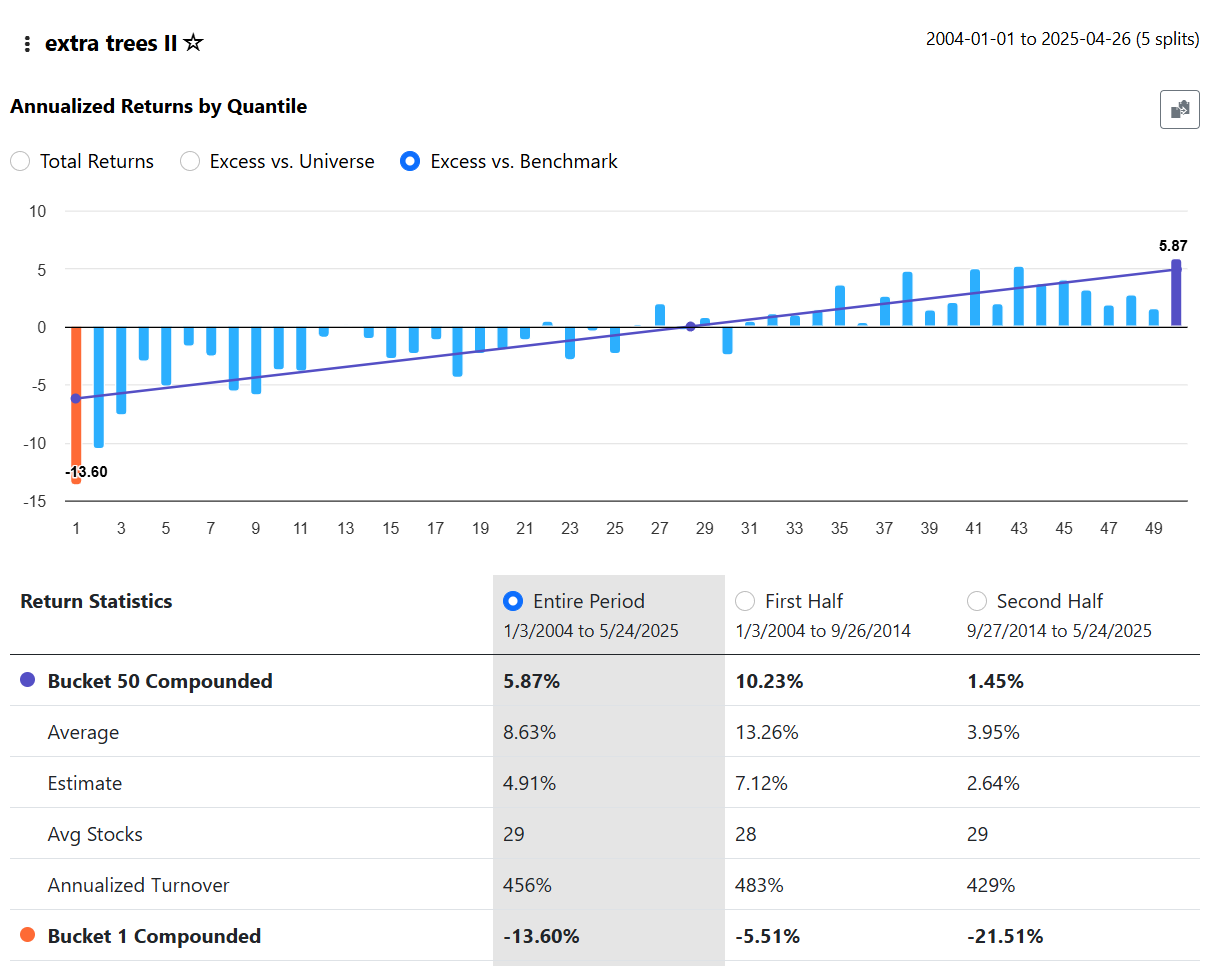
To add some detail to this discussion, here is an example. The following results were obtained with this setup:
universe = SP 1500
period = max
AI Factors used = Core Combo
Core Combo has 65 features. After running the Target Information Regression it showed Gini = 0.3701 and Moro = 0.3833
I then used Extra Trees ll using K Fold (5 folds) and got:
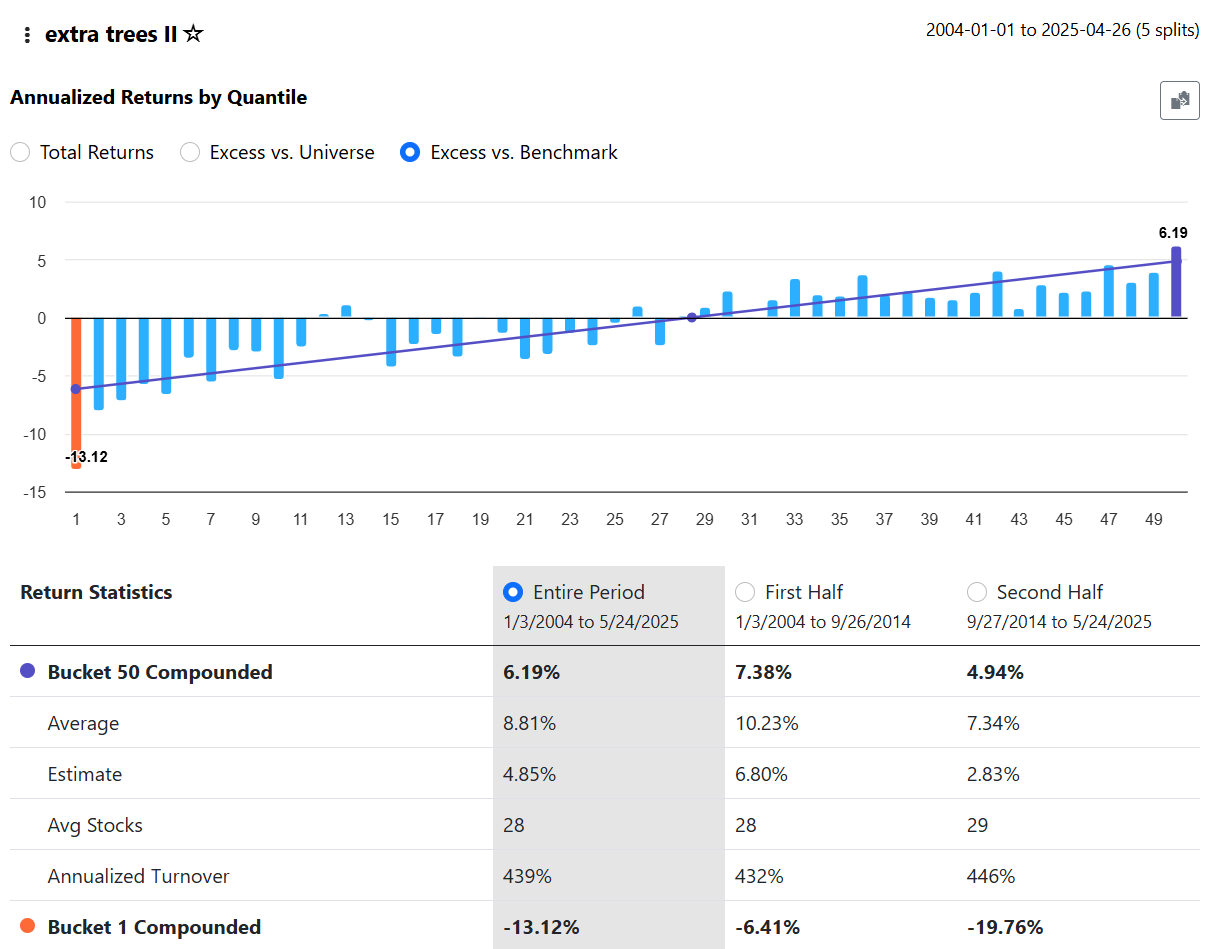
Next I saved as new model, only imported the top 2/3rds of the features (so now 44 features) as defined by the regression and repeated everything.
Now both Gini and Moro have declined significantly to 0.2276 and 0.2114.
However, the returns have improved slightly:
What does all this mean? I'm really not sure.....
When removing features i would remove them one by one otherwise you really would not know if you let a good one go by deleting in bulk. At least until we have SHAP numbers. In other words, you would have no proper case by case comparison in your experiment. Another thing that can complicate things is each training is different by chance so models in theory might not be exactly the same even with same settings unlike traditional models without many equal ranks. Right now I want to make sure I understand everything perfectly before I start running trainings, but in theory these things should hold.
Portfoliologic,
Have you looked into P123’s “Importance” metric for features? As SZ pointed out, P123’s method for measuring importance aligns with those typically used in regression models. Gini is more common for classification models. And unless I missed something, all of P123’s machine learning models are regression-based—there hasn’t been any announcement about classification models, as far as I know.
That’s a common and solid approach, I believe. One practical method is to remove the feature with the lowest importance score, then continue removing features one at a time, checking for improvements after each step.
If you’re working with downloaded data, this can be automated. Here’s an example using recursive feature elimination with cross-validation (RFECV) in scikit-learn:
Thanks for sharing Jrinne. Do you also agree each run is unique and might provide different results even for the same settings? I have not tested this yet, but makes me wonder if randomness could turn a marginally additive feature into a marginally subtracting one if one goes by overall results.
SZ,
Yes, if you’re running a Random Forest in P123, there’s inherent randomness. Each tree is built on a random bootstrap sample of stocks (rows), and if max_features is set to less than 1.0, a random subset of features is used at each split. So even with the same settings, different runs can yield slightly different results.
When using scikit-learn with downloaded data, you can ensure reproducibility by setting random_state to a fixed integer—e.g., random_state=42.
More importantly, the impact of randomness tends to diminish as you increase the number of trees. The default is n_estimators=100, but if your compute resources allow, bumping this up to something like n_estimators=3000 will cause variability to asymptotically approach zero.
Personally, I run n_estimators high enough that I don’t worry about randomness—usually 500 or 1000 does the trick. For final runs, I set it as high as my machine can handle. There’s no risk of overfitting from doing this.
-Jim
I agree on the number of trees. I figured some might try “quick” runs with less intensity which could be ill advised based on the randomness (light gbm too given the subsampling hyperparameters). Thanks for confirming. Goes to show one needs to be careful when ruling out features.
Jrinne,
The Importance metric being the bar graph for each feature after running the regression? If so, yes. Thanks
Just a few comments and questions. I'm just starting with AI, but I understood that with decision-tree-based models, the feature importance doesn't reflect what might be going on under the hood, as it were, and that eliminating factors based on feature importance might not be as good as eliminating overly correlated factors. From the little I understood, decision-tree-based models can frequently focus in on little-used factors to make decisions in certain instances. Of course, I might be mistaken.
To eliminate highly correlated factors, one method is to simply take your ranking system, set all nodes equal (e.g. assign them 0 weight), and then use the "Ranks" tab with the "columns" box set to "Include Composite & Factor Ranks." Then download the spreadsheet and, in Excel, use the "Data Analysis" tool and select "Correlation." In a new sheet it'll give you a correlation table. You can then highlight the cells with the highest values and eliminate highly correlated nodes that way.
What I've been doing so far with AI systems is much easier, though maybe it won't work that well. I create AI factors for five different random universes using Mod(StockID, 5) = 0, 1, 2, 3, or 4 in the rules of those universes. For each AI factor I choose a random set of 170 factors out of the 300-odd that I could use. At the end, I combine the five predictors into a ranking system, giving each one 20%. I figure I'm avoiding overfitting that way. Maybe this is a terrible idea, though. Someone with more knowledge of machine learning might correct me. I use the Extra Trees algorithm, BTW.
It was my understanding that decision trees are not regression-based. Again, though, I could be totally wrong.
Hi Yuval,
Thanks for sharing your approach!
To address a few of your questions:
Random Forests, including RandomForestRegressor, can be used for either regression or classification tasks. From what I understand, Portfolio123 is currently using scikit-learn’s Random Forest Regressor under the hood.
I believe P123’s implementation of XGBoost is also used in regression mode (though the algorithm itself supports classification as well). As far as I know, P123 isn’t currently using classification models.
Regarding feature importance, there are two common approaches:
Both methods help illuminate what the model is doing, though impurity-based importance is generally considered more informative.
It’s worth noting that Random Forests are relatively robust to collinearity (correlated features). Highly correlated variables may divide importance or be used interchangeably, but this typically doesn’t harm model performance — unlike in linear models, where multicollinearity can be more problematic.
In those cases, regularization methods like Ridge, LASSO, or Elastic Net are helpful, as they shrink or remove correlated features automatically.
That approach does make intuitive sense — partitioning your data like that can help reduce overfitting. That said, if you’re using tree-based models like Random Forest or Extra Trees, I’d recommend relying on bootstrapping, which is already built into these algorithms and specifically designed to reduce variance and combat overfitting.
Bootstrapping trains each tree on a random subset of the data. It essentially accomplishes what Mod() is intended to do — in a statistically grounded and far more scalable way.
In fact, you can bootstrap 500 times relatively quickly — a significant increase in the number of random universe compared to using Mod(StockID,5)!
Thanks.
Best,
Jim
I was learning about hyperparameters a few weeks back and learned that light gbm has these hyperparameters:
Your idea to combine models is something i will attempt to do later as well as there is evidence that model ensembles work better than just one. Usually researchers will change say number of leaves between the models or other parameters.
There is also a method where you can use random forest (or in this case extra randomized trees) to pick robust (general) features and then use those in a gradient boosting algo.
If you then choose "subsample_freq": 1} each tree will have its randomized universe
Thanks, SZ — I think that’s a great point and one that’s clearly supported in the literature.
When using gradient boosting with subsampling, it’s referred to as Stochastic Gradient Boosting. Here’s a link to the original 1999 paper by Friedman:
Yuval,
I hadn’t realized you were using ExtraTreesRegressor—somehow I missed that! It’s one of my favorite models as well, and I think I can replicate much of what you’re doing using the built-in parameters of the algorithm.
You mentioned:
You can achieve something very similar within ExtraTreesRegressor by setting:
So with just those two parameters, you’re essentially replicating your multi-universe + randomized-feature setup in a scalable and automated way. The only meaningful difference is that ExtraTrees samples features at the split level, rather than fixing a set of features for the entire model as you do. But this design allows you to scale the process to thousands of randomized trees without sacrificing performance—and, as far as I can tell, without any real downside.
As I said ExtraTreesRegressor is one of my favorite models. It is far more lightweight to tune than models like XGBoost or LightGBM. Fewer hyperparameters not only makes it easier to use, but also reduces the chance of overfitting.
For reference, here are the full set of tunable parameters ExtraTreesRegressor documentation
Note: Since Portfolio123 uses JSON to define model parameters, there may be subtle syntax differences—for example, using true instead of Python’s True (cap sensitive). If any hyperparameter doesn’t seem to be accepted, it may be worth checking with Dan to confirm the correct formatting or whether that specific parameter is currently supported.
I really like what you are doing. Maybe some of it can automated and scaled up.
-Jim
Wow. Thanks so much, Jim. This is incredibly helpful.