Some troubling issues are coming up about this paper and it's conclusions. See follow up posts
Check out this new paper. It's quite readable, only getting into details where necessary, and very actionable. In addition it probably summarizes all important recent papers in AI for finance. https://papers.ssrn.com/sol3/papers.cfm?abstract_id=5031755
Highlights from a quick read
"Sharpe ratios ranging from 0.08 to 1.82." That's a huge range of outcomes from design choices!
"By contrast, feature selection and training sample have little impact." This is in direct contrast with the conclusion we've been coming to.
"we cross-sectionally rank the stocks each month by each characteristic into the [-1, 1] interval." ... "We do not treat the data preprocessing as a key machine-learning design choice" What? Normalization is not important? We just released a major upgrade that offers 14 different normalization options for a feature!
"numerous ways exist to handle missing values (cf., Bryzgalova et al., 2024; Freyberger et al., 2024)." Really, like what? We only have one way at the moment to treat NAs. We'll investigate.
"They find that the variable returns decline by 26% out-of-sample and 58% post- publication." Sounds about right. OOS returns usually 1/2 of backtested results.
Summary of paper's conclusions
"First, ensembles of machine learning models (ENS ML) generally outperform individual algorithms."
"Choice of target variable depends on the investment objective. For achieving higher long-short returns, abnormal returns relative to the market (RET-MKT) are superior over often-used excess returns (RET-RF). For achieving higher risk adjusted returns, the CAPM risk-adjusted returns (RET-RISK) is preferable"
"Third, continuous targets perform better than dummy targets ...we recommend using a regression algorithm over a classification algorithm."
"Based on our results, an expanding window is superior, in particular for methods that allow non-linearities and interactions."
Lots to unravel for potential upgrades to our AI toolset.
They have obviously put a lot of research effort into their paper. A large percentage of their observations agree with our observations.
However, I wouldn’t value any of their observations over the general conclusions that are evolving amongst the P123 staff and community. If you spend a little time going over how the Kaggle top competitors achieve their best results you will find the spend a lot of effort engineering their data (normalization, transforming with log, poly missing values) and feature selection. Additionally they only used monthly data, didn’t use buy and sell criteria nor calculate transaction costs.
“We retrieve monthly market data from the Center for Research in Security Prices (CRSP) and merge it with return predictors from the Open Source Asset Pricing (OSAP, March 2022 version) library of Chen and Zimmermann (2022).”
The Chen and Zimmerman Data is the Mean Long-Short Return Across 212 Predictors Monthly
They used “163 clear and 44 likely predictors”
Their findings for most important Factors:
TrendFactor, Mom 12M, Beta, STreversal, AnalystRevisions . . . I’d like more details on the specifics of their implementations. Perhaps the CRSP STreversal?
TL;DR: Missing values (NAs) can contain useful information. Instead of overwriting them, consider allowing your model to decide how to handle them dynamically.
"The dog did nothing in the night-time….That was the curious incident." -Sherlock Holmes
My Original Idea:
Missing values (NAs) often carry information (as in the Sherlock Holmes example where the absence of a bark in the night carried information). In tree-based models, P123 could have the option of assigning NAs a special value—like a negative number—and letting the algorithm determine whether to split on them based on their potential relationship to the target variable. This approach enables the model to dynamically decide whether missingness is relevant.
Claude 3 and ChatGPT’s Insights (someone already thought of this):
For example, XGBoost handles missing values elegantly and automatically. Here's a summary of how it works:
When evaluating a split, XGBoost first assigns all non-missing values to their respective branches.
It then tests both possible directions for NAs—placing them on the left branch or the right branch—and calculates the gain for each scenario.
The direction that yields the highest gain is chosen for NAs at that particular split.
This method has several advantages:
Dynamic handling: NAs can take different paths at different nodes, depending on what optimizes the objective function.
Optimal results: The approach is guided by performance improvement, ensuring the best outcome for each split.
Retention of information: NAs are treated as their own category, preserving the signal in missingness without requiring arbitrary assumptions or preprocessing.
The best part? XGBoost’s implementation is implicit. Simply pass your data with NAs (e.g., np.nan in Python or NA in R), and the algorithm handles the rest. This is far more sophisticated than assigning a fixed value to NAs, as it dynamically accounts for their context and potential relevance.
Summary of XGBoost's algorithm in the context of P123's ranking system:
In a ranking-based system like P123, XGBoost can test splits where NAs are treated as either a negative number or as a value greater than the ranking range (e.g., >100 for ranks 1-100). The algorithm evaluates both options and selects the one that optimizes the split.
Nice! It’s great that the guys and gals at XGBoost not only thought of this already but also improved upon it in such an elegant way. P123 could probably expand its use to other tree-based methods.
Edit: I think P123 could probably implement the full XGBoost method (at least within XGBoost). Here is Claude's attempt at a simplified solution for other tree-based methods:
"Let me lay out a potential implementation approach for P123's tree-based models:
Initial Implementation Approach [suggested by Claude 3]
First, add a configuration option for NA handling in tree models:
Default: Current behavior (replacing NAs)
New option: "Use NAs as signals"
For numeric rankings (assuming 1-100 range):
Option 1: Assign NAs a value like -1
Option 2: Assign them 101
The choice between -1 vs 101 could be another configuration option [emphasis mine]
You would want control of this for each feature maybe in the same menu as normalization options[this is my addition]
For the tree splitting logic:
When evaluating splits, the algorithm would naturally create branches that separate NA values if their return patterns differ
If NAs behave similarly to certain rank ranges, they'd get grouped together
Advantages of This Approach
Simple to implement with existing tree infrastructure
Easy to test/validate (just compare performance with/without the feature)
Provides a foundation for more sophisticated handling later
Lets users experiment with NA treatment
Potential Extensions
Track and report how often NAs get split into their own branches
Allow different NA values for different factors
Add statistics about NA predictive power"
My final take on all of this: I didn’t even know "missingness" was a word until now. Turns out, it’s the perfect term for this situation. Just as it took centuries for humans to understand zero has information and to adopt the concept of zero in mathematics, "missingness" has finally found its place as an important concept in machine learning. NAs are like zeros—they carry meaning and should be used. Personally, I’m not a fan of Roman numerals, so I’ll stick with zeros and now use the concept of "missingness" wherever possible.
With inspiration from the geniuses at XGBoost, Sir Arthur Conan Doyle (1859-1930), author of Sherlock Holmes, and some unknown East Indian mathematicians who developed the concept of zero and not to forget the computer science geniuses that figured out off could mean zero in their binary code—in aggregate potentially making this one of the most important concepts to the modern world,
Agree. When I read anything from Robeco I always think twice - is this marketing of their funds or real value for investors ?
Robeco is famous for providing readable papers with breakthrough ideas but is somehow not very famous for delivering superior performance for their clients (as most of big investment funds).
agree, for example they did not test small and micro caps and in the micro-cap space I get very good results with total return (instead of 3 or 6 month rel).
But also, I could replicate important parts of their findings -->
If you want total return:
use a relative strength target (3 - 6-month rel return)
use rank as prepr. (captures nonlinearity well)
put a ton of features in the model, use long learning time (basic holdout 16 Years training, 3 years holdout)
use non linear ML (on big caps I use Lightgbm, handles non linear data well) which will figure out the feature importance (without normalizing the data, I tested both, normalized and non-normalized data, in this setup, no big difference)
use a "specialized" universe (for big caps SPY, for small caps I go with lower volume) --> ML seems to need a "specialized" universe, causations seem to be different with different kind of sizes
On small caps --> use MLs that handle missing data well --> LightGBM (also it captures nonlinear data well).
Very interesting. Seems like most tree based algos can handle NAs. Our current implementation does not allow leaving NAs in the dataset. It was a design decision so that the dataset is compatible with all algos. We should do some tests to see if it's worth adding the capability to pass NAs to the algorithms.
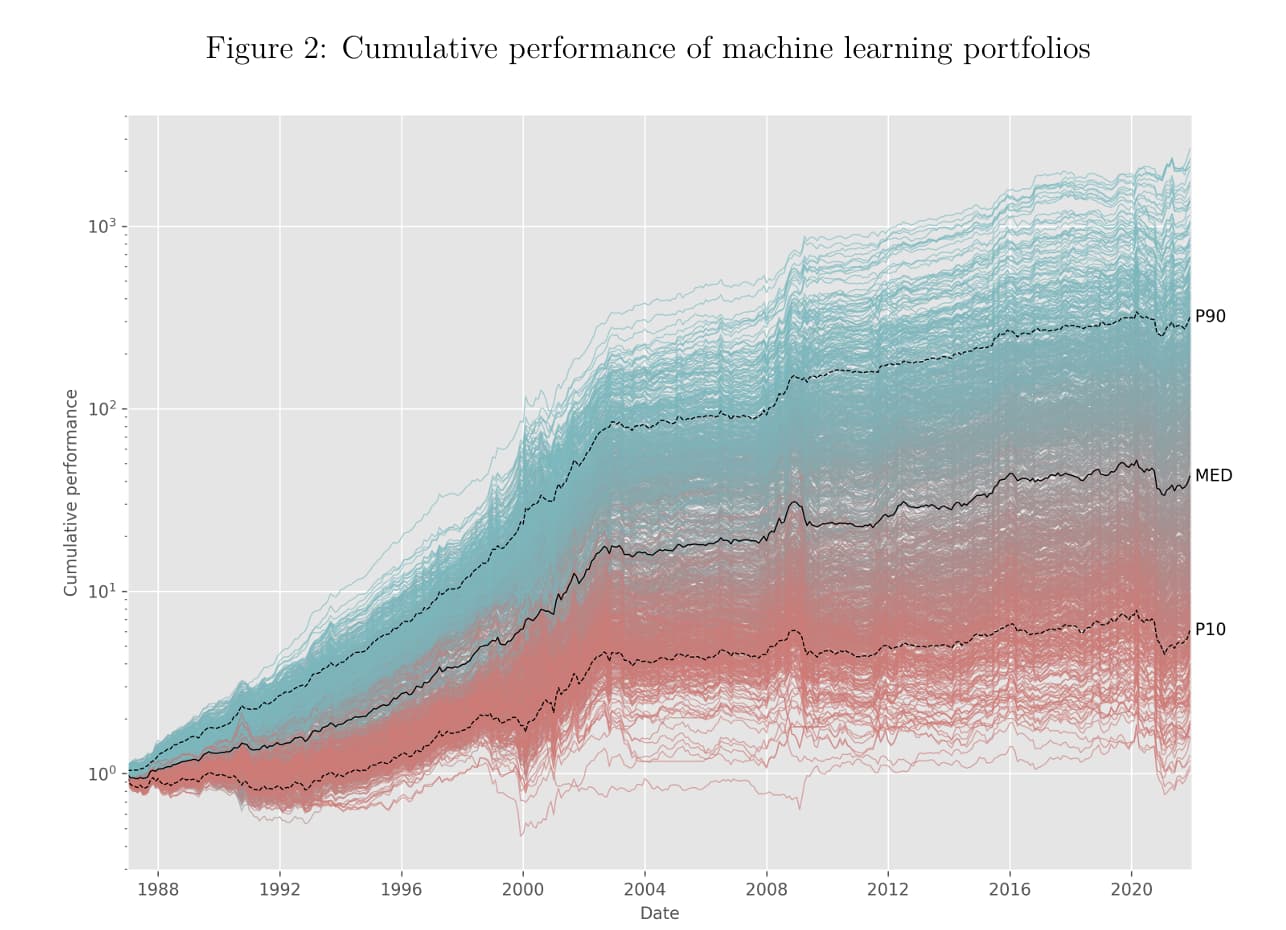
Another troubling thing about this paper is the period: January 1957 to December 2021. Data pre ~2000 is very sketchy and different. And it's reflected in their cumulative performance charts that have a clear inflection point. If I saw backtests results like the ones below I could only conclude that the models are useless going forward.
And even worse, they don't seem to even acknowledge this, nor try to explain what went wrong post 2003. Very strange!
Perhaps I need to edit the title of the post from "Great AI paper" to "Misleading AI paper".
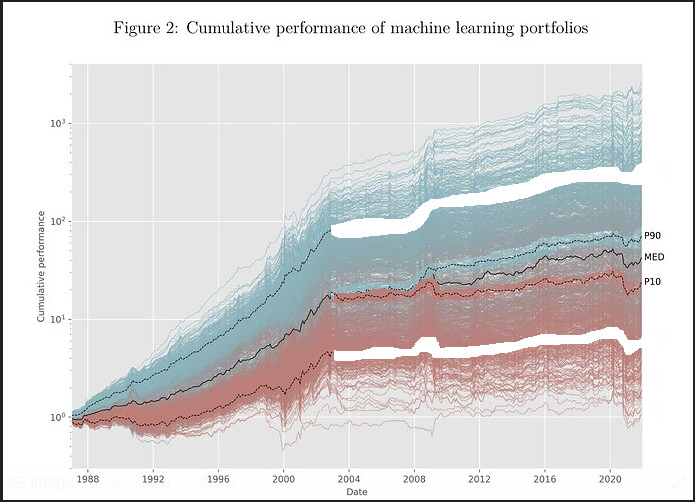
Used my amazing MS paint skill to move the P10 and P90 curves after 2003.
Looks like the only overperformance after 2003 in their test was made was during 2008 .