Guidance on Overlapping Hedge Signals

Can the community provide some guidance on how to make overlapping Entry/Exit signals function together? I hope to understand how to deal with this fundamental challenge I'm sure I'm not the first to face.

I have multiple composite risk control series that work well independently, but I'm getting bizarre in/out-of-market signals because the signals overlap. The details of my custom series don't matter, but they include breadth, volatility, advance/decline, and multiple other measures built into composites.

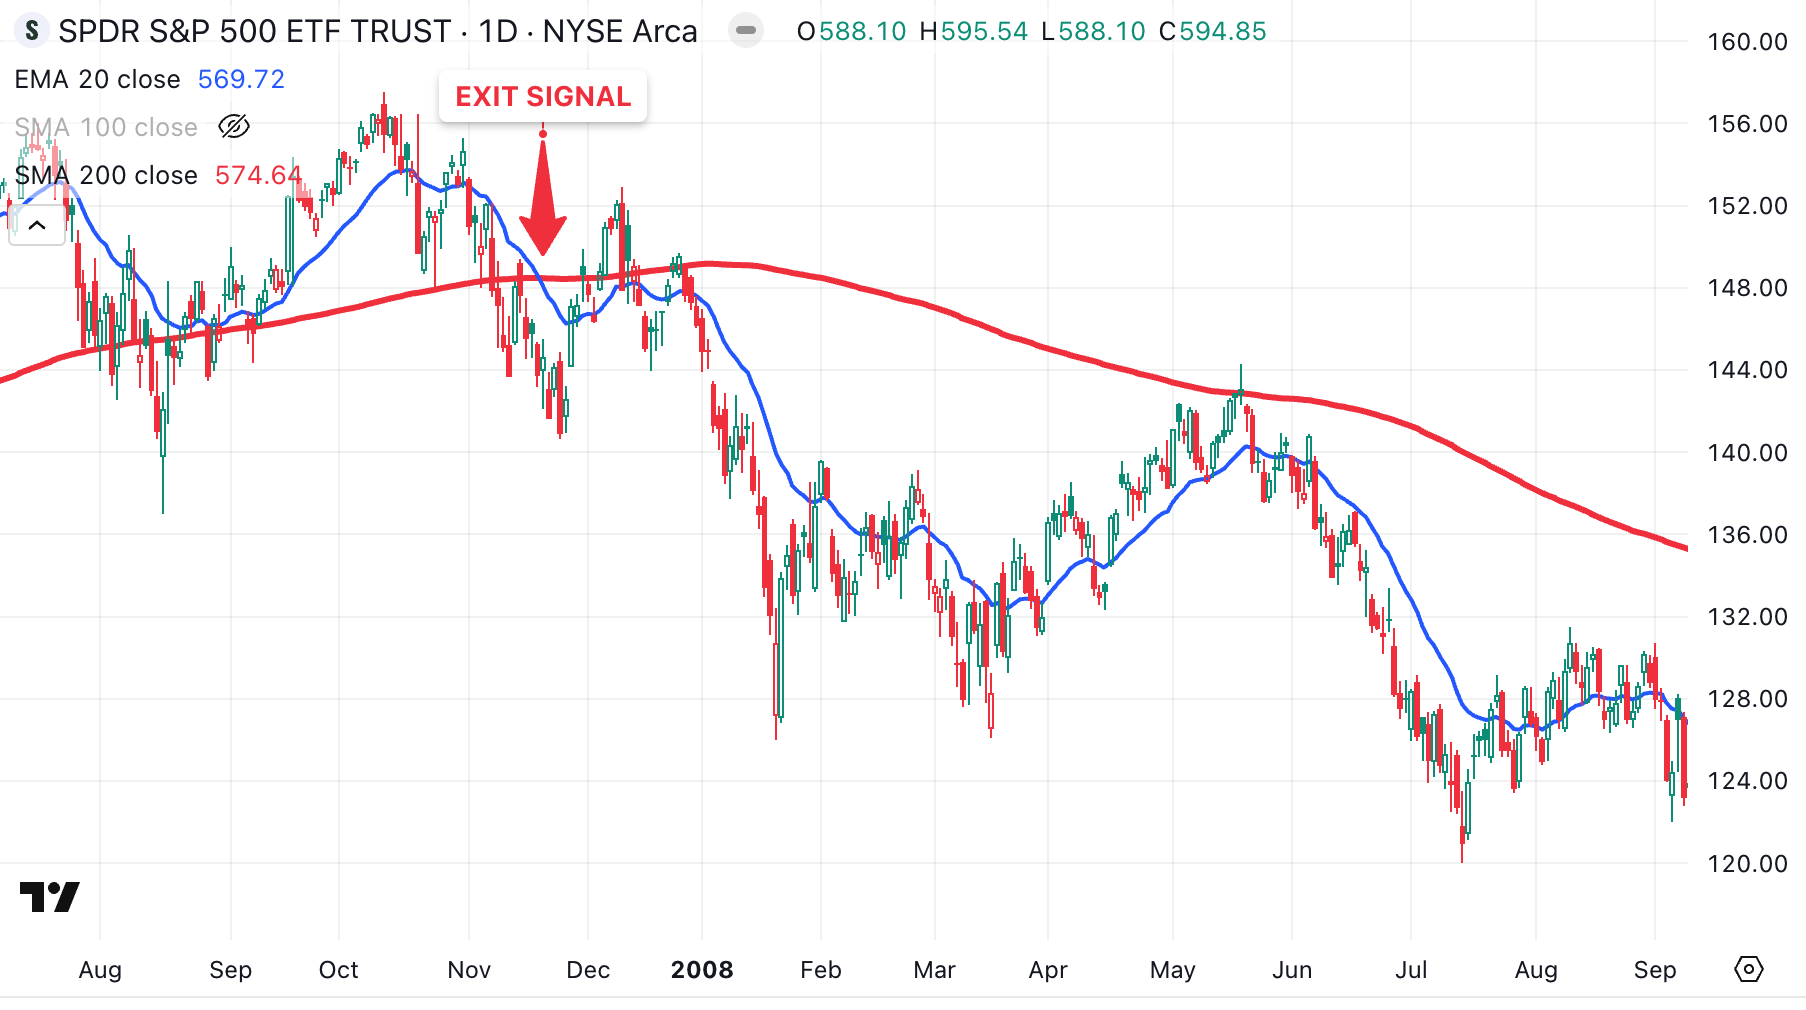
Rather than get mired in those details, I'll use simple examples for the signals to make this more straightforward. To demonstrate, I created a chart showing a basic exit signal when the S&P 500's 5-day EMA drops below the 200-day SMA and a simple re-entry signal when the EMA(5) moves back above the 100-day SMA.

The objective of different thresholds (200-day SMA on exit and 100-day SMA on re-entry) is to enable the portfolio to get back into the market earlier, nearer the start of a rally. If we used the same entry and exit signals (5-day EMA and 200-day SMA) on my example, there would be a two-month delay, remaining out of the market and missing the rally's start.

Here is a chart showing these signals on the S&P 500 before and during the 2008-2009 Financial Crisis. I'm using this period because, again, it simplifies the example.

The first chart shows an EXIT signal when the 5-day EMA (blue) drops below the 200-day SMA (red):
The second chart shows my simple example for RE-ENTRY when the 5-day EMA (blue) moves back above the 100-day SMA (green):
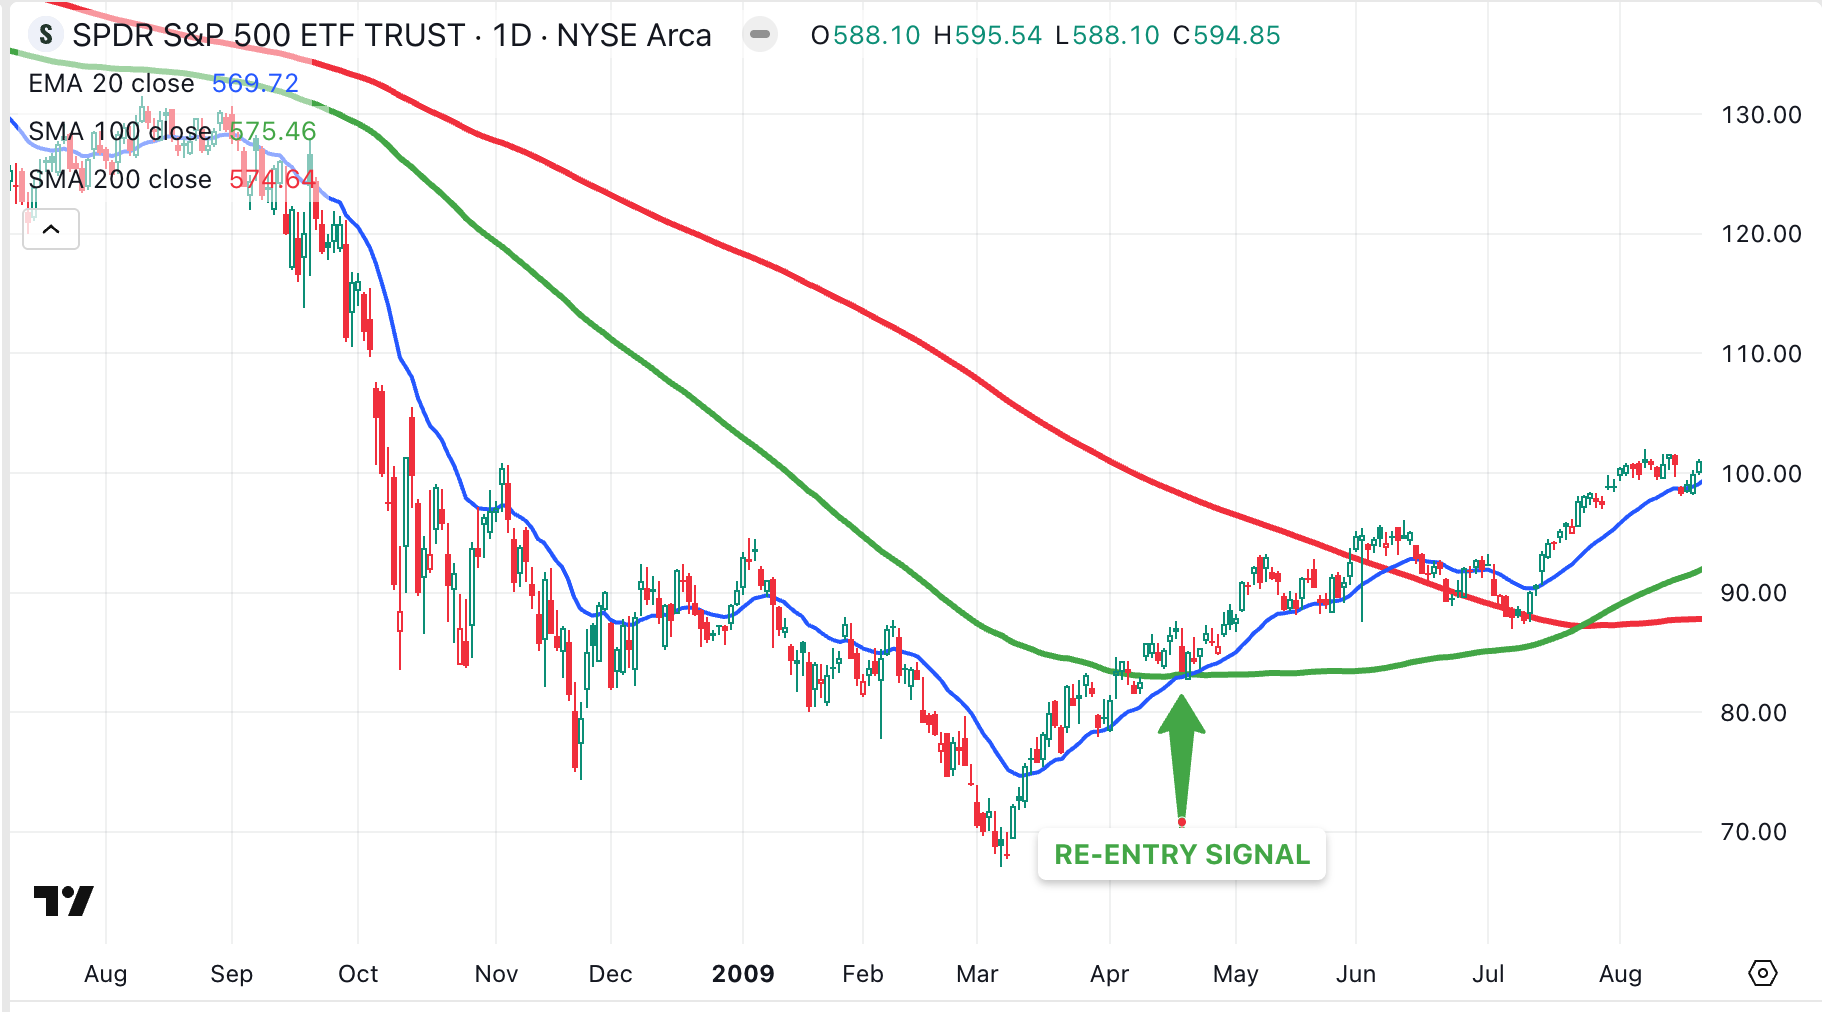
However, the EMA(5) would STILL be below the SMA(200), so the portfolio would exit the market again a week later!

Here is the result when these signals are used in a simple portfolio's hedge rules from Mid-2007 to Mid-2008:
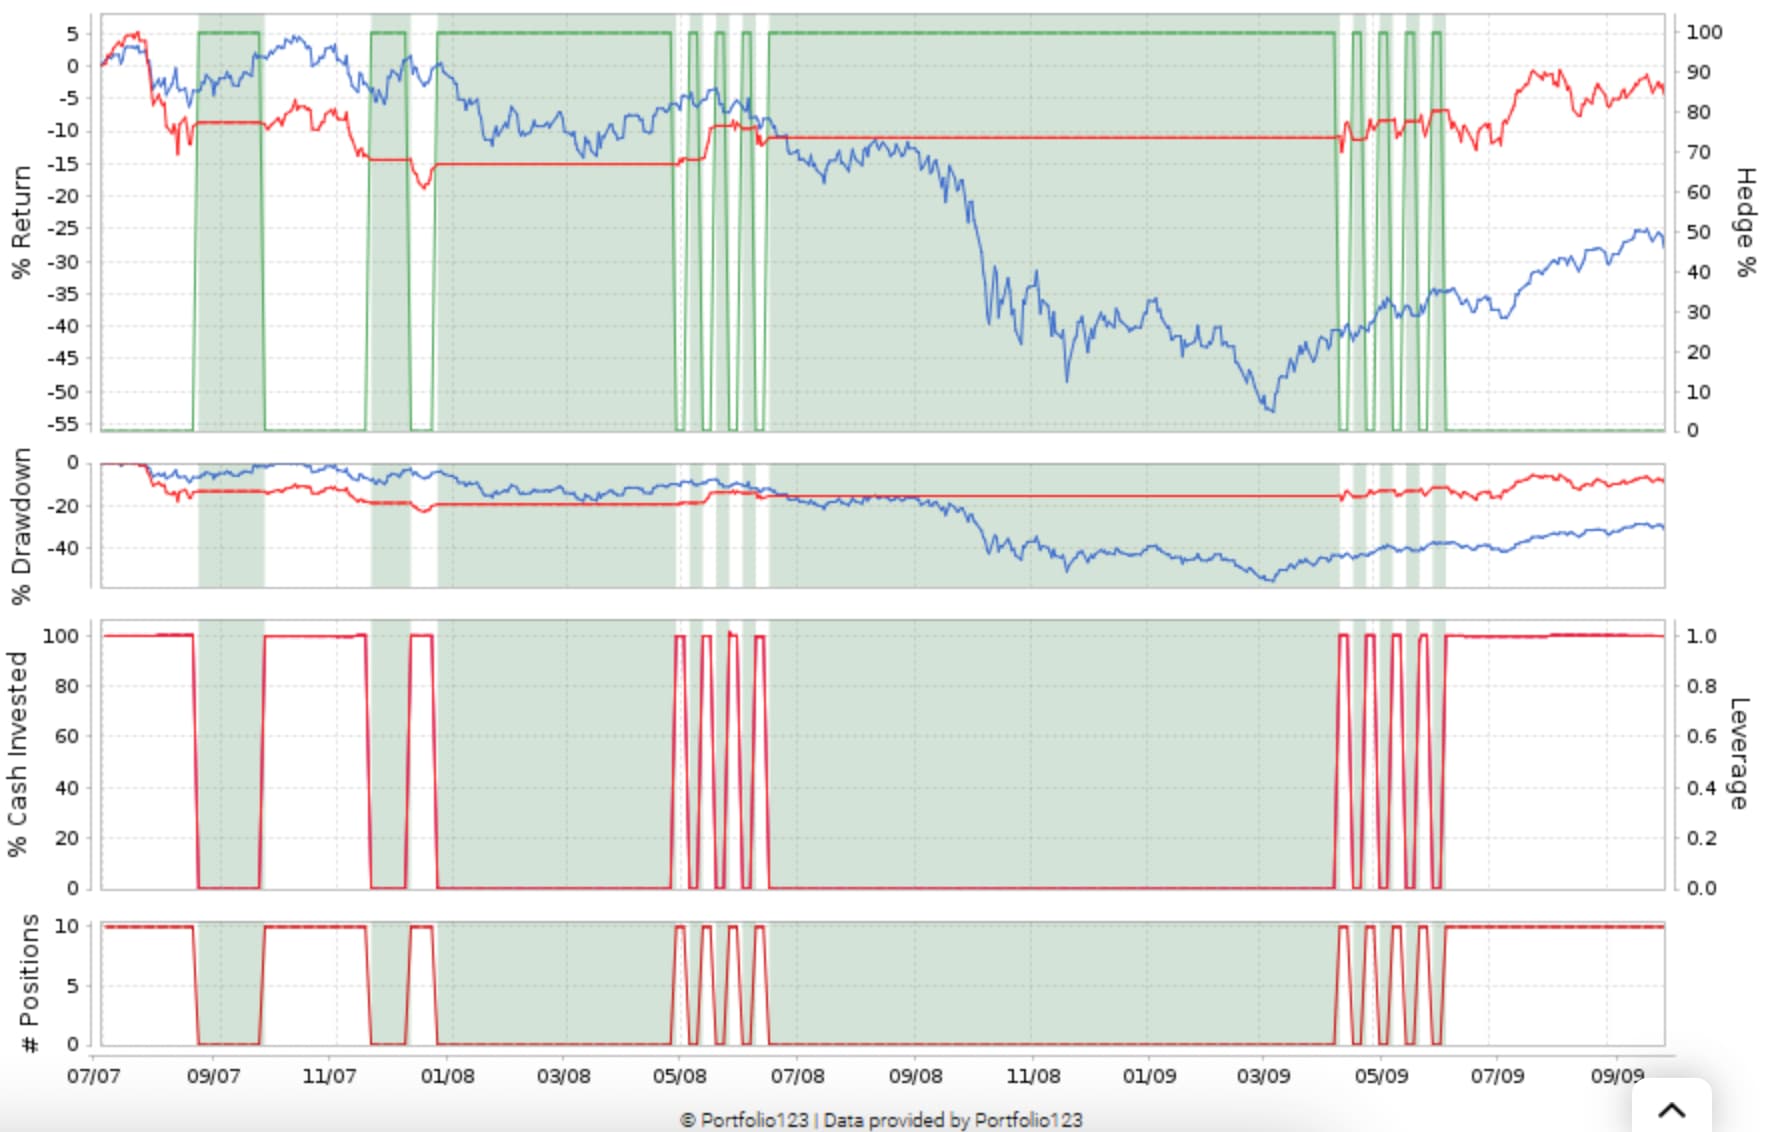
Obviously, this is not a desirable outcome with the weekly whipsaws in and out during the periods in April to June 2008 and 2009 when prices are above the 100-day SMA but below the 200-day EMA. Is there a way to resolve this quandary and make the strategy work as intended, or is this not possible?

Many thanks for any insights shared!

Chawasri

Hi Chawasri,

The issue you are hitting is that SELL rules are executed as a logical OR which means that any one being True results in a sell. To get around this requires a more detailed conditional execution where you combine statements into one line that will execute as one statement.

The logic is quickly going to get complicated, so pick your favorite decision tree or truth table format and diagram out the decisions.

Using your example:
....If EMA(5) < EMA(200)
........ TRUE (If EMA(5) < EMA(100)
..........................TRUE
..........................FALSE)
........FALSE

Now take the logic you just laid out and implement it using nested EVAL statements. I strongly suggest in small increments with testing as the nesting can be error prone.

Cheers,
Rich

Hi Rich,

I am familiar with nested Eval statements, however, I cannot see how my issue could be resolved by this approach. Can you offer more detailed examples? Thank you.

Can you use the crossover and crossunder rules? So that the trigger is crossing under...but not just being under? But you will still run into problems because these rules do not cover all situations.

You will have problems such as what if 100sma is below 200sma? Do you sell because it crossed 200sma? Suppose yes. So price crosses below 200sma and hedge. But then price rebounds like crazy and goes up. What is entry signal? The 100sma was under 200sma so you never crossed over it.

This is the problem where you have different buy and sell rules that use different variables. You have to consider many different circumstances and use eval rules to cover them all.

  1. ema 5 below 200sma (a. when 100sma is above 200 b. when 100sma is below 200)
  2. ema 5 is above 100sma (a. when 100sma is above 200 b. when 100sma is below 200)

Taking a step back, the whole sell construct is a series of rules connected by logical ORs. Any single rule evaluating as TRUE will trigger the sell. The construct is:

(If Cond1 = TRUE)
OR
(If Cond2 = TRUE)
OR
(If Cond3 =TRUE)
OR
(If CondN = TRUE)
OR
(If CondHedge = TRUE)

All of your Hedge logic needs to be contained in CondHedge. It also needs to be written so that the actual decision to sell evaluates to TRUE at the end. This may involve inverting your thinking to keep to the path evaluating as TRUE -- hence EMA(5) < EMA(100) while the initial thought was EMA(5) >= EMA(100). Be attentive to the Equal condition.

The suggestion to map out the logic is due to it getting complicated fast. I tend to use pseudo-code because that is my background (math degree, four+ decades in IT) as my preferred analysis approach.

Cheers,
Rich

Thank you for the ideas Rich and Kurtis,

You have inspired me to think of this in terms of 'sets' of conditions, including concepts like union, intersection, and complement. I will try to get creative with a third condition for the exit and entry, such as Close(0)>Close(X), or maybe that the rate of change of the triggers must meet certain conditions (climbing or falling).

Kurtis's idea about using CrossOver/Under may be a simple way of addressing this challenge, but I suspect that since market conditions vary so widely, a specific number of bars may work some times and not at other times.

Also, the moving averages I used in the charts above are simplified examples of my Exit and Entry rules in the hedge function. I'll have to use the same type of ideas and apply them to binary Custom Series signals. Thanks for the ideas!

This might be useful:
https://www.portfolio123.com/doc/doc_detail.jsp?factor=FlipFlop

Hi sglinski,

Yes, the Flip-Flop function looks very intriguing! I'll dig in and report back which approach works best. Thank you.