I’m new here (first post) and very much appreciate everyone’s input in the forum as well as many different snippets of code that people have posted showing even a newbie can come up to speed.
Here’s my problem.
I’ve taken the advice of multiple people and created a universe: Nano-Small of Tradeable Stocks. MedianDailyTot(126) > 50000 & !IsMLP & !Universe(OTC) & !IsUnlisted & MktCap>29 & MktCap<2000. (10yrs)
Then I went through and added as many well-educated and uncorrelated long factors as I could come up with weights 2.5 or 5 across 35 Factors against my universe. (RankLong) (10yrs weekly)
Then I built a simulation (25 positions equal) with Simple entry-exit rules. Entry: StaleStmt=0 & DaysFromMergerAnn=na & Rank > 99 Exit: RankPos > 50 and NoDays > 5 and StaleStmt = 0
Then I did the same thing for shorts and went through and added as many well-educated and uncorrelated short factors as i could come up with weights 4 across 25 Factors against my universe. (RankShort) (10yrs weekly)
Then I built a simulation (15 positions equal) with Simple entry-exit rules. Entry: Rank > 99.5 Exit: RankPos > 30
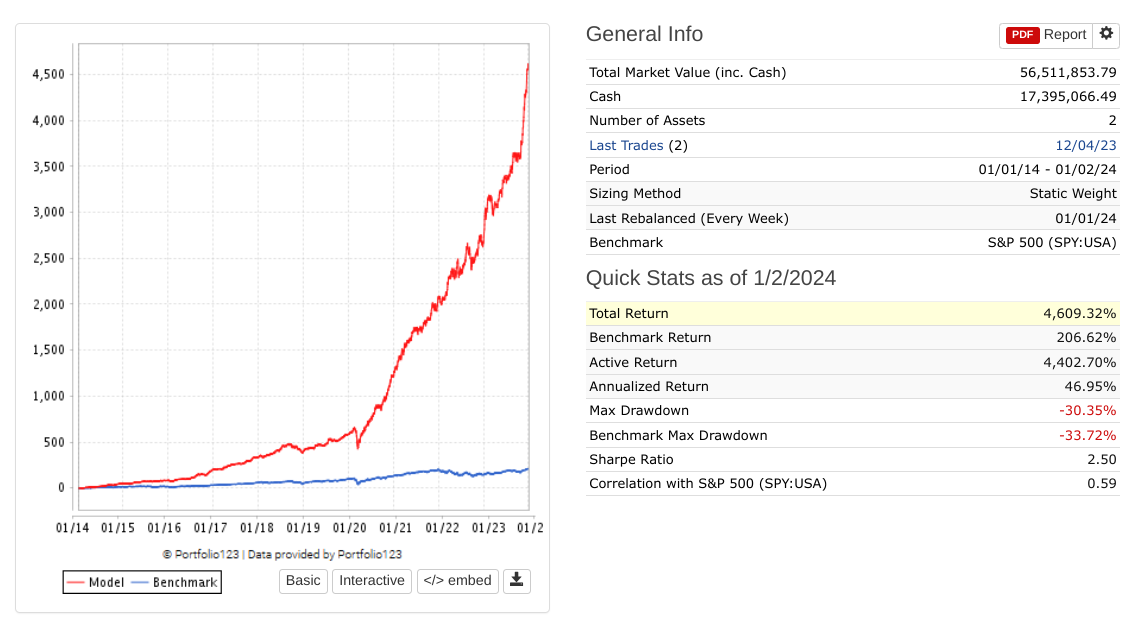
Then I stuck them in a book (75/25) with and walla 2.5 Sharpe! (See Image)
Now my problem is I don’t trust anything I just created as once I did this exercise I determined this must be curve fit as I didn’t trim my universe for outliers (just found out about that) and the performance is weaker against other universes e.g. Prussel 3000, Easy2Trade etc. (oops)
So what do I do next? (Recommendations?)
Is it curve fit? (Recommendations?)
Should I create sub-universes and then run the exercise again but use Mod(StockID,5) and find commonality amongst all 5 sub-universes?
For sub-universes how many stocks should I look for in my simulations; I am already at ~2k with my current universe and am afraid of getting too small in the sub-universes for 15-25 stocks.
What within Portfolio123 should I use to trim my outliers (e.g. not Excel and Not Python)? e.g. limit the universe via between(FRank(“Close(-6)/Close(-1)-1”) ,0.25,99.75)? // What should the FRank formula be, and what should be the bound on outliers?
If I am looking for a Portfolio of ~$1M should I reconsider other aspects of the Book?
Thanks all hopefully this also provides insight for others building with Portfolio123.
Welcome to the P123 community Tyler. You’re jumping into this very aggressively.
In regards to picking a benchmark, best practice is having as least some overlap with the universe you are selecting from. With a $2B market cap limit the S&P500 is a bad choice as the smallest component is many times that.
My guess is that a large portion of your short positions are unshortable and as a result the returns not reasonable. That’s just fact for these stocks.
I would say you are not curve fitting with the roughly equal (or double) factor weight. If you were running all sorts of unequal weighting then the answer is yes with what you are doing.
Outliers are rare and generally refer to individual factors or looking to trap data errors. At this point in your education, put your focus elsewhere. Using the FRank statement like you wrote is far too coarse a tool and would eliminate a large numbers of stocks that should not be removed.
Yuval has written a lot on position sizing and trading costs. Please take a hard look at those. With a position size around $50k and a medium minimum the same you have a problem with taking multiple days to accumulate a position.
What within Portfolio123 should I use to trim my outliers
What I have been doing is to use excel to find the best performing stocks from a simulation, copy out top 50 (or whatever works for your sized universe), copy the list to the “Restrict Buy List” and re-run the simulation. Probably not the best method, but makes me feel more confident if the system still performs well without the top performers.
it on the out-of-sample period 2001-2010
drop the shorts and see what drives the performance
try different start periods or rolling test to see if there is any timing luck involved
see the distribution of alpha each year to see if the models holds or if its just one or two years that drive the performance
I usually use Mod(StockID,5), but I adjust the rank < x since each sub-universe is smaller, the turnover will increase dramatically.
And definitely try AlgoMan approach. With a test of just 25 stocks, the outliers could be a big part of the performance.
Wycliff’s has some great ideas. I have started a different thread highlighting what a great idea it is. There are a lot of other ideas in this thread that should be expanded upon and I appreciate that my posts are still long. But machine learning, for me at least, needs some context and even the occasion code or equation. Is that weird to think machine learning might require some code, or math or a logical progression of ideas? Anyway, my apologies for not moving my post quicker.
I’ll need to upgrade to get the 2001-2010 period, so it’s on the to-do list, until then, I’ll need to limit it to the last ten years.
After re-running everything in different universes using Mod(StockID,5), actually, the longs are fairly robust, but the shorts are really finicky. Dont know if others have experienced the same.
Thanks for recommending different start periods. I’m assuming that would be different weeks to start the simulation? I’m unclear on how the Rolling Backtest is different and what advantages it provides. I probably just missed it.
Yes, I’ve just recently done the same with Mod(StockID,5), but when I expand the universe via lower Rank, I end up with worse performers overall. While it may show robustness in the ranking methods, it doesn’t give a hint as to what the reasonable OOS performance should be. Quandry indeed.
It’s for my own sanity. if I remove the best trades from my simulation and it still performs to my expectations, I was not just “lucky” when I ran my simulation or chose my Universe.
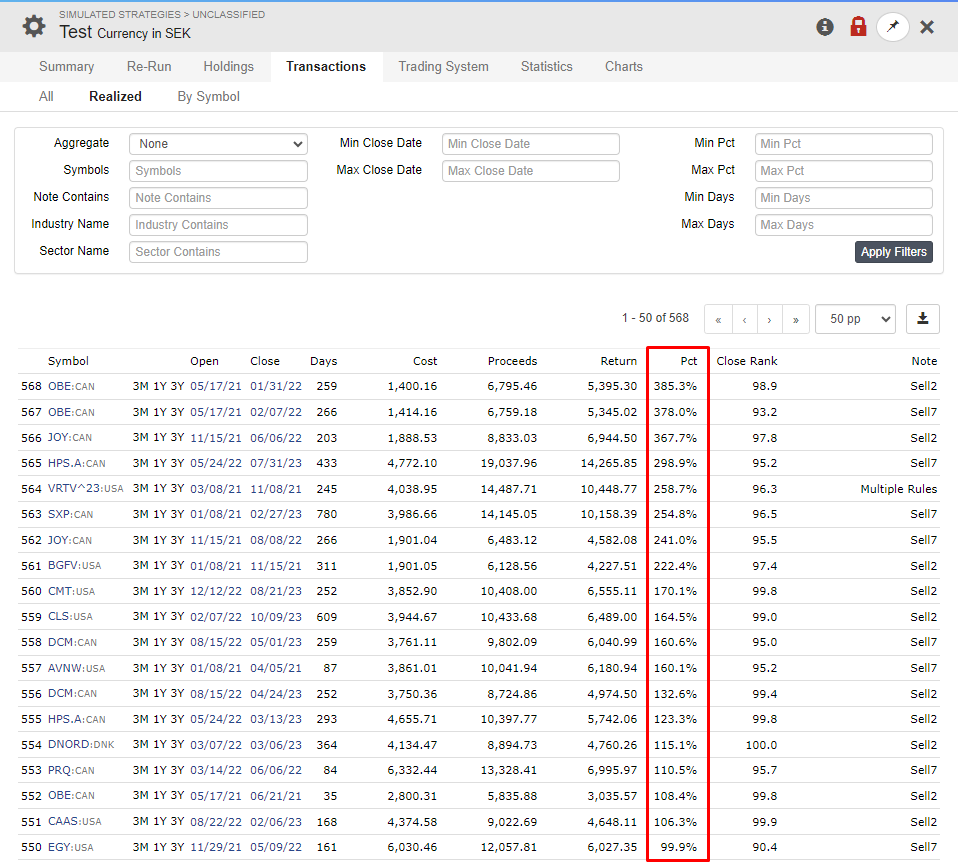
I remove the Tickers with the highest pct from my next simulation -
I included minimum price on my performance tests within the ranking system but did not include it in my simulation strategy.
I’ve found (hearsay) that stocks >0.5 perform better for my factor longs, and stocks > price 3 perform better for shorts. That was not part of my model yesterday, but I uncovered it when breaking up the tests into sub-universes.
I’m thinking I’ll need to incorporate minimum price either a) within the universe and have different universes for longs/shorts or b) put it into the buy rules. Thoughts on the right path?
I am seriously looking for how to accurately model impact, transaction costs, and then ranking of stocks’ expected return due to trying to work with ~$1M portfolio. Does anyone have sample code for implementing the above blog posts to optimally address market impact, transaction costs, and expected return? Does anyone think that the universe sample MedianDailyTot(126) > 50k needs to be bigger to address $1M portfolio with 25long/15short at a book of 75%/25%) or that a different liquidity measure should be used? Thoughts?
I didn’t list it in the initial post, but I’m using Commission = 0 USD Per Share, Slippage Variable, Price for Transactions Average of Next High, Low, and 2X Close, assuming Interactive Brokers. As well as Leverage = 0.33, Margin Carry Cost = 7.8% Min Maintenance Margin = 35.0% for the Shorts. I don’t know if that matters to the community.
I don’t have any code or great ideas to address the market impact estimation questions.
I’ve side-stepped the issue by defining the universe I use as NOOTC, $200k median, and less than 1% spread. Quite a bit more liquid than the one you are using. There are no market cap limits, but the lowest market cap that I am currently holding is $165M and the largest is $100B.
One point to keep in mind about medians is that half the days are less than that value. Sometimes quite a bit less. I remember the shock when posting transactions that my $8k order was 7% of the volume that day which was 20% of the median.
My general feel from this discussion is that you are diving too aggressively into this and skipping a lot of steps because of the power of the tools. Back off and take your learning in smaller steps.
I would drop the short system!
Backtest with a 20% TWM position (all your long strategy + 20% TWM in one book) and see how the cap curve looks like, my best guess it does not look much worse.
Do not trim your outliers, they are part of the distribution (some strategies only live on outliers, pretty much all trend following strategies…)
also I would give it some Out of sample period, (OOS) period, I would not apply the whole 1 Million at once, give it some OOS first, wait for OOS or at least scale in slowly
→ you will get experiance trading small caps with a lower amount of money first, scale in step by step…
Also do not ditch it because you can not trade it with one million but maybe with 500k Use it with the 500k and develop another book for another 500k to scale
If your portfolio gets really big and you hit the wall scale into scalable models with the amount you can not allocate to small caps…
(for example the free buffet strategy on designer models).
Well I went down a rabbit hole of beating the heck out of my system from different universes/sub-universes etc. In the case of the top 50 impacting performance it definitely does, moving from a Sharpe of ~2.0 for Longs to a Sharpe of ~1.3 without the top 50 when using 25 stocks from the universe.
Thanks Judgetrade. Indeed, this provides a better performance as a straight hedge; I’m also looking for a way to trust a timing method with TWM. e.g. USSLIND
I’m very hesitant to trust timing systems as they always seem to evolve to account for the latest possible problem (e.g., 2008 crash, flash crash, COVID crash, etc.), and I’m deathly afraid of curve fitting due to losing a serious portion of my portfolio with curve fit strategies in the past; I’m curious if someone has a method that they would be willing to share regarding timing and TWM that has been successful and they believe to be useful OOS.
That being said, @danp did you ever discover if Books account for slippage/transaction costs as incorporated within the SS so we don’t need to factor for those costs in the Book?
Thanks for your comments, Yuval; I also found this thread response to be exceptionally helpful in case someone else goes down this rabbit hole in the future: Which ranking systems do you use? - #10 by chris319 Look for test_user’s responses, which are excellent to identify curve fit problems.
For reference:
My Rolling tests look great, with very small rules and mostly Ranking systems.
My subuniverse tests look decent Mod(StockID,5) if I account for Rank > x due to the smaller universe.
I did not trim for outliers in the universe, but I did add minimum prices to the universe.
I’ll be running 2001-2010 in Feb sometime due to increasing my subscription.
Short is an open trade study from a Puts/Shorts perspective, Market Timing Problem, and Potential to Hedge with TWM. Again, I’m looking for the Greatest Alpha with the Lowest Drawdown that is tradeable and has similar performance OOS.
Finally, as listed above, cutting the top 50 stocks from the performance hampers performance significantly but is still above the benchmark. As such, I’m inclined to believe it’s still okay. Thoughts? I think I read somewhere that the top 1% accounts for ALL the alpha, but perhaps I’m misstating the quote.
Thanks to everyone for your responses; they’re very much appreciated!
you should ask yourself, what happened after 2020, the curves of all the profitable strategies posted on this site follow a normal upwards standard deviation until 2020 then the US market bounds off into space, the graph at the beginning of this blog, the trajectory is correct for a long term (profitable) portfolio of two stocks, if you add 20 stocks to the same port, that annual return drops off a cliff, diversification is about reducing risk and returns.