Hello, I created an equation for calculating Altman Z-Score. Does the following look correct? I am not sure about the use of IncBXorAdjCSETTM. Any obviuos errors? I tried it out and it seems to work somewhat but not sure how accurate it is since I cannot find a way to correlate (I don’t subscribe to YCharts, etc). I am using TTM since it might make it easier to compare different years to see if a company is sliding downhill. I appreciate any comments.
Hi David,
Retn%TTM is for Retention Rate, not Retained Earnings as required by the Altman Z-score. I am not sure P123 has Retained Earning factor directly but how about using (IACTTM-DivPaidTTM) instead?
Also the proper use for P123’s ranking system is not to set a single formula as you tried but rather to create a ranking system and in it make a node (stock formula) for each of the T1…T5 Altman formulas and then assign each node a weight. Small adjustment is needed because the Altman score adds up to 7.5 while the P123 ranking weights must add to 100 but that change is easy: For example instead of a weight of 3.3 use 44% weight, and so forth.
Cheers,
Zvi
Hi Zvi,
thank you for the response. I appreciate it.
I will try using IAC-DivPaid and compare. In looking at the definition for IAC, this makes sense.
I used Retn% because the definition says it 'represents the percent of quarterly earnings that have been reinvested into the company. It is calculated as 100 minus the quarterly Payout Ratio. ’ So if it is 100%, then if multiplied by income, that would be the amount of money that would go directly into being retained (I am assuming that is the same as reinvested) for that period (I guess maybe not).
One other question on ZScore is my impression was that all previous retained earnings are supposed to be used as well (at least that is how I am interprerting the definition). Any comment?
Concerning ranking, I think I was misleading on what I was trying to do. I am using FRank and FOrder in my rule set as well to easily see the low Z-Score companies but my real reason is to just have a ZScore<3 rule to weed out any companies that are on the fringe. I read that a score less than 3 is not good and to stay away from companies that are less than 1.8.
Anyway, thanks again for the input and I will try your suggestion.
regards,
David
Zvi,
Your suggestion gave me more restrictive results, which is good.
I am using this now as a new rule, with a value over 2, in order to weed out marginal companies.
It minimally impacted my overall results so a good tradeoff.
David
Hi David, you still need to use a ranking system built the P123 way for best results.
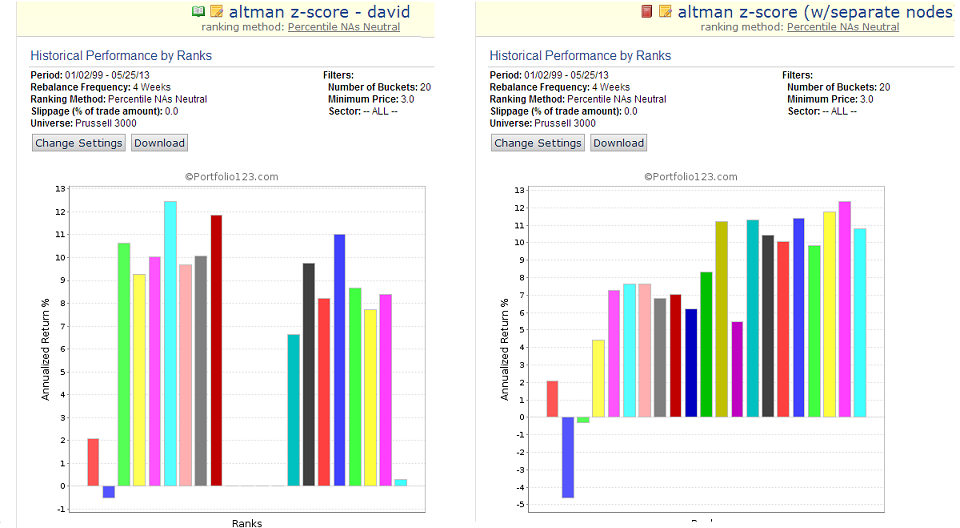
To demonstrate I created two systems - one from your formula (still substituting the retained earnings factor) see [url=http://www.portfolio123.com/app/ranking-system/186619]http://www.portfolio123.com/app/ranking-system/186619[/url]
and my implementation in a ranking system using a separate node for each parameter, see: [url=http://www.portfolio123.com/app/ranking-system/186588]http://www.portfolio123.com/app/ranking-system/186588[/url]
Below you can see the performance charts of each, using the Russell 3000 as a universe(Altman requires that you avoid junk stocks). I think that its pretty clear that with the proper ranking system build, stocks with medium to high rank (2.5 out of 7.5 in Altman) are good for business, while stocks with low rank should be avoided for long strategies.
Cheers,
Zvi
Zvi,
Thank you for doing additional work on this, I was not really expecting it.
I will look at your suggestions and learn from it. I am already using a Quick Rank for the screen and am not sure what the effect will be on this addition. My screens are written around the Piotroski method, for earnings estimates and also price momentum. Each of these screens have their own ranking methods. I made my earnings estimate screen public so you could see it yourself if you like. userid davidbv
Concerning the use of Z-Score, my understanding was that it was originally created not so much for ranking to select stocks but to give an indication if a company had a high likelyhood of filing for bankruptcy. If the score was less than 1.8, for instance, the company had a high probability for filing in the next 12 months. A suspect company is between 1.8 and 3. Above 3 is clear. I could see where ranking can help but my use of it is more to insure I am not making a big mistake ratheer than to help find better stocks. I am using this as just another rule in three screens by screening for 2 or better. It was suggested to use different timeframes to see the trend so I could look at the year earlier using PTM (not sure if this will work for all the factors, though)
The equation I stored in custom formulas is (As I said in my earlier email, I am using your suggestion for IAC-DivPaid. This was good.):
I have looked on the web to see if I could get correlation to my results but have not been successful. So I am not sure how accurate that equation is.
I am reading through the many tutorials on ranking, etc in the help section. Learning a lot. I am still trying to figure out when it makes sense to rank or just use go/no-go rules for screens. There is kind of an art to this to figure out when to use them in the appropriate fashion for best results.
I appreciate your help.
David
Hi David, you are welcome. This board has a tradition of helping new users.
Indeed Altman meant his criterion to be used as a negative indicator, i.e. avoid buying lower rank stocks. You can see that my implementation of the ranking system indeed produces much worse results for lower rank stocks then the simplistic formula you were trying. Therefore it seems like a better implementation for the Z-Score.
You dont have to use the score for selecting longs (in fact the performance of stocks that pass the score are much flat). But you can use it as a negative criterion, for example by having the ranking system used not as the Sim’s main ranking but rather using a command such as the following: rating(“altman z-score (w/separate nodes)”) > 35
where 35 (out of a hundred) is about the same as 2.5 out of 7.5.
I looked into using the Altman z score a few years ago. I can’t find my old notes right now, and I only read the thread quickly, but I would comment that
there’s a different Z score formula for manufacturing and non-manufacturing companies. In fact, I would also check that either Z score formula is applicable to financials. A bank is a very different beast to a widget maker after all…
I used the z score as a cut off in buy and sell rules rather than as a ranking system. However, it doesn’t seem unreasonable to try out a ranking system in order to see where exactly the cut off should be.
Well, in looking at the equation again, I see that I did not properly account for previous retained earnings (which I was not including at all). It did not accurately reflect the score for ADP, HP or Sears, for instance. I can not figure out how to derive it based upon the variables provided (for any type of company). I am going to drop this for now in my screens. This was a fun exercise, however. Learned a thing or two.
David