I saw a chart on stocktwits with high beta divided by low beta stocks (performance wise).
It correlates with my 5 Stock portfolios, e.g. when high beta stocks (“risk is on”)
are doing well, my 5 Stock portfolios jump up, otherwise they underperform.
Any Idea to build a market indicator here on p123 in this direction, so we can
backtest this idea?
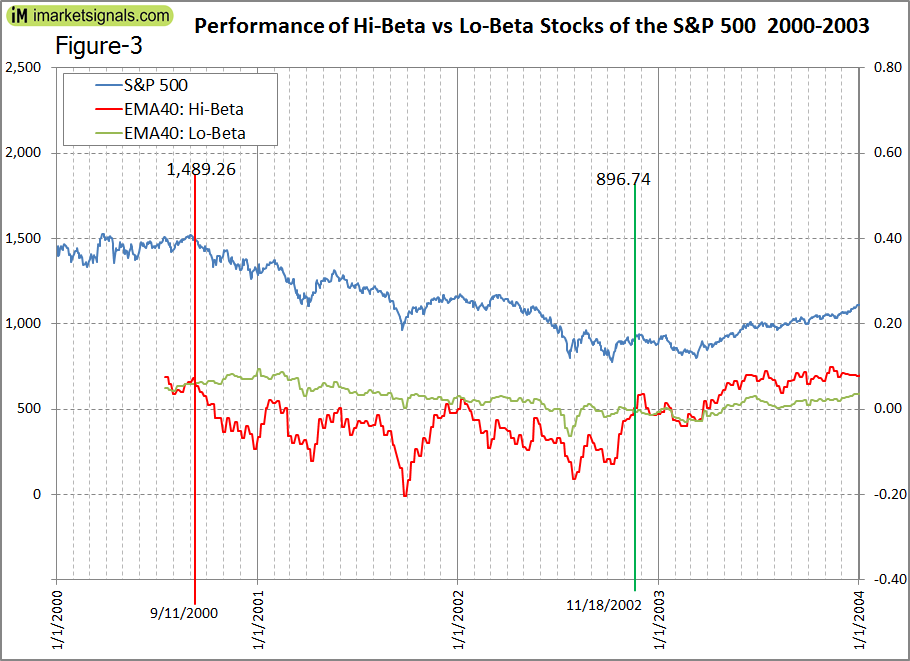
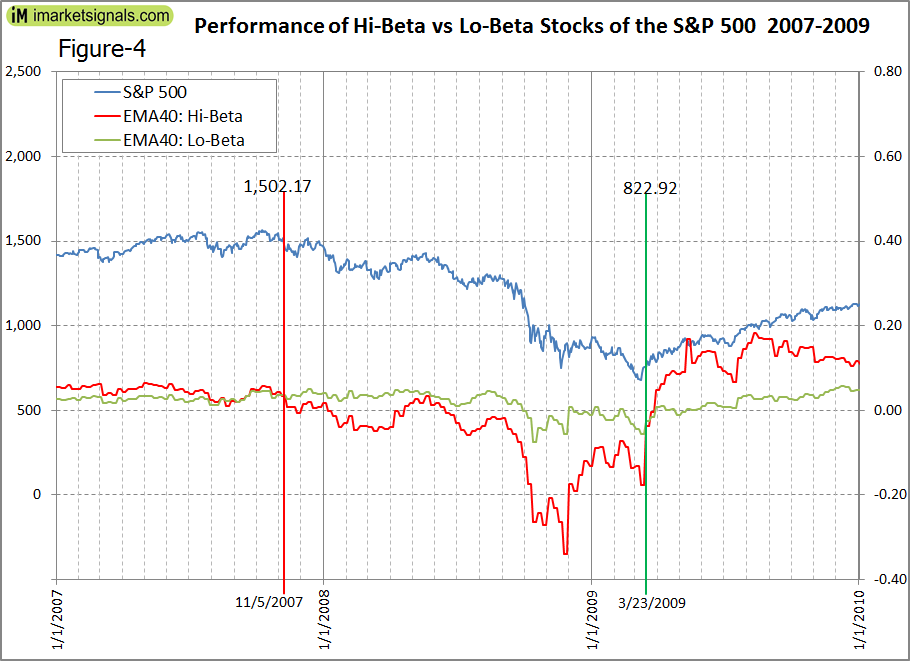
When Hi-Beta stocks perform better than Lo-Beta stocks the model signals investment in the stock market, otherwise investment in bonds.
Andreas Himmelreich noticed that it correlated well with his 5-stock portfolios, e.g. when high beta stocks were doing well, his portfolios went up in value, and otherwise it under-performed. Subsequently Steve Auger of Stock Market Student provided an algorithm to model this.
Hi-Beta and Lo-Beta are defined as the Market-Cap-weighted average of the performance over a specific period of the S&P 500 stocks that meet the criteria “Beta > 1.5” or “Beta < 0.75”, respectively.
Hi-Beta and Lo-Beta are smoothed with a 40-week Exponential Moving Average (EMA), and the signal to enter the stock market is given when the 40-week EMA of Hi-Beta > 40-week EMA of Lo-Beta.
It clearly signaled the exit from the stock market before the two major downturns, in 2000 and 2007, and also the re-entry early in 2003 and 2009. The model would have avoided losses of 40% and 45%, respectively, for the two major down-markets. Figure-3 and Figure-4 below.