Highest Ranks Underperformance OOS

Dear all,

I'd like to take this opportunity to express my gratitude to everyone in the p123 crew for the exceptional service they provide, and to all the experienced and knowledgeable members who generously share their expertise. Your dedication is truly commendable, and I'm certain that I speak for many who may not comment frequently but are avid learners, striving to keep pace with the brilliant minds in this forum such as Yuval, Andreas, Kurtis, and many others. We are immensely grateful for all the invaluable insights and teachings.

Now, onto a query that may seem trivial, but I'm eager to glean insights from our experienced members.

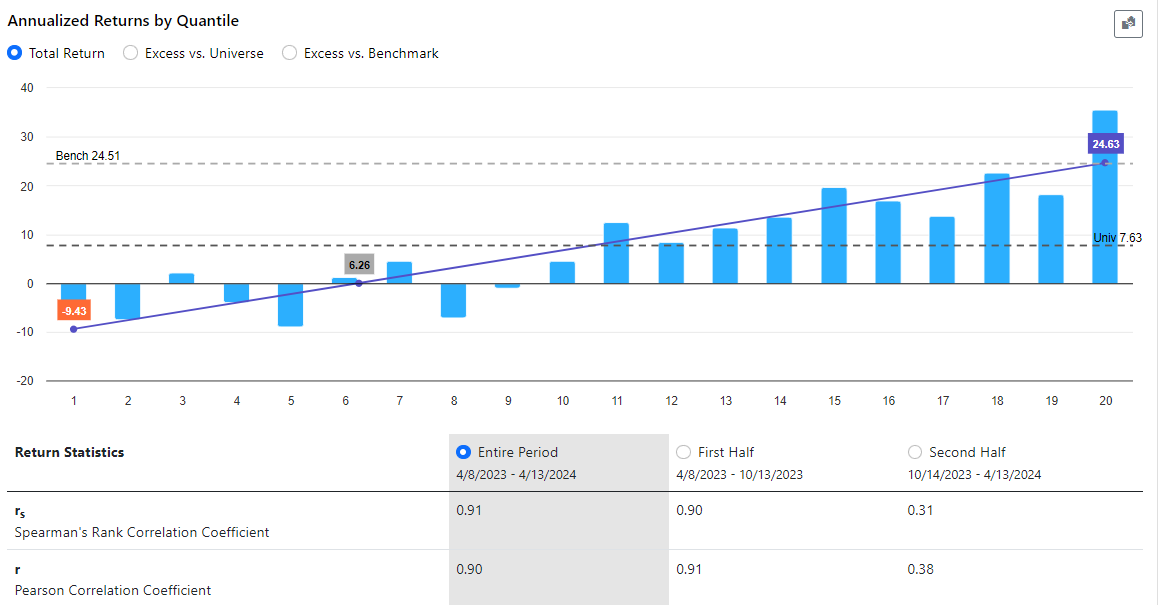
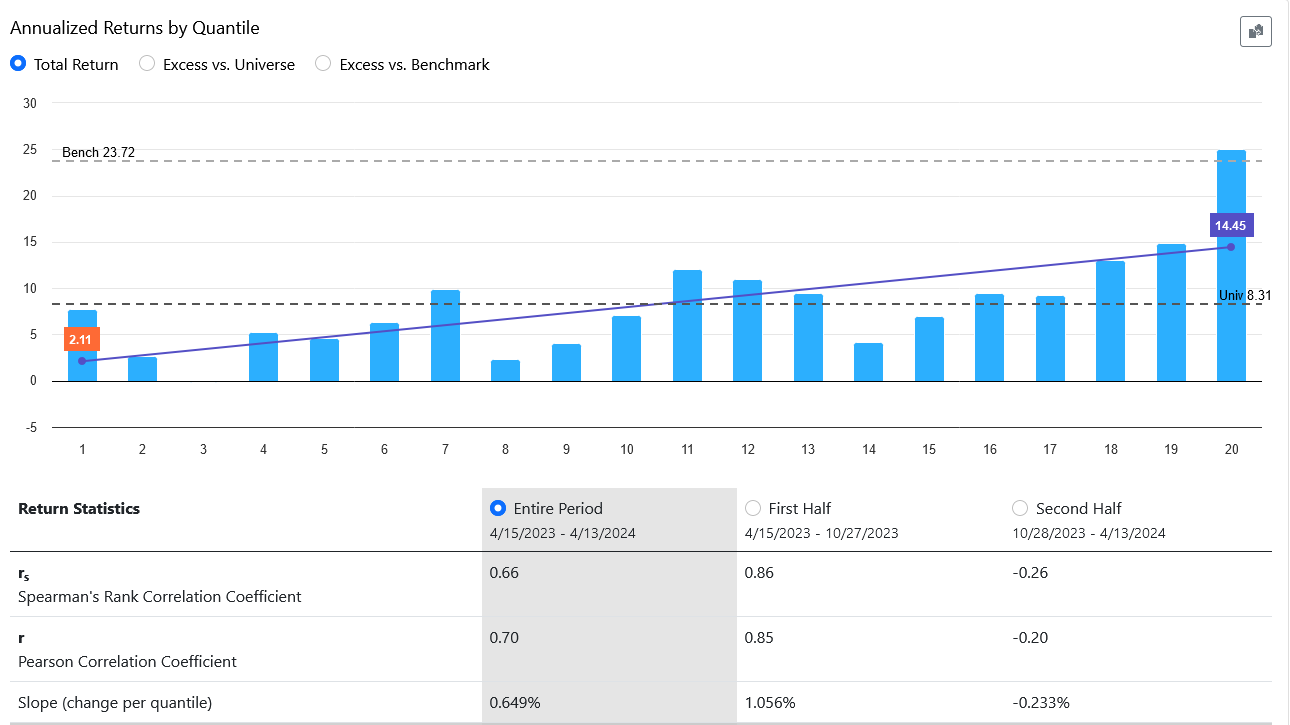
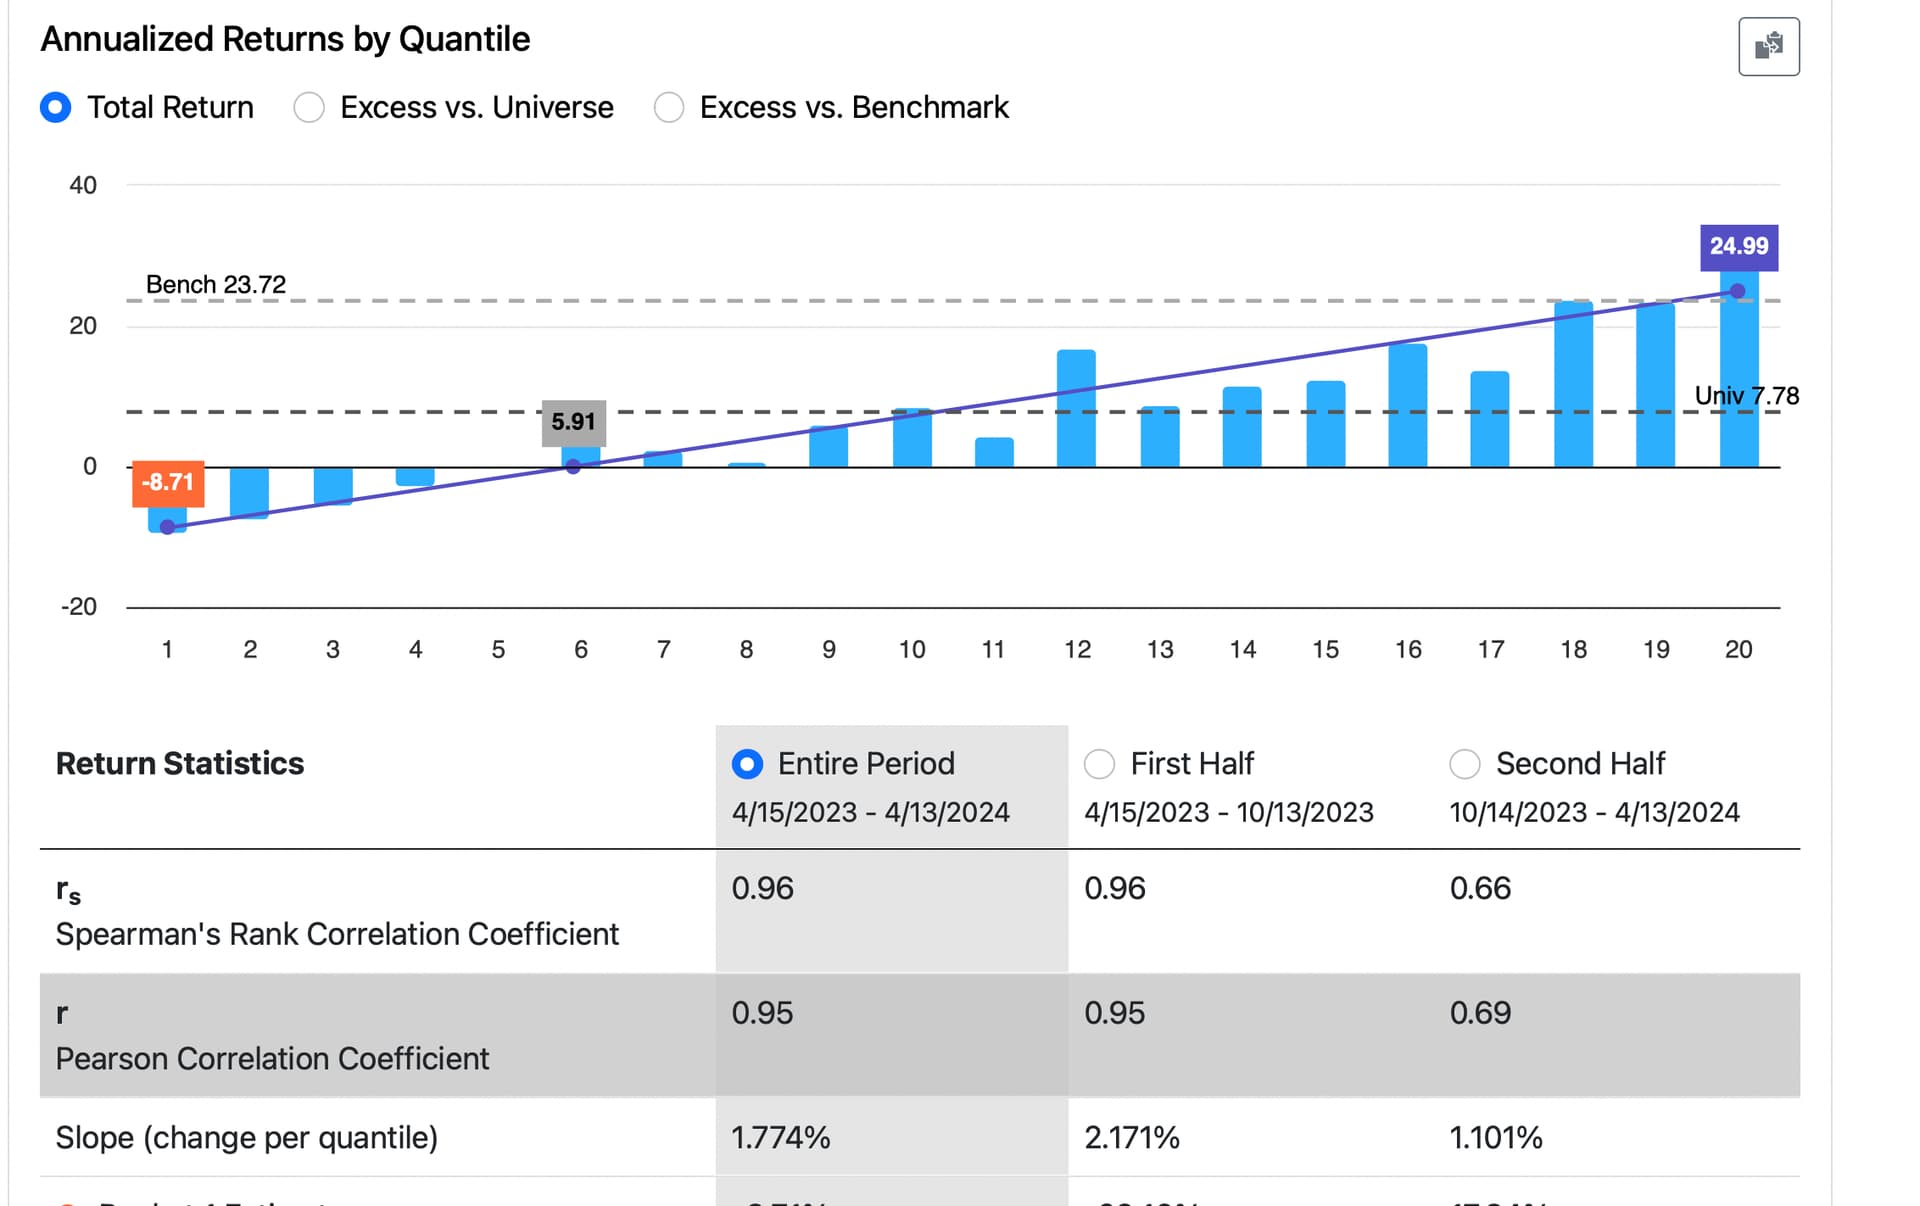
In January 2023, I developed a ranking system to the best of my abilities. After 16 months of out-of-sample testing, it appears that the ranking system is functioning quite effectively based on the slope, intercept, and correlation coefficient analyses.

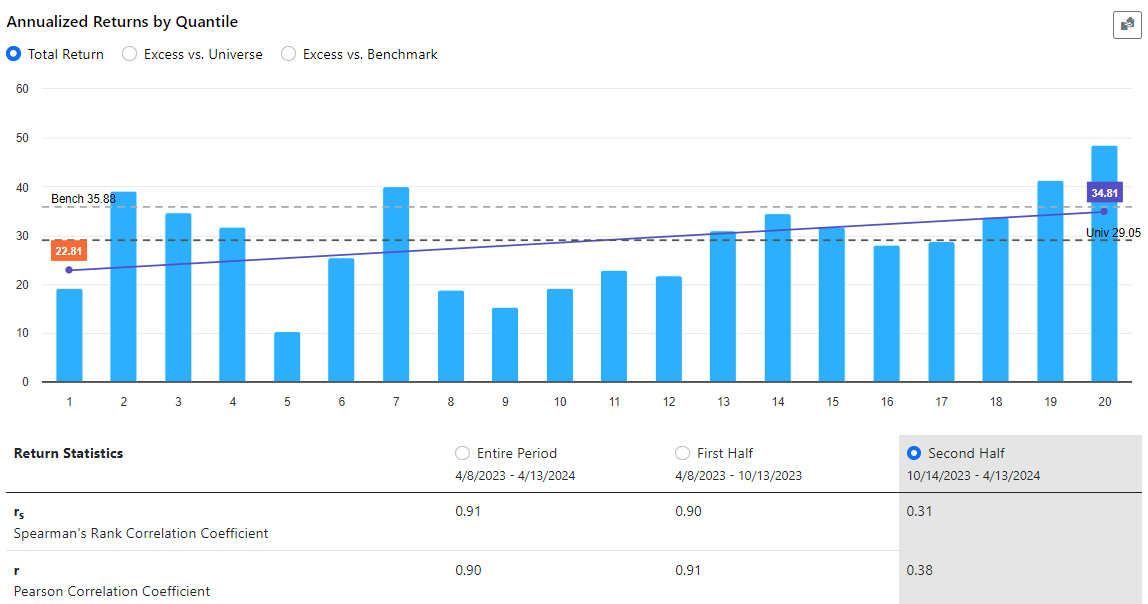
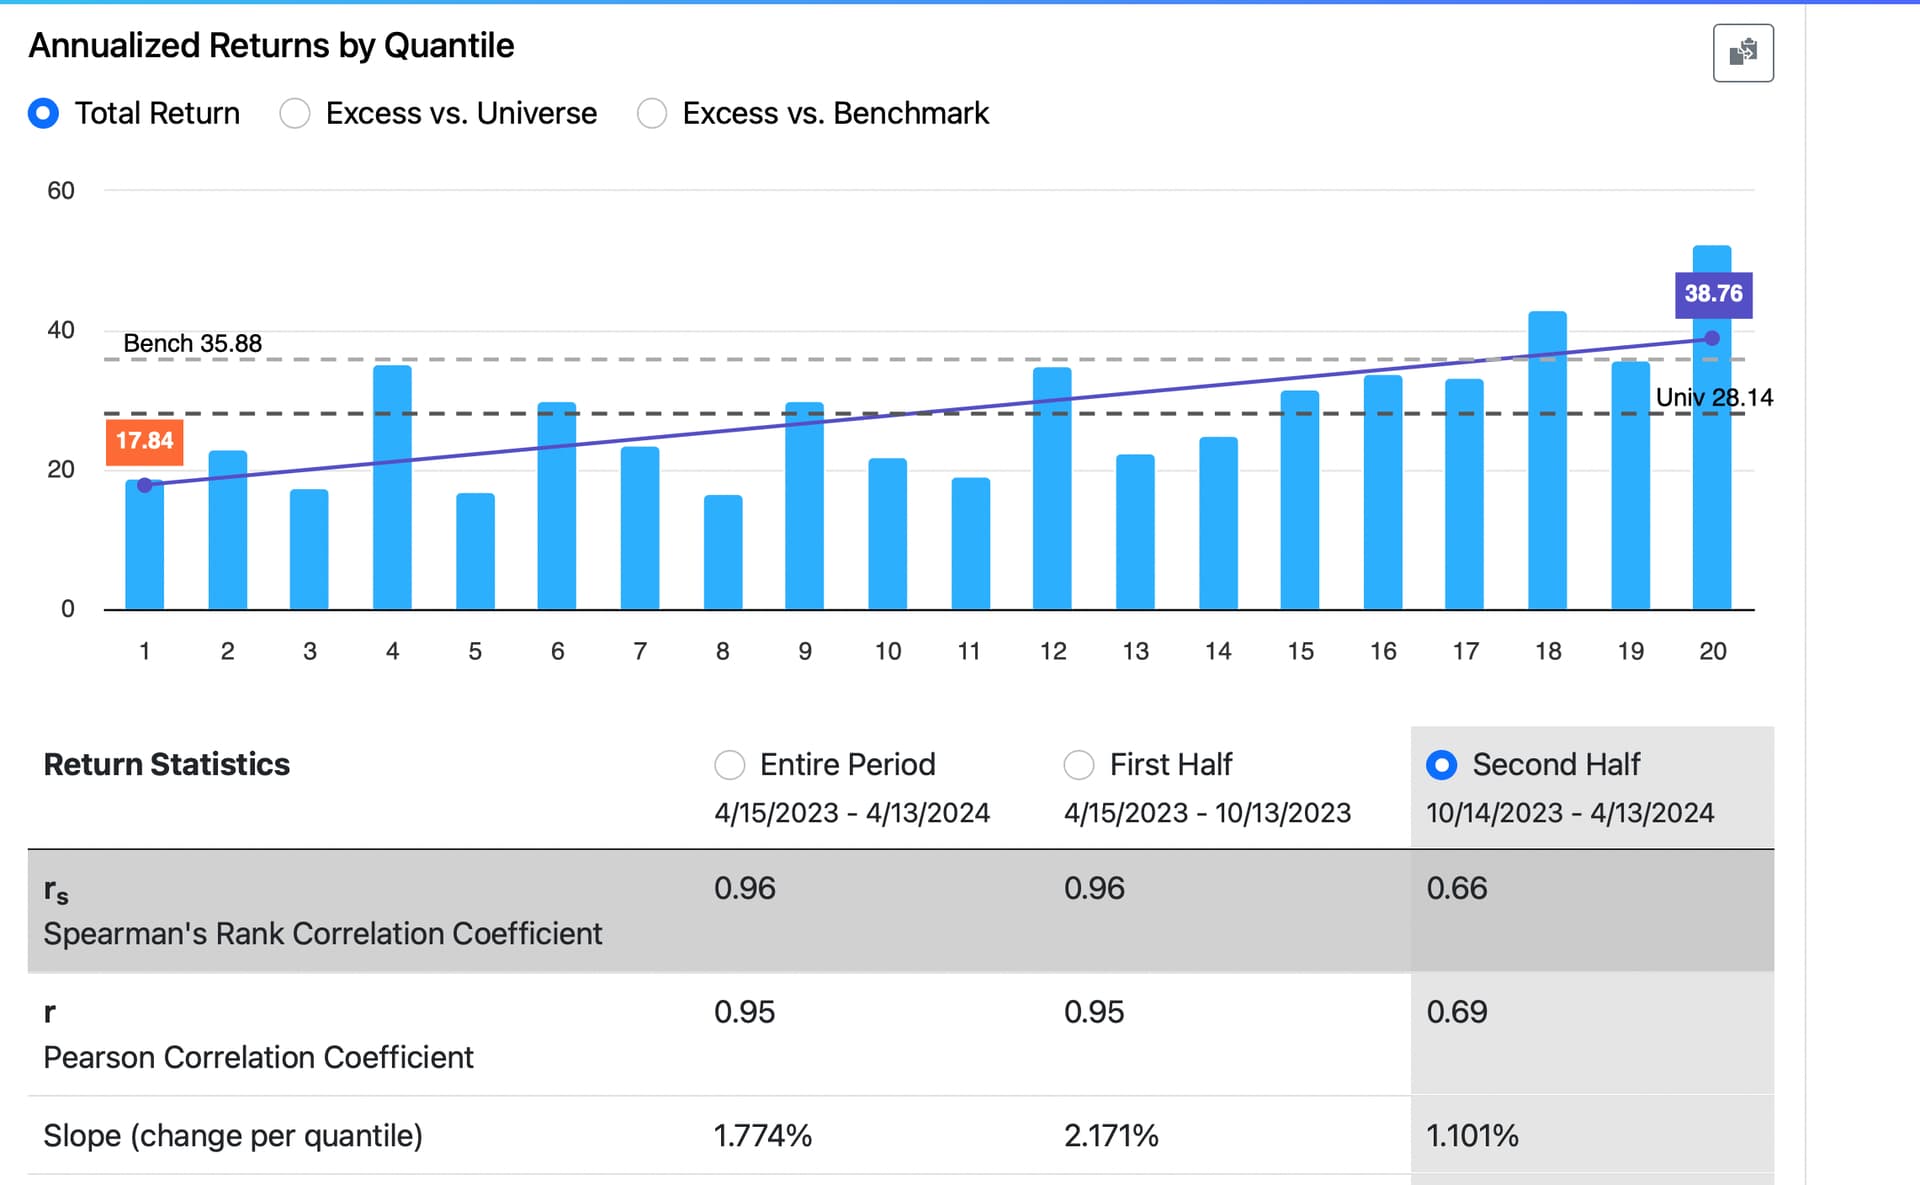
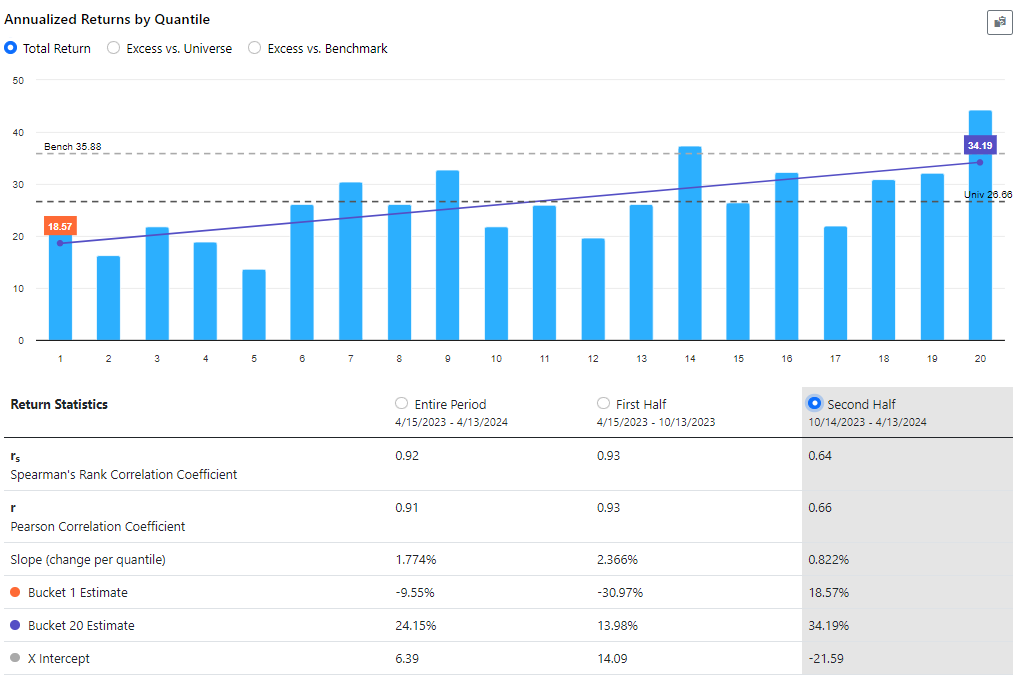
However, there's one aspect causing some concern: the highest ranks (98, 99, 100) are exhibiting significantly lower performance compared to ranks 85 to 97, despite the latter performing exceptionally well during the backtest.

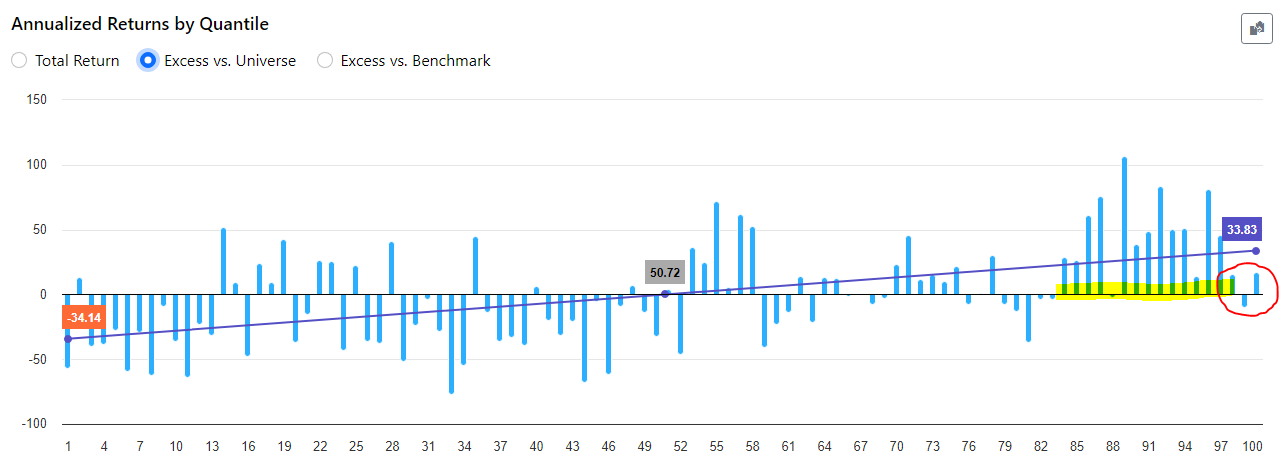
In practical terms, this mean that trading a concentrated portfolio focusing solely on the highest-ranked stocks have not been the optimal strategy. For instance, a portfolio with a broader selection of stocks have outperformed.

My question now is: do you view this as a temporary setback, anticipating that over time the situation will normalize with the highest-ranked stocks once again outperforming, as they did historically? Or do you have concerns about this trend? Furthermore, what steps would you take to potentially enhance the ranking system if necessary?

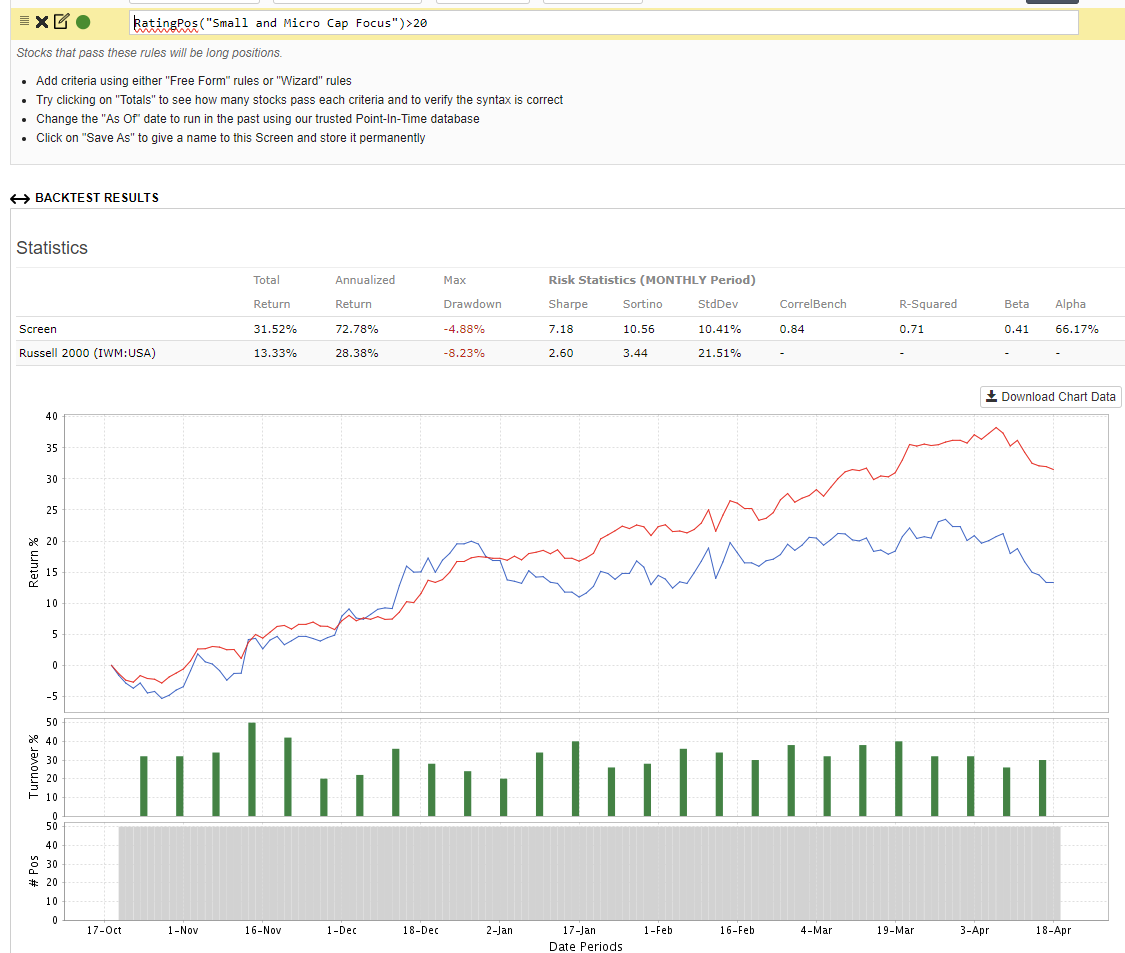
I've noticed that the portfolio123 model "Small and Micro Cap Focus" demonstrates a robust ability to achieve significant outperformance with the highest-ranked stocks, both in backtesting and out-of-sample testing. What factors do you believe contribute to this success?

I'm genuinely thrilled to engage and learn from all of you. Please don't hesitate to share your insights.

Benjamin

1 Like

I rarely use more than ten buckets when testing a ranking system. You're introducing a lot of noise into the results. Your numbers look very good, by the way.

Another tip: if you're running a long-only strategy, there's not much reason to focus on what the bottom buckets are doing or to maximize the overall slope. You'll want to concentrate on the top few buckets.

Hi Yuval,

I greatly appreciate your feedback and encouragement regarding my model results.

You're correct in pointing out that I focused primarily on the slope, assuming it would lead to a more robust system overall.

I've decided to take your advice and shift my focus towards building a second system that prioritizes the top buckets. I'm eager to see where this approach takes me.

Thank you once again for your insights.

1 Like

I wanted to show some of my own results here, because the topic is similar, evaluating OOS results.

When I check my OOS ranking results for the past year, at first glance, the system seems to be doing great in terms of performance of the top bucket, as well as distinquishing between 'good' and 'bad' stocks.

However, looking at the most recent half, I get a different picture (as seen in the graph below as well as from the Spearman and Pearson coefficients).

I would like to say this has to do with the whole AI 'hype'. However, ChatGPT was launched at the end of 2022, so it would seem that that would also appear in the 'First Half'.

Of course, it could be the case that my factors have stopped working altogether. What would be a good approach to see if this is the case or not? Have others experienced something similar?

1 Like

The P123 research process, especially for ranking signals, lacks an essential element: the standard deviation of the signal over time. For instance, in the "First Half" section, you display displayed static average (like slope, universe return, bucket returns, etc.). Then, we compare this to the static average of the second half.

However, this approach has limited utility and largely accounts for why out-of-sample (OOS) results rarely align with historical data, regardless of the quality of the research conducted. Using standard deviations we can come up with both statistical significance AND probability range of outcomes.

To address this issue, we require standard deviations and t-stats. Without them, the analysis can be highly misleading, in large part leading to Marco's lamentations of data mining and poor marketplace performance.

3 Likes

Using the mod(stockid) idea helps a quite a bit!

Victor,

One of the explanations in your case maybe "overfitting". I think Korr has made a good point about using t-stat.

Personally, I only focus on ideas/strategies from research papers with a t-stat of 2.6 (95%) statistical signficance or 2.0 (90%) at the least.

My thinking is that Portfolio123 should introduced t-stat with the future rollout of the AI/ML module.

Regards
James

Edit : it seems like the Spearman and Pearson coefficients in the 2nd half (posted below) is even worse for Yuval. As I learned from a financial spread betting handbook, it is time to use a fine comb and review the system if it stop making profit after 3 and 6 months consecutive. Maybe the market situation has changed and there are other larger institutional players exploiting the same factors/strategies.

Morgan Stanley is an institutional user of Portfolio123 and a few people here (if I remember correctly) are beginning to place their orders through them. (I am not sure if they have access to our books/trades).

1 Like

Victor -

Here are my out-of-sample results for comparison's sake.

One year:


Last six months:

It's been a tough time for small cap strategies.

3 Likes

Would you mind sharing the Universe you are using?

James,

Here is a one-sample t-test of the excess returns for my universe (mild modification of the easy to trade universe) for the top-bucket (20 buckets). This is from the start of funding of my port 11/02/22.

Here are the one-year rank performance test results. This is the only ranking system that I have funded since 11/02/22 (reduced selection bias and no selection bias since 11/02/22). I BELIEVE this is the first ranking system that I used starting 11/02/22 and for sure it is over a year old. I continue to make mild modifications in my ranking system—planning on at least yearly updates which have not been large changes to date..

Jim

3 Likes

Jim,

Thanks for the reply.

It is a favourable Spearman and Pearson coefficients in the 2nd half (high t-stat as well.)

I also quickly run a check on Yuval DM and it is indeed a tough time for small caps. (similar conclusion to the FT post on US small cap - Russell 2000 vs S&P 500)

Regards
James

@ustonapc

I also did a check on smallcaps by excluding the size factor from the ranking system I posted earlier, made quite a difference.

So now the question is: "Why?". I think it is too easy to just say 'ah well, bad time for small caps'.

Two hypothesis come to mind:

  1. Within the small cap space, stocks get influenced more by the increase in interest rates due to refinancing than within the large caps space.
  2. Small caps are deemed to less likely have the productivity gains that come from AI implementation

I tried replacing the size factor with something like isna((intexpTTM - intexpPTM), (intexpA - intexpPY))/ isna(DbtTotTTM, DbtTotA) (lower is better). I also tried incorporating a metric that gives higher scores to technology stocks. Both had worse results for the 'Second Half' than just removing the size factor over this period.

There are better ways to test the ideas above, but this gives me at least some indication that something else must be at play.

Victor,

I have the following observations :

It is true that small/micro caps are more sensitive to changes in interest rates and the economy.

But the last Fed rate increase was more than 6 months ago on July 26, 2023 and the Fed fund rate has since remained unchanged. (how does that impact the 2nd half of the coefficients?)

The recent rise in tech stocks are mainly focus on Big Tech (Mag 7/FAANG - large cap tech stocks).

I don't understand what you mean by there maybe something else at play. Are you referring to the fact that some of your factors are being exploited by other/larger market players?

Regards
James

2 Likes

James -

I'm trying to understand why small cap stocks did worse over the last 6 months. The ideas that I tossed about interest rates and AI seem not to be it.

But perhaps answering that question is too far stretched.

2 Likes

All,

Just a thought about assessing anything (value, growth, small-cap or large-cap). The above examples (including mine) are using ranks, or even z-scores normalized to the week in their ranking systems (as apposed to something like a random forest normalized over the entire training period using min/max).

If you looked at value ratios today would the raw numbers be the same as 6 months ago?

It is also true that interests rates and a lot of other things can affect this. Excellent ideas in the above posts. But also a lot of noise in 6 months of data.

From a "what can I do at P123 to improve my models" point of view, I wonder what P123's machine learning using factors normalized over a long period (e.g, the entire training period) will do.

@marco, one could even incorporate normalization of ranks (e.g., with ranked Min/Max) over longer periods directly into P123 classic if it is not programmer intensive to do so, AND IF WERE FOUND TO MAKE ANY DIFFERENCE AT ALL. I have not investigated this—at all really. And not something I have an opinion on for now.

Just something I have wondered about for a while. @Chipper6 probably presented this idea first in the forum in a slightly different way regarding value stocks not really being a bargain at that point in the market cycle (when he posted). There are probably others who have posted on this that I am missing.

This also could be looked at with regard to previous discussions of regression toward the mean when we are looking at raw values (or values normalized over the training period). In other words, are the value ratios (or growth factors) close to their historical mean now? Ranks will not give you that information.

Jim

1 Like

I noticed pattern running a few strategies with different ranking system.

I have one that I build with the "Small and Micro Cap Focus" ranking system as a base. That strategy has performed ok, but not as good as the other strategies.

As an example, this is the top 50 screener result with the Easy Trade US universe.

If I run the screener and remove the top 20 of the "Small and Micro Cap Focus" ranking system, I get a much better result.

I think that the "Small and Micro Cap Focus" ranking system is great, but I suspect that it's over-used among the P123 traders.

1 Like

Recently, there was an article in FT that discusses possible reasons of small caps underperforming. Partial explanation is how Russell 2000 is constructed and second that private equity has been able to capture best companies and junk left in the public market.

1 Like

Thanks jvj,

I believe this is the article you are referring to.

I posted the screenshot of one of the charts in an earlier thread.

For those interested, pls check out the link below.

Regards
James

It is this: Small stocks, big problems
Sorry, paywalled.

2 Likes

Alphaville is the best part of FT, and it can be accessed for free: How to read FT Alphaville for free

There's of course also the option of using archive.is

(I disagree with the article though: size is IMO not a factor, but a catalyst for other factors)

1 Like