there is also a ton of alpha in borrow fees… higher frequency then short interest and more signal, even on the long side.
also, on 99% of stocks, borrow fees are comparable between brokers.
there is also a ton of alpha in borrow fees… higher frequency then short interest and more signal, even on the long side.
also, on 99% of stocks, borrow fees are comparable between brokers.
i would contribute too
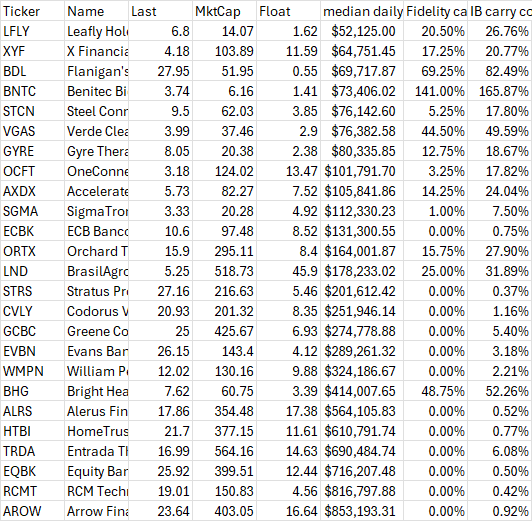
I beg to differ. Below are the short borrowing fees for 25 stocks on November 8, 2023 from Fidelity and IB.
You'll see that they have very little in common. If I had had access to my prime broker, whose custodian is Pershing, back in 2023, I would have gotten very different numbers from them.
The correlation between those two columns is 99.3%… in terms of alpha signal either will do.
Any updates on this data? Lots of signal, regardless of which broker we get the data from.
So I imported weekly historical shorting fee rate (IBKR) data from May 2018 - Today.
Also set up a cronjob to get the live data and import it via the api. The great thing is that the data can be confidently mapped by FIGI. That allows using the data in live systems.
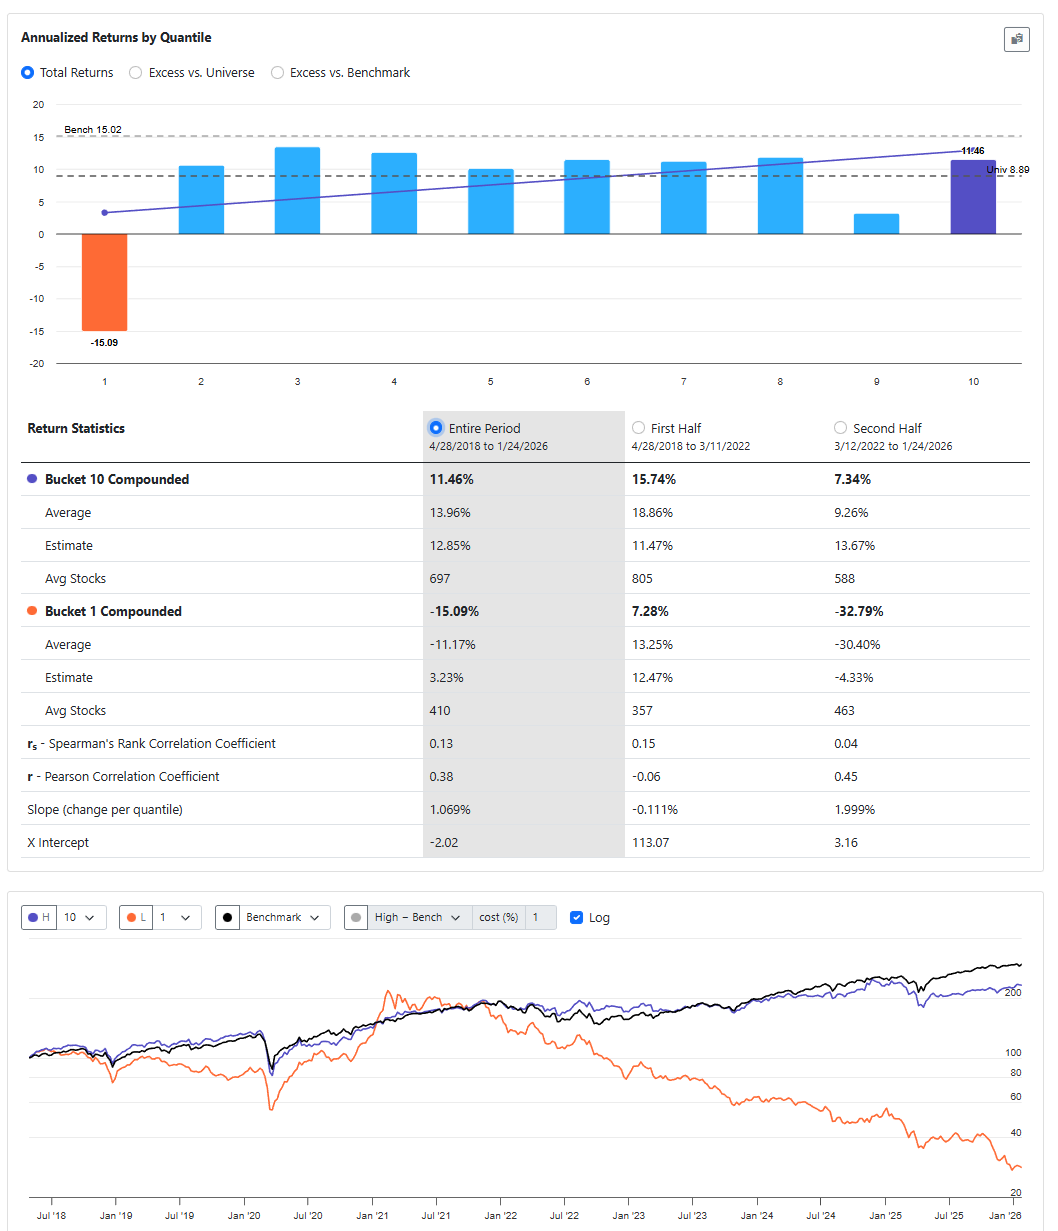
A quick look in a ranking system looks promising for protecting the downside, much like @feldy showed earlier.
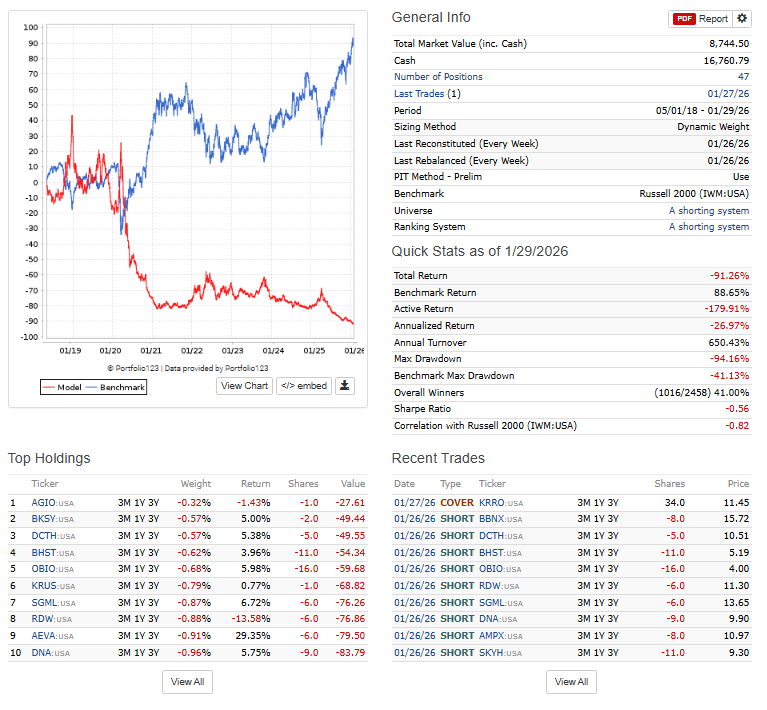
Having the historical fee rates also allows for more realistic historical simulations too. For example, you can set the carry to 2% and filter out any shortable stocks that have a shorting rate fee higher than the same 2%. I do this below.
Using the simple shorting system referred to earlier as first trial: https://www.portfolio123.com/app/ranking-system/438228, https://www.portfolio123.com/app/universe/summary/325069?mt=7, https://www.portfolio123.com/port_summary.jsp?portid=1913290.
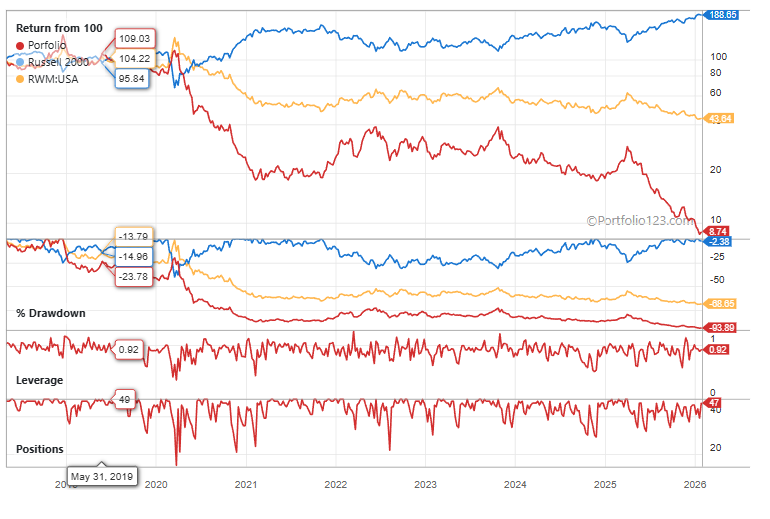
That doesn’t (even) seem to improve on just buying RWM though (as below).
I’m assuming that doing better than just ‘shorting’ the index would require a better and more sophisticated comparison between rank (how much we would like to short the company) and the costs involved (the shorting fee).
The stocks with a high shorting fee were just filtered out instead of, for example, giving them a lower lower chance of entering the holdings if that same fee is high.
Having said that, from this first try, improving upon just buying a simple inverse ETF for the short side doesn’t seem as trivial as it looks.
- Victor
Nice work, Victor!
@marco, this would be an incredibliy useful dataset to have within p123 available for all users.
The other thing you have to take into account is margin requirements. Borrowing costs are one thing, but if your margin requirements on all your shorts are 100% or more (I've seen them go as high as 400%), you'll be severely limited in what you can do with your longs.
Here are the universe rules I use for backtesting shorts:
Price > 2.5
Universe(NOOTC)
$mdt > 50000000 or ($mdt > 10000000 and mod(stockid,20)>2) or ($mdt > 1000000 and mod(stockid,44)>30) or (mod(stockid,17) > 13 and $mdt > 100000)
(where $mdt is MedianDailyTot(126))
Basically, if the daily dollar volume is over $50M you're fine; if it's over $10M, exclude 15% of your stocks; if it's over $1M, exclude 31/44 of your stocks; and if it's over $100,000, only include 3/17 of your stocks. These are very rough numbers, of course, and things will vary from broker to broker. I've found, though, that dollar volume correlates a little better to availability than short interest or institutional ownership.
That $2.50 minimum price is essential to avoid insane margin requirements.
So this is a rough guide without having to import all the historical borrowing costs . . .
Because I don't hold positions that long, I set a limit of no more than 12%/year for my borrowing costs. A lot of my short positions actually pay me interest.