How are you doing?

I hope people will post more pictures of their out-of-sample returns so we can see how others are doing with testing ML models.

I have tried several approaches here:

  • Testing as many features as possible
  • Testing a smaller number of features and adding some gradually
  • Removing some features with too many NAs
  • Trying different validation methods
  • And so on...

I usually pick the model that performs best in terms of lowest RMSE and highest Avg., create a predictor that I train on the period 2004-2019, and then test the strategy in backtest simulator or screen 2020-2024.

Despite being an exciting and new method that is not highly correlated with my current live strategy, I am somewhat surprised by the out-of-sample results.

  • It is very volatile
  • Underperforms for longer periods
  • Also goes sideways for extended periods

That being said, I understand that this is out of sample, so there is good returns, but I envisioned a more stable and sustained excess return.

Is there something I am doing wrong here? How are the rest of you doing?

Here is my method for how I have mostly conducted my backtests: Link to article

I usally use 3MTotReturn as a target:

MY OUS:

I also added some more buy rules that improve the results, but thats just overfitting.

Here is what worked for me:

RecTurnTTM > RecTurnTTMInd*1.25
CurFYEPSMean >= CurFYEPS8WkAgo
CurFYEPSMean> CurFYEPS4WkAgo // EPS estimate up...
AvgRec < 2 // Analysts are bullish (rating scor...
ROI%5YAvg >= ROI%5YAvgInd
Frank("Pr2SalesTTM",#All,#asc)>=50
SalesGr%TTM>SalesGr%TTMInd
Between (VolM%ShsOut, 1, 25) // Eliminates stoc...
Frank("SusGr%",#industry)>75 // "sustainable gr...
Frank(" Pr2BookQ",#Industry,#asc)>=50
EV/EBITDATTM < 25 // Eliminates stocks with hig...
Pr2SalesTTM < Pr2SalesTTMInd // Eliminates stoc...
Frank("IntCovTTM",#All,#desc)>=50
Sales3YCGr%>SalesGr%3YInd
OperCashFlTTM + CashFrInvestTTM > 0 // Eliminat...
OperCashFlTTM > NetIncBXorTTM // Eliminates sto...
Frank("Pr2SalesTTM",#Industry,#asc)>=50

3 Likes

Wycliffes,

TL;DR: Recent out-of-sample result cluster around 30 - 35% CAGR no matter what method used.. This is for out-of-sample AI results and for out-of-sample funded models. To me personally this is encouraging as the results seem like they could be realistic. It provides some evidence that the AI/ML validation is performing as desired: giving some idea of what the true out-of-sample results might have been.

I would just add this. Once you get the hang of it, P123's AI is quick and easy. Especially, when compared to manual optimization.

Whycliffes, thank you for sharing your results.

I think I am beginning to see a pattern. Specifically, a lot of result cluster around 35%.

  1. Your results above 35.5%

  2. My AI model 35%:

  1. My actual out-of-sample funded results using a unique AI method that would be difficult to explain. But it was similar to Extra Trees Regression on cross-validatoin before funding 34.5%


.

  1. Out-of-sample for a nice, well-performing Designer Model (crazy returns microcap model):

Maybe just a coincidence? :slightly_smiling_face:

Jim

2 Likes

This model is trained from 2008 until 01/01/2019, in a small/microcap universe. I've optimized the rebalance interval and sell rule rank limit. High returns but unpleasent volatility and beta=1.3 (I prefer 1.0). Also the model really likes weird biopharma, which is not my favourite industry.

During optimization I've found that (for me) the model "Extra Trees III" is almost always the clear winner. It also seems that I get better results when I use universes where large/mid-caps have been removed.

I'm very curious what people think is a good ML workflow. My model is quite picky about what features it likes, is there an optimal way of pre-screening for good features? Or understanding what features should be cut? As for the volatility, could there be any value in using sharpe (or sortino) as a target instead of price returns?

Edit: Forgot to add, I'm using 3-month relative return (to S&P500) as a target.

2 Likes

I have hopes that Target Information Regression will start working for me somehow. And that I can eventually use it for workflow similar to this: SelectKBest which can be set to that same metric as used in Target Information Regression.

I think it is important for P123 to figure out if I am doing something wrong with thus (most likely) or if it can tweaked a little. I am agnostic. I do know I have made coding mistakes in the past. Time and careful rechecking of results will tell me on my end.

In the meantime, I use Recursive Feature Elimination (RFE). With Feature importances with a forest of trees. For now using DataMiner downloads for feature importances and RFE.

RFE runs automatically with Sklearn. I think you could do this overnight while you sleep on your old Comador computer. For sure on any modern computer or with Colab. More accurately, t took about 8 hours on my MacBook Pro with a modest number of features.

I think Marco is relying on Sklearn libraries a lot. And there is a lot to be learned over there. Honestly, nothing I said was not learned from there, as much as I would love to take any credit.

Jim

2 Likes

These are the steps I used to create my first AI Factor model. I have learned a lot while working on this project, but I am still very much an amateur so comments are appreciated.

Universe
US micro/smallcaps, but allows larger marketcaps then my current live strategies. I used some rules in the universe rules that I dont use in my current live strategies.
Close(260) > .5 //had data a year ago. To reduce NAs in data for TTM factors.
Salesq >= .5 //at least $500k in sales. eliminates SPACs, exploration companies, biotech, etc. Idea was that these are just 'noise' for the models.

In my first attempt, the top predictions included mostly stocks that were in huge draw downs. Even if they would produce good returns, I have no interest in buying those type of stocks in a weakening economy. So I added rules to eliminate stocks that I would not buy. Examples:
EPS is either positive or predicted to be positive within the next 2 qtrs using LinReg().
Avg(FRank("Pr26W%Chg",#All), FRank("Pr52W%Chg",#All)) > 30 //Remove weak stocks.

Only 425 stocks pass if I run it today but in prior years it has been double that number.

AI Factor settings
Validation is KFold, 6 folds,
Dataset period 2003-01-05 to 2024-03-09, Every week. (too many NAs before 2003 for my features)
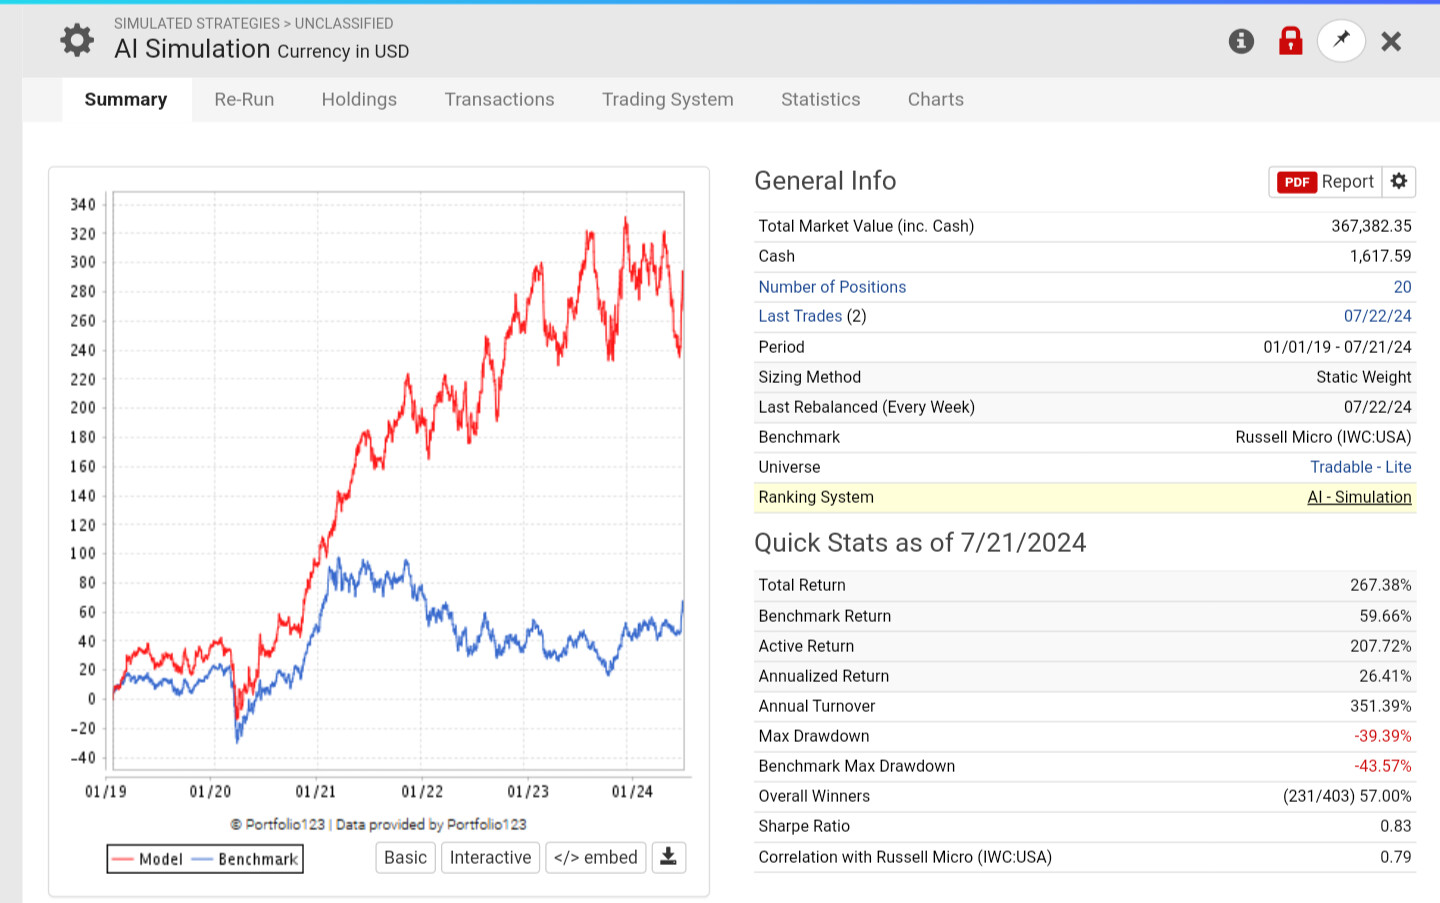
Benchmark: Russell 2000

Features
Started with 213 features.
Removed any with high NA counts. Cutoff was 10%. Thought was that NAs are noise to the algos, but I am not sure how true this is or if my cutoff could have been higher.

Removed most 'financial strength' features because most of them show better results in single factor tests when they are BAD ie high debt. leverage, etc. Probably because there were very low interest rates during most of the backtest period. Not sure that will be true again any time soon, so eliminated them. Most were weak factors anyway. Personal choice.

Used histograms on the factor list page to remove features that had very choppy histograms with non-normal distributions. Thought was that they were too noisy for the algorithms to sort out.

Used Factor List to download the data and the target. Used a Python script to output a list of feature pairs where the correlation between the features was > .8. Used single factor rank performance tests to remove one from each pair. I later changed the correl script to also output the Spearman correlation between each feature and the target - using that would have saved a lot of time. Reason=High correlation features add no additional insight and can affect the 'importance' calculations. Is this step important? If so, then we need a tool to do this.

Have 75 features remaining at this point.

Feature Importance
I removed the 10 features with the lowest importance on the Feature Stats page. Returns were lower in both validation tests and simulations, so went back to the prior list of 75 features. We have improvements coming related to this step.

Target
Target was 3MRel up to this point. Tested different targets including 4wRel, 2MRel and 6MRel. Test method is to create a new AI Factor with the new target and run validations for the promising models. 2MRel gave the best results, so using it. Seems logical also since 2 months would be a typical holding period for me.

Preprocessor settings
Had been using ZScore with Entire Dataset, Trim 5%, Clip, Limit 2.5. Tried different ZScore settings and MinMax. No improvements, so sticking with original settings. I didn't try Rank because prior testing gave weak results.

Hyperparameter experiments
Most of the documentation on the algorithms is over my head, so all I could do is rely on ChatGPT to get some ideas on which settings are most important. Then create a 15-20 variations of the XGB and Extra Trees models that had been working best for me so see if any Hyperparameter settings improved the results. No major breakthroughs here. Once we have a gridseach tool available I look forward to redoing this step with many more combinations.

Created predictors using 2003-01-05 to 2018-01-07.
Created a ranking system which has 50% weight in the XGB model and 50% in Extra Trees. XBG and ET did well in validations and simulations. Combining them produced slightly higher returns in the simulation. No scientific reason for using both of them since they seem pretty highly correlated - just could not decide which one to use.
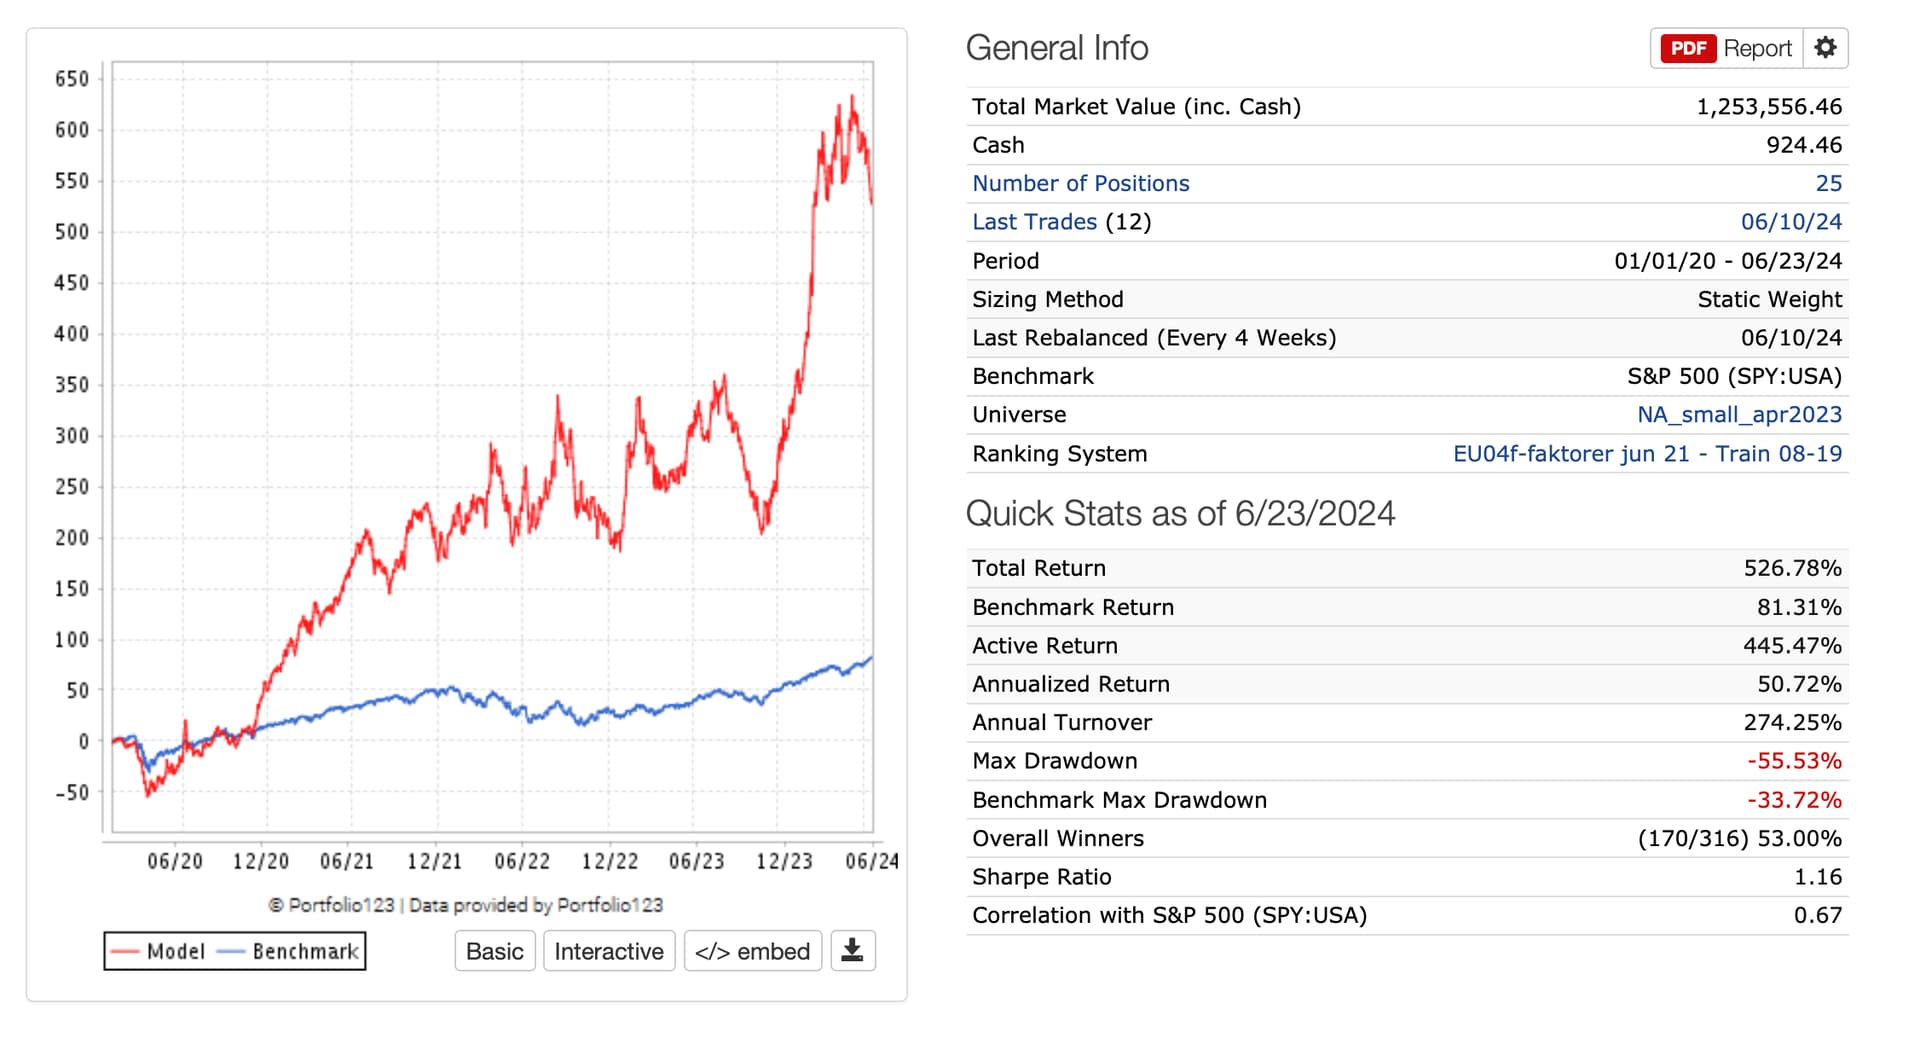
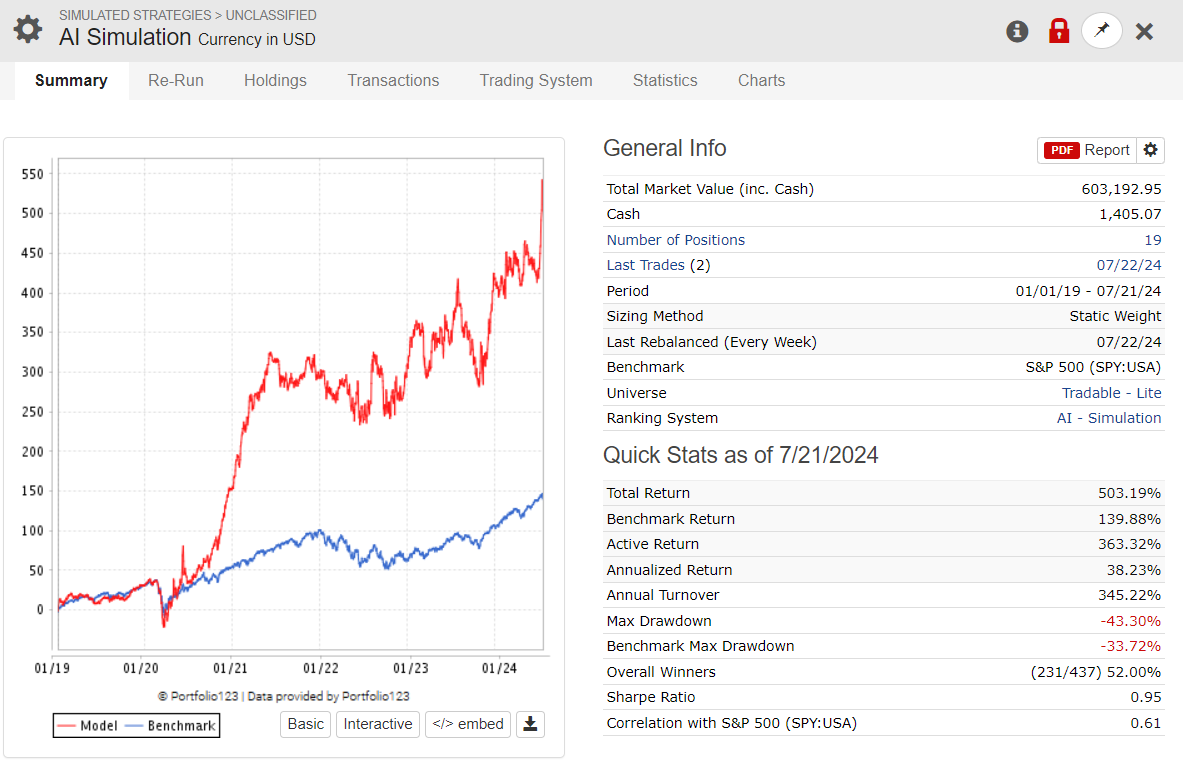
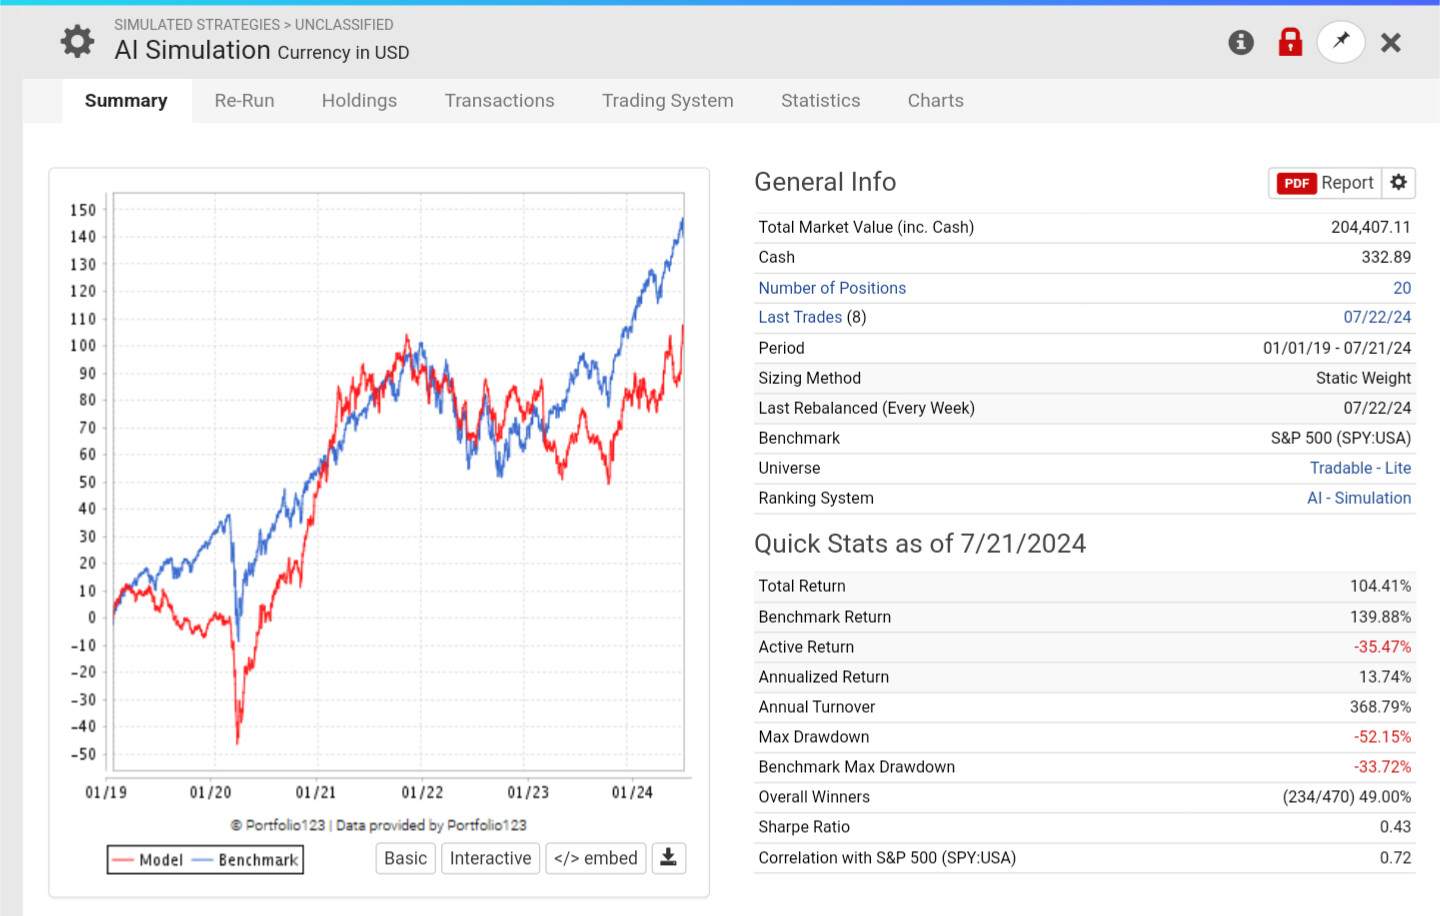
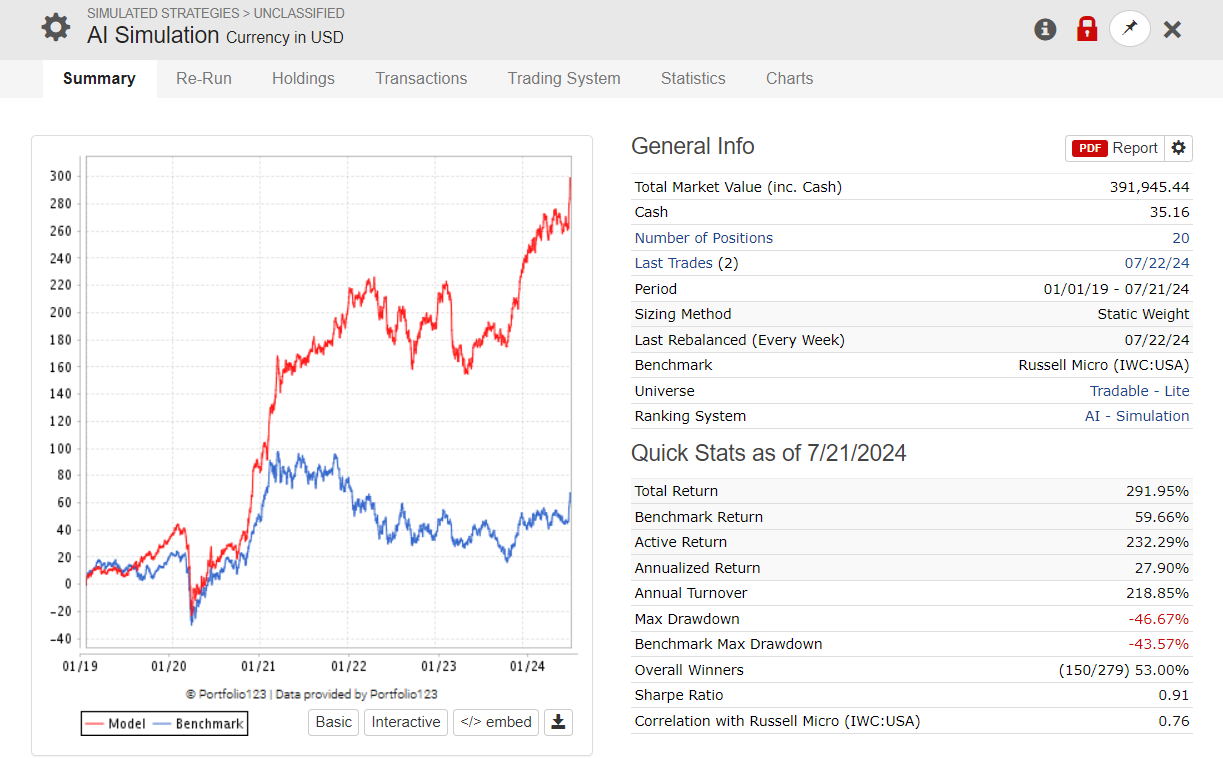
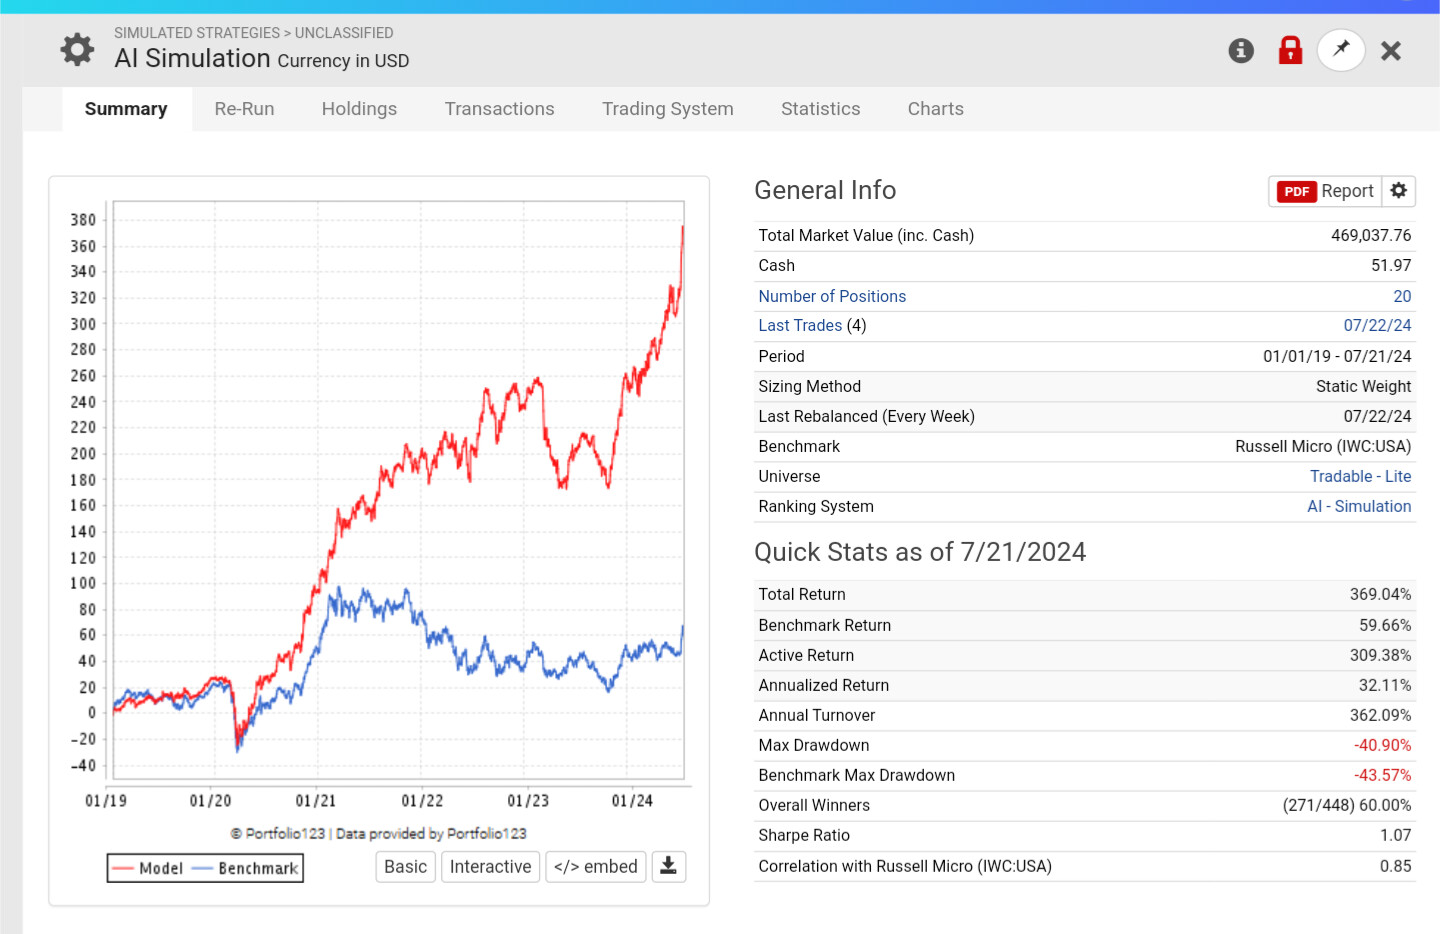
Simulation
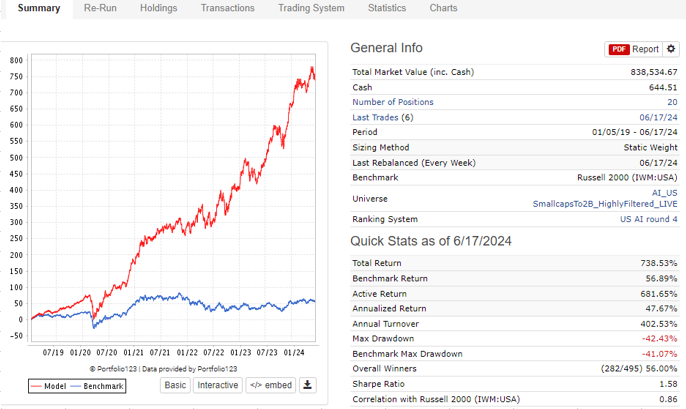
Simulation period is 01/05/2019 - 06/17/2024. I think I could have used a 3 month gap from the end date of the predictor training, but I wanted to be conservative and not risk an data leakage.

Rebalance: Weekly
Commission: 0.005 USD Per Share
Slippage: Slippage
20 positions
'Force Positions into Universe' = Yes because my universe filters would create turnover.
Buy Rules: none
Sell rules: rank < 84 and nodays >= 15
Period: 01/05/2019 - 06/17/2024

image

6 Likes

Great write up! Can any of this be incorporated in p123's AI tool kit?

My flow isn't nearly as intricate which may explain my poor results.

I would like to see this expanded in a workflow applications note.

Thank you very much for sharing this. I'm wondering how this would fare on rolling time series vs KFold which samples from same time periods you are using in simulation.

My experience has been that markets change in time so using any form of data from a supposed OOS time period will produce inconsistent results.

Looking forward if you care to share the results. Very interested! TY.

Hi Dan,

Would the approach you're using not incorporate look-ahead bias because of the data in the validation period being up until 2024?

Victor

1 Like

Hi Dan,

I know you will have great results with this not matter how you do it.

In addition to Victor's point standardizing over all of the data with z-score creates a look -head bias (or data leakage).

I have not been able to quantitate how much of a problem that is in practice, but you should only standardize the training data. You do then standardize the test data but the standardization of the training data should be with the same mean and standard deviation that you get with the train data. Not all of the data at once

Great result that will not away not matter how you validate, In think.

Jim

korr123 - I mainly used Kfold when creating this, but I also created another AIF where I used Time Series CV (not rolling) which would more closely represent what I will do in my live system ie retrain at certain intervals. With a 10 folds, training periods that all start in 2003 which gave me Training Periods between 10.8 and 19.8 years long and 1 year holdout periods (so effectively like I went live in 2014 and retrained every year using all available data at that time).

These results are the Time Series CV with 20 quantiles (about 22 stocks). I shortened the Gap to 26 weeks - not sure if that resulted in any leakage.

The results from the KFold AI Factor were:

My simulated strategy uses the same predictor for the entire backtest period because we do not have tools in place yet to automatically replicate the real life case where you retrain the predictor at some interval.

Victor: Are you saying that all the steps up until the "Created predictors" steps should have been done using a dataset period that ended 2018-01-07 rather than March of 2024? I'm not sure how I could determine if this had any impact. Maybe I could create another AIF with a dataset from 2003 to 2018 and see of the same models get the highest ranks/returns. That seems like it would at least that the 2018-24 data didn't influence the results. Do you think that test is worthwhile?

I view running the simulated strategy as being optional with the main benefit of he sim being a sanity check that the AI Factor predictions work and also to see the trading costs. In my mind the AI Factor validation is the critical part, so I would want the validation to access as much data as possible and not set aside a big chunk of data to use solely in the simulation.

Jim: Regarding "standardizing over all of the data with z-score" - What settings should I have changed? Are you saying that I should have used the "By Date" option for Scope instead of "Entire Dataset" in the Preprocessor settings? My concern would be that my universe has as few as 400 stocks at times and that seems like a small sample to use for calculating the mean and standard deviation.

Thanks for the input guys.

Walter - I do want to use this as a starting point for a detailed document covering the AI Factor workflow. I want to be sure that what I write is as accurate as possible and that I don't spread incorrect information. Hopefully some of the machine learning pros can suggest some more improvements to the steps I outlined.

2 Likes

Hi Dan,

Here is an Sklearn link: 10.2.Data leakage

"Although both train and test data subsets should receive the same preprocessing transformation (as described in the previous section), it is important that these transformations are only learnt from the training data. For example, if you have a normalization step where you divide by the average value, the average should be the average of the train subset, not the average of all the data. If the test subset is included in the average calculation, information from the test subset is influencing the model."

I never found this to be intuitive, but I think there is universal agreement on this in the machine learning literature.

Jim

Dan, would you be willing to make a public copy of this Universe definition? I'd like to give a go at a model on the same universe and time period to make it an apples-to-apples comparison. Thanks!

I think it is intuitive. It's just saying "don't use anything from the training data" which would include normalization stats like average and stddev.

However it's expensive to do, specially with many folds. We would have to calculate and store normalized data and stats for each split. So quite a bit longer to prepare the dataset, and a lot more storage requirements. And this cost would be passed on to you, the user.

Probably something we will need to do eventually, or at least give you the option. We discussed this at length and we gave it a low priority since we don't think the "leakage" is significant.

1 Like

Features: All predefined features

Setting sell rules to reduce the turnover to my favourite value

Model: Extra Trees III

What was the setting for the predictor end date?

It is the same as dan's

Target 12MRel + 3MRel + 1MRel

Model Linear (the second best In-sample)

XGb II:

Extra Trees III: 12% p.a.
Lasso: 16.5% p.a.
DNN6: 18.4% p.a.

Multiple DNN Models Combined:

The last model in my previous reply is trained with a different feature set. It may be more robust.

LightGBM III:

LightGBM II + III: 34.04% p.a.

Light * 3 + Extra + Ridge + Best 500 Factors of Dan's sheet:

Light+Line+Traditional: 18.78% p.a.