Am looking at my portfolio, and while it's good to be concentrated to one driver (e.g. gold prices is a current theme obviously), it's also important to diversify across different performance drivers.
I can of course easily work out how much I'm concentrated in gold miners. But am wondering how I can work out how much I'm concentrated to one driver.
One approach is to see how much I have in each sector, subsector, or industry or even sub-industry but am wondering if people use different approaches.
Sector and subsector seem way too blunt to me to be useful. Industry sometimes not that great as you can be in the same industry but on a different continent serving different markets entirely.
At the moment I can only really do this manually myself checking the business.
Of course, all stocks are correlated to a certain extent as they are stocks - I get that. Anyway - interested in thoughts!
I'm not sure how many factors you have in your Buy Rules or Ranking System, but it seems to me that you could perform checks on each of them on perhaps six random dates. You would eliminate one Rule/Factor at a time and test your system with that rule disabled on each of the six dates.
Then move on by re-enabling that rule and running the sim by disabling another Buy Rule. Next, you should repeat the process on each factor in your Ranking System. Keep track in a spreadsheet of the performance of your strategy for each item you tested—track dates on one axis and Rules/Factors on the other axis.
It's essential that you only change one variable at a time!
This approach will be rather labor-intensive, but you can probably accomplish it in a few hours at most, depending on how many Buy Rules and Ranking Factors you have in your strategy. Finally, examine your spreadsheet data to identify consistent patterns. This approach should indicate how much each item contributes to overall performance.
Perhaps there's an easier way, but I'm not aware of it at this time. I always justify time expenditures like this by remembering that unsuccessful people aren't willing to do the things that successful people do to achieve their success. Maybe another member with more experience can offer you better guidance. Best of luck!
Am not referring to a backtest/simulation, I'm referring to my live portfolio and to potential additions to it.
FYI I don't follow my strategy exactly - I prefer to use a screen based on my strategy as I override quite a lot by preferring a slightly lower-ranked stock a lot of the time.
I would think that any determination of the overexposure of any live position would be significantly enhanced by the systematic backtest analysis I mentioned previously. I can't imagine how you would decide if your current picks are informed by over-exposure to a certain factor without some indication from historical data.
FYI I don't follow my strategy exactly... as I override quite a lot...
There are multiple recounts of investors' second-guessing approach in the literature, and they invariably show that overriding a quantitative strategy's selections has a losing track record.
Jim Simons, quant-guru extraordinaire and founder of the famous Renaissance Technologies hedge fund that has produced a 63% annual return for decades, says that "Renaissance is 100% model driven...", and gives us excellent reasons to stick with our strategies. (see 45-second YouTube interview)
Famous investor Joel Greenblatt conducted an early study on his wealth-management clients that offered them the choice of using the model's selections automatically, or getting the same picks as 'recommendations' that they could override.
After a year, the study showed that those who second-guessed the proven model received significantly worse returns, underperforming both the systematic model and the market. The reason for this is that investing can frequently be counter-intuitive, and stocks often go the opposite direction from what logic predicts.
One way to test this is to compare your actual return from your brokerage statements to the performance of your strategy's backtest. This would be unequivocal evidence. However, if your manual, discretionary performance is better than your strategy, it likely means you have a flawed strategy, and perhaps you should invest time in improving the model's performance, such as by implementing your discretionary selection approach into the model's mechanical process. P123's support staff can help you with programming your process!
I'm making this case from experience. Having been a 'second-guesser' myself in the long-ago past, I know that consistently overriding a good model will eventually come back to bite you. And I bet many P123 users would agree with me. Food for thought...
Portfolio123 will be implementing risk-factor modeling at some point, and then you'll be able to quickly see the weight of fifteen different factors for each stock that you own.
In the meantime I suggest you use this screen I've created for you. https://www.portfolio123.com/app/screen/summary/313442?mt=1. Put your tickers in the first line or use a list (I just put a bunch of tickers in there off the top of my head). Run the screen. If many of the values are pretty close, you know that you are pretty concentrated to one factor driver.
The other way to do it is to run a screen with the tickers on one line and the command ShowCorrel(x,y) in the next line, with x being the number of days in a sample and y being the number of samples. See www.portfolio123.com/doc/doc_detail.jsp?factor=ShowCorrel
I think with the current tools, checking country+industry concentration + correlation analysis, is the best you can do. Checking factor exposure with a Screen+Rating() can be interesting but imo is not really helpful if you run a strategy which focuses on these factors. Imo it's all about separating 1. risks you want to take from 2. risks you want to avoid or don't get paid for. But that can be a highly personal question.
E.g. Some people want to avoid industry bets and currency bets, so they go sector-neutral and hedge currency. I personally see industry rotation and opportunistic industry concentration as a risk I actively want to take (and get paid for). Same for currencies (part of global diversification, tends to even out long-term, so I don't hedge it)... What I would love to hedge out, would be idiosyncratic risks but the only thing to deal with that is limiting position size.
To sum up: Imo first, you should identify what are return drivers which you are agnostic to (or not willing to take) and don't want to concentrate on (e.g. sectors?, currencies?, commodity prices?, bonds yields?, Quant Factors you don't use in your system?...). Then the proper way to check exposures would be to run a regression on proxys for those drivers (independent excess return factors e.g. calculated from suitable indices or ETFs like DXY, DBC, etc.) and check the betas of all holdings in comparison. If you defined all the factors correctly and the average of each beta across your holdings rounds to 0, you would have perfectly diversified away those unwanted risks. If something remains, you could use a short/long on the corresponding proxy asset as hedge in either direction.
Going by simple classification group counts and correlations to such proxy assets can give a first assessment but never the full picture.
Whether or not to hedge currency risk depends to some extent on the nature of the currency. For example, the Australian dollar is a commodity currency and will, on average, fall in a recession. Therefore people who spend in Australian dollars have less need to hedge their currency risk, as not hedging their currency risk will help to smooth out their spending. The Japanese yen and the Swiss franc, on the other hand, have the opposite nature, and therefore people who spend in these currencies have a relatively greater need to hedge their currency risk.
However, due to the low robustness of these types of correlations, I think it is less important to bother hedging this type of risk when considering equity allocations.
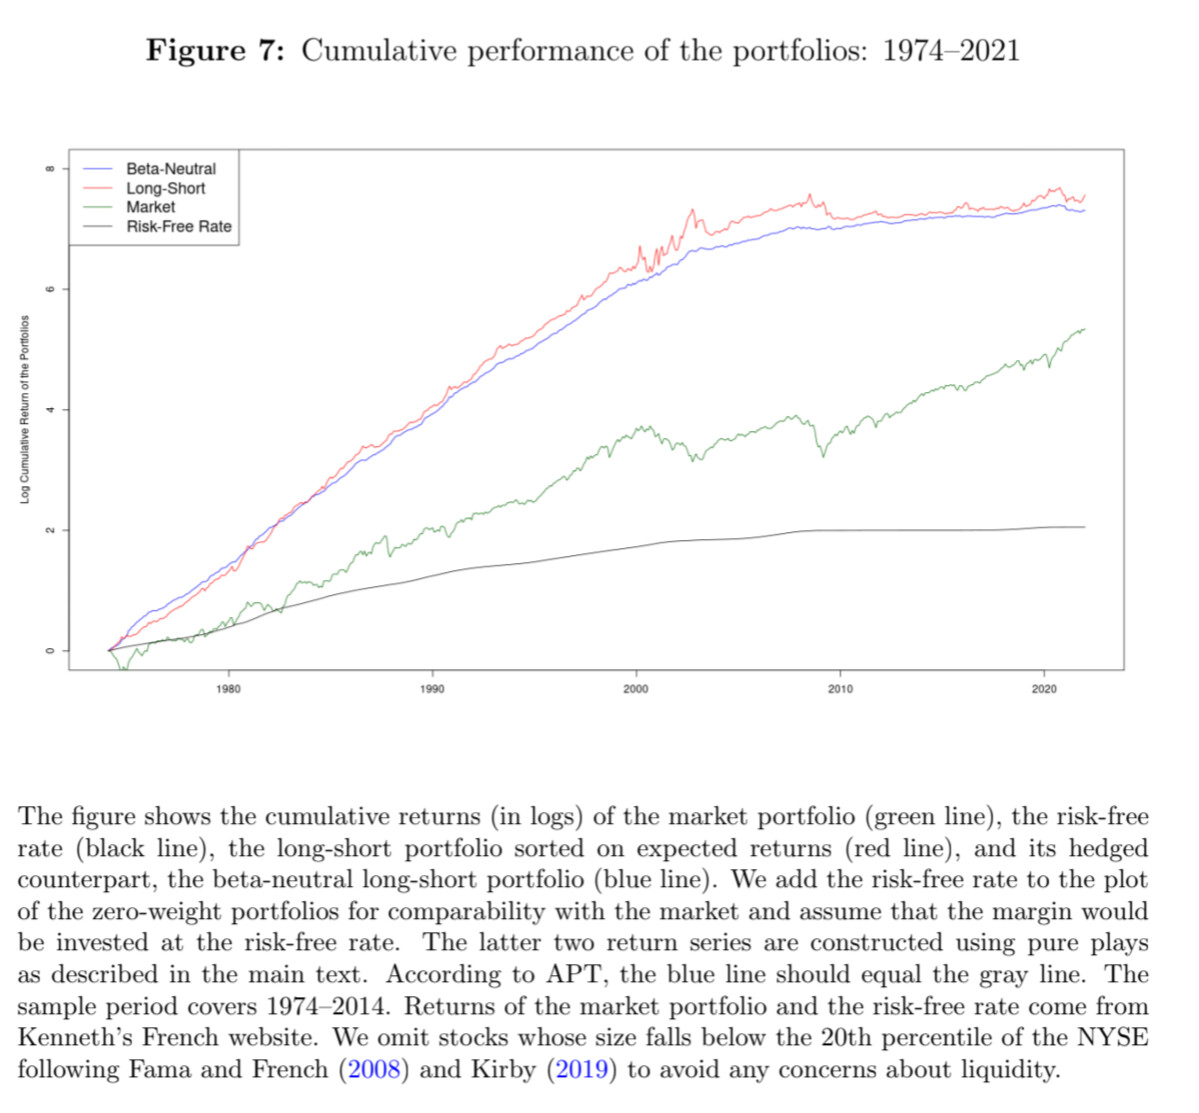
For those who wish to hedge unnecessary risk as much as possible, here is the paper:
This is pretty close to the risk model that Portfolio123 plans to implement in the coming months. One thing you're leaving out is the choice of a benchmark. For example, if you're thinking about the beta of the size factor, it makes a huge difference whether you choose an equal-weighted or cap-weighted benchmark.
Good point. However, I am quite sure, there are even more construction details I am missing here. Afterall, no matter how granular you will go, it will just be a risk model. And all models are wrong but some are useful. Nonetheless, it will be way better than simply checking pair-wise correlations without analyzing the betas to underlying risk factors.
In short, you can use the characteristics of every stock to predict other stocks. In the process, you can figure out how to hedge risks that don't pay off.