Thank you both, Mr. Sthorson and Jim, for your thoughtful replies.
Now if you will indulge me, Mr. Sthorson, with some questions just to ensure my Texas Aggie I/Q isn’t getting in the way. You say that you compute the average 3 month return for each stock in your universe. Are those returns equally weighed? Also, I have no idea how to determine what stocks are in my universe nor how to calculate the return for each of those. Would I use the ranking screen to do that? Some kind of LoopSum ? Other?
Thanks again for your posts.
On a side note, remember above my mentioning how I thought different factors could be destructively interfering with one another? Well, here is a slightly different version of that. Remember my post about Sell rules for rank (see Sell rules for rank (e.g., rank < 60) versus different stock universes)? When doing my research for the posting I ran performance tests for each of P123’s 7 core ranking systems using sell rules of “rank < 95”, “rank < 60”, and “rank < 40” for the 6 stock universes of S&P 500, S&P 1500, Pr 1000, Pr 2000, Pr 3000, and Easy-to-trade. The results proved interesting. For the Sentiment ranking system, here is what it looked like (the 6 columns are the 6 stock universes):
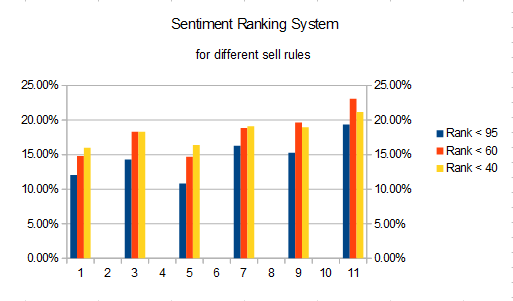
As you can see, having a less restrictive sell rule helped performance. Now look at the performance impact for the Value ranking system:
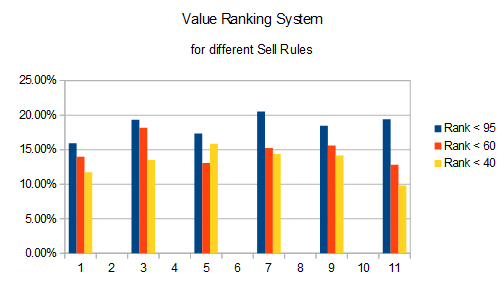
Here having a tighter sell rule helps performance. (My pure guess is that value traps are being discarded early, but that is probably wrong.) Imagine developing a ranking system with these kinds of interactions going on and being unaware of them! That is why I wanted to find out if my “frog-in-the-pan” component was hurting some other component and just how you folks discovered that in your system development.
Cary