How do you folks assign a weight to a factor or set of factors in a ranking system?

All,

I fear that I am about to ask a question that is so simple, so fundamental, one whose answer is so obvious that it will be kin to asking “What day of the month is the 4th of July on?” Well, I am going to ask it anyway.

When each of you is developing a ranking system and considering adding a new factor, (1) how do you decide what weight to give that factor, and (2) how do you determine if adding the factor at all means the ranking system is better or worse?

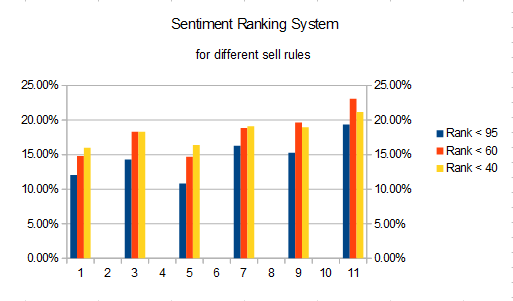
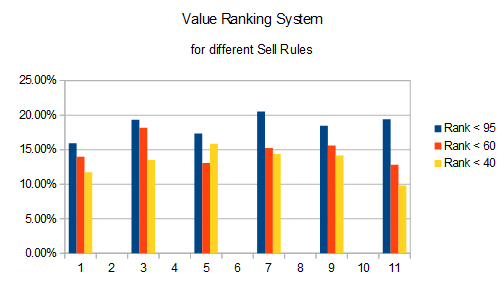
I ask this because I recently decided to find out why the momentum ranking system performed so poorly in my tests (see a newbie's exploration of the core combination ranking system - part 2 discussion topic Momentum). I learned that partial causes of the poor results were my simulation conditions of (1) only 5 stocks, (2) sell rule of “Rank < 95”, and (3) stock universe of S&P 1500. Once I changed the portfolio size to 50 stocks and the sell rule to “Rank < 60”, then I got a much more respectable CAGR of 9.96% for the S&P 1500.

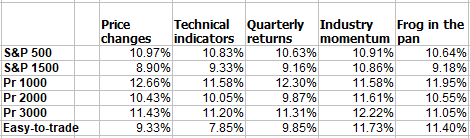
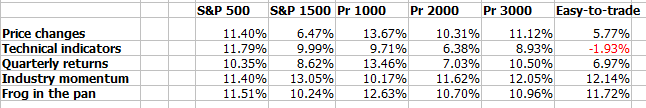
To determine what contribution each of the original 4 factors of momentum (price changes, technical indicators, quarterly returns, and industry momentum) along with my implementation of “frog-in-the-pan”, I decided to run 31 different trials across 6 different stock universes, namely S&P 500, S&P 1500, Pr 1000, Pr 2000, Pr 3000, and Easy-to-trade. The 31 different combinations derived from deciding to give equal weights to the 31 combinations of factors, taken 1 at a time, 2 at a time, 3 at a time, etc., with each factor selected being equal weight to the others. So now I have all of this data, but I am not sure what I am seeing. The data gives credence to the idea that industry momentum is the best factor. My “frog in the pan” component seemed to be 2nd best, and the other 3 factors other weights. But this is not always the case. While I have a notion on how to determine the weights for each of the factors, I hope I can get you folks’ inputs on how each of you does it.

Thank you.

Cary

Hi Cary,

This is a topic which I have not mastered yet, so I’m just as interested in the answers that others have come up with as you. However, I have some things to share.

I think a good starting point is using equal weights for your factors. From there, I think it makes sense to give higher weights to:

(1) factors that consistently add value to your equally weighted ranking systems. For example I have found that factors that involve some kind of returns on capital measure almost always improve alpha to an equally weighted multi-factor ranking system, no matter what other factors are in that system. Hence, It seemed to me that these type of factors are important and deserve a higher than average weight.

(2) Factors that make most financial sense to you and you are most ‘sure’ about from a financial standpoint. For example I’m pretty sure I never want to pay more for a company than needed, but I’m not too sure I never want to buy a stock that has been declining in price the last 12 months. Hence, intuitively I would want to add more weight to a value factor than a momentum factor. But not everyone agrees on this one.

(3) Factors that contain the least amount of noise deserve a higher weight. For example, a factor that is based on information from the balance sheet / profit and loss or cashflow statement deserves a higher weight than a factor based on analyst revisions, at least in my opinion.

In determining the weights, I think those are good things to keep in mind when creating some sort of ‘scoring system’ for your weights. For example you could give your factors a score based on those 3 criteria (or other criteria that you might have) and give weights based on their ranks of your score.

best,

Victor

Generally agree w/ Victor here. I would only suggest that the key is not so much on weights, but finding those factors that are the most resilient/robust/predictive to begin with, based on your universe(s). This may be quality factors above; in my case, I find certain growth factors to be important, or non-conventional value factors (look at EV factors). Once you find those factors that truly shine, then weighting those higher could be a good move. Just tweaking weights to find a good backtest is good for the sake of an impressive backtest, but so so much for out of sample performance.

For good out-of-sample performance, you want to have a strategy that is all-weather: that outperforms consistently in different sample populations and in different market conditions. So, as Victor and Rob say, you need good, reliable factors, and weighting isn’t as important.

My technique for determining factor weights is as follows. I create a bunch of ranking systems, usually with more than a hundred nodes, with different weights, all of the weights being multiples of 2% or 2.5%, but most of the nodes being weighted 0%. I run backtests on these ranking systems in various universes. I then take the ranking systems that perform best in each universe (there are often statistical ties, so there’s often more than one per universe), along with the ranking systems whose average/median performance on all universes is the best, and I average the weights of all of them. I measure performance by trimmed weekly alpha. I end up with a rather well-balanced system.

I can’t very well test thousands of ranking systems, so instead I test random variations of the ones that have tested well previously. All of this takes a lot of work, and it may not be worth it. Most of the highest ranking stocks tend to be the same before and after I create new ranking systems. Not only that, but there’s some over-optimization involved in my method. It’s far from perfect, and I’m OK with that.

Cary wanted to know how to figure out the weights of new nodes. I just treat new nodes the same way I treat old nodes in the above process. I probably shouldn’t. I probably should favor new nodes somehow since they end up being tested a lot less than old ones.

I think the most important thing is to come up with a balanced ranking system that includes lots of factors, even if most of them overlap or are highly correlated. By “balanced” I mean a ranking system that includes some quality, value, stability, size, technical, sentiment, and growth factors.

All,

Thanks so much for your comments! You have given me a lot to think about!

I am really interested in coming up with a way to reasonably assess the effectiveness of a factor to a ranking system, and just as importantly, how well or poorly that factor interacts with other factors. For example, the authors of the book Quantitative Momentum wrote an earlier book titled Quantitative Value. In the QM book, they recommended using both approaches, but not together. Instead, they recommended half of the investment pot go into QV type stocks and the other half go into QM type stocks. The reason is that (according to the authors) value and momentum are negatively correlated. The combination (in separate portfolios) tends to have more even combined returns. But the value selection combined with momentum selection into one ranking system tends to end up with lousy value stocks with lousy momentum. I like to think of value and momentum as 2 lights, or maybe like the interference patterns resulting from double slits, where value and momentum become destructive when added together, akin to the dark areas in this picture:

image

I used the momentum ranking system because the QM book mentioned 3 items to improve the momentum ranking that I wanted to explore: (1) the “frog in the pan” component, (2) Standardized Unexpected Earnings (SUE), and (3) Cumulative Three day abnormal returns (CAR3). I was surprised and pleased to see someone else mention SUE (see Standardized Unexpected Earnings (SUE)) and that P123 decided to provide that factor, as well as providing Standardized Unexpected Sales (SAS).

I started with the “frog in the pan” component more as a learning exercise than anything. My biggest fear was that the “frog in the pan” component (or more likely, my implementation of it) would be like the double slit experiment and that the component would have destructive contributions, either with all of the other components, or maybe with one of the other 4 components. My biggest question was this: how would I know this? If the “frog in the pan” component alone turned out to have the worst contribution factor for all stock universes, then that would be a strong clue, i.e., “This factor is not only useless, but worse than useless!” But what about the case of it interfering with another factor, e.g., quarterly returns? How would I know this?

So thanks again to everyone. I have an idea on how to proceed, and your responses have given me much to consider.

Cary

Hi Cary,

Interesting that you are familiar with the 2-slit experiment. The Schrodenger wave equation, matrices, eigenvectors and eigenvalues involved in solving the 2-slit problem are why I decided to go into an easier major in college (easier than quantum mechanics). I do think your question is related as you suggest.

But the specific question of whether factors are interacting is easier. This can be done with the screener, I think. For momentum and value interactions run a screen with your value factor(s) with 200 stocks say.

Then put into your universe a momentum rule like: Frank(“close(0)/close(30)”) > 80.and reduce the size of your screen to 40 because you reduced the size of your universe by 80% when you added the momentum rule.

If the momentum factor is not interacting with the value factor the returns should be about the same for each of the screens.

More to the point if the returns are decreased the momentum factor is interacting with the value factor in a negative way and it is not just a problem of dilution (which is your question about possible interactions).

I suspect this make intuitive sense and you probably already agree. But his could be turned into a probability problem with expected returns (i.e., probability of a return greater than the median for the value factor and the momentum factor). You might want to make a few more assumptions about normality etc.

But after writing a good set of assumptions, one would only need to use the definition of independence to prove this. Here is the definition of independence from Wikipedia:

Screen Shot 2022-11-09 at 6.20.44 PM

If I had stayed in physic and solved a few more Schrodinger Wave Equations I probably would have used Fourier Transforms :wink: Perhaps we are both thankful!

BTW. Yuval: Nice!

Jim

Thanks, Jim, for your insights. It is even more amazing that this time I actually understood what you wrote! :grin:. The definition of statistical independence you gave is a little different from what I think I remember, which is P(A|B) = P(A) and P(B|A) = P(B). But the two different ways of expressing independence are probably saying the same thing.

Regarding how the value and momentum ranking systems interact, that is something I will investigate later and publish the results. For now, I will present the results of my analysis for momentum with my new factor for frog-in-the-pan added in. My first method, which is practical for only a few factors, is to try all of the different factors as determined by using 1 for the weight of 1 factor at a time (5 total), 1/2 for each of the factors when taken 2 at a time (10 total parings), 1/3 for each factor when taken 3 at a time (10 total pairings), 1/4 for each of the factors when taken 4 at a time (5 total), and 1/5 for the pairing of all 5 factors. For 5 factors, this results in 31 total pairings. Thus the total number of groupings for a set of “N” factors is 2^N - 1. For small number of factors like 5, that is not a problem, but with larger numbers, this quickly becomes impossible. The reason I chose this method is that it should (hopefully) detect when (1) a bad factor is hurting the performance when it participates in the ranking, and (2) 2 different factors clash, akin to the canceling light waves in the above double slit. But enough of the method. Here are the results from all 31 different combinations for each factor for the 6 different stock universes summed together:

image

The 2nd method I used was to simply look at the return for each factor when it was used by itself. This is much more scalable but will definitely not catch when a factor badly interacts with another factor. When each of the factors was studied alone, here is what the results turned out to be (sorry to flip the order of rows and columns; that is how I have it in my spreadsheet):

image

The conclusion I reach is that no one factor stood out as a great predictor of performance, nor was there any one factor that was a dog, except when used alone in a particular stock universe.

So regarding my original question of the frog-in-the-pan factor, it proved not to be a dog nor a knock-it-out-of-the-park type of factor. I would rate it as a steady contributor just behind industry momentum.

The second thing I learned is that not all stock universes are good for momentum ranking, particularly the S&P 1500 and Easy-to-trade, for reasons I do not comprehend. Momentum does reasonably well for the other universes.

Comments?

Cary

This is how I weight factors:

Say I have ten factors in my ranking system.

Run the ranking on the factors and carve out the stocks in the top decile for each factor.

Compute the 3 month return for your benchmark. I use the universe as my benchmark, so I get the average 3 month return of all stocks in the universe.

Average the 3 month return for the stocks in the top decile of each of the 10 factors.

If that return is greater than the universe return the factor passes and the remaining factors are given zero weight…

Calc the difference between the the top decile factor average return and the universe return. For example if the 3 month universe return is 10% and the factor top decile average return is 15% the difference of course is +5%.

So if three factors pass the benchmark test, and the outperformance is 5%, 10% and 20%. Sum these returns, so 35.

5/35 = .142 * 100 = 14.2%
10/35 = .285 * 100 = 28.5%
20/35 = .571 * 100 = 57.1%

With rounding the results sum to 100%. These are your factor weights.

I take it one step further. For each factor that passes the first test, I calc the performance difference for each decile. If a decile beat the benchmark I add that difference to the sum. This helps reward a factor that has solid returns across several deciles.

Sthorson,

Thank you for sharing. Your core method makes a lot of sense for a lot of different reasons to me. There are some things you suggest that I am going to try with my systems this morning.

Commenting on just one of your peripheral points (that I agree with): I don’t think using anything other than the universe (or random sample of the universe if one prefers) works well as a benchmark, or for any statistical comparisons. Other universes (e.g., cap-weighted universes) can diverge for years (decades even) leaving a very wrong impression about the effectiveness of a method.

JIm

Thank you both, Mr. Sthorson and Jim, for your thoughtful replies.

Now if you will indulge me, Mr. Sthorson, with some questions just to ensure my Texas Aggie I/Q isn’t getting in the way. You say that you compute the average 3 month return for each stock in your universe. Are those returns equally weighed? Also, I have no idea how to determine what stocks are in my universe nor how to calculate the return for each of those. Would I use the ranking screen to do that? Some kind of LoopSum ? Other?

Thanks again for your posts.

On a side note, remember above my mentioning how I thought different factors could be destructively interfering with one another? Well, here is a slightly different version of that. Remember my post about Sell rules for rank (see Sell rules for rank (e.g., rank < 60) versus different stock universes)? When doing my research for the posting I ran performance tests for each of P123’s 7 core ranking systems using sell rules of “rank < 95”, “rank < 60”, and “rank < 40” for the 6 stock universes of S&P 500, S&P 1500, Pr 1000, Pr 2000, Pr 3000, and Easy-to-trade. The results proved interesting. For the Sentiment ranking system, here is what it looked like (the 6 columns are the 6 stock universes):

image

As you can see, having a less restrictive sell rule helped performance. Now look at the performance impact for the Value ranking system:

image

Here having a tighter sell rule helps performance. (My pure guess is that value traps are being discarded early, but that is probably wrong.) Imagine developing a ranking system with these kinds of interactions going on and being unaware of them! That is why I wanted to find out if my “frog-in-the-pan” component was hurting some other component and just how you folks discovered that in your system development.

Cary

For the Sentiment ranking system…a less restrictive sell rule helped performance

for the Value ranking system:…having a tighter sell rule helps performance

Tighter sell rules on a high turnover system may cost more in slippage than they gain in returns.

Slippage is the key.

But note that instead of optimizing slippage for maximum gains in simulations, I’d would assume that future returns are likely to be a little less, and use looser sell rules than indicated by simulations.