How I Rank R2G Ports

Aurélien,

You are overlooking the main reason that certain MA crossovers (and other TA systems) actually do work. I agree with you, there is no rational reason that it should work, except for one.

There are millions of investors/traders that believe that it works, and there are thousands of “experts” who write academic papers, host web sites touting the wonders of MA crossovers, and other TA based on nothing else but price and/or volume changes.

Crossovers and TA work because when their signals occur millions of followers trade on them. thus, self fulfilling systems. it is a good thing that there are many TA systems and they all don’t signal at the same time or the volatility would be overwhelming.

I would rather not trade based on any TA system, but I also know that there are ways to take advantage of the fact that a million others will be, and include that info into my trading. If you know that many shares will be traded after a crossover or other TA signal then you have an advantage over anyone who ignores it.

The key is figuring out which TA systems have sufficient number of followers to have a significant affect on price action. FYI: the highest followed crossover is the 50 day over the 200 day. You can bet that that will have a very high probability of success (but only for a short time after the signal).

Denny,
You can follow my MAC-US moving average cross over system which would have kept you out of trouble for the last 65 years and would have provided a 13.4% average annualized return from 1950 to 2014, and you don’t have to trade every week.
http://www.advisorperspectives.com/dshort/guest/Georg-Vrba-140605-MAC-System-Backtest.php
This model is still in SPY. You can follow it at no cost at imarketsignals.com.
If you are invested in the Australian market be on your guard. MAC-AU is about to give a sell signal - possibly next week.
Best,
Georg

Geov,
Respectfully I am certain the MAC system has no predictive value.
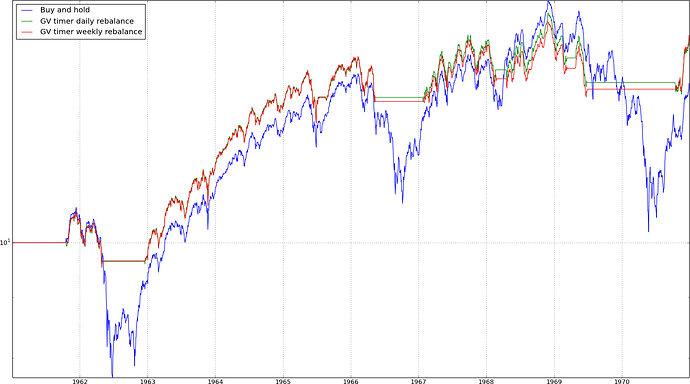
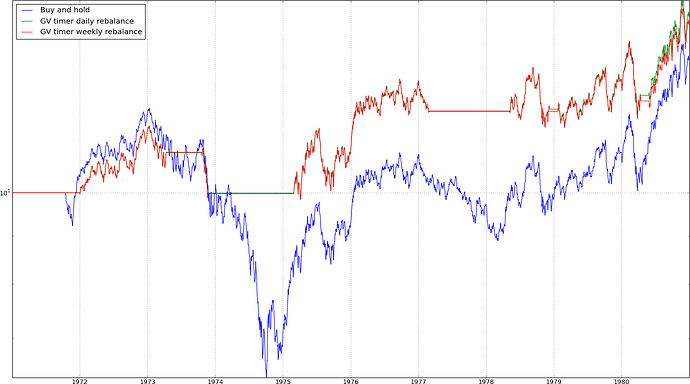
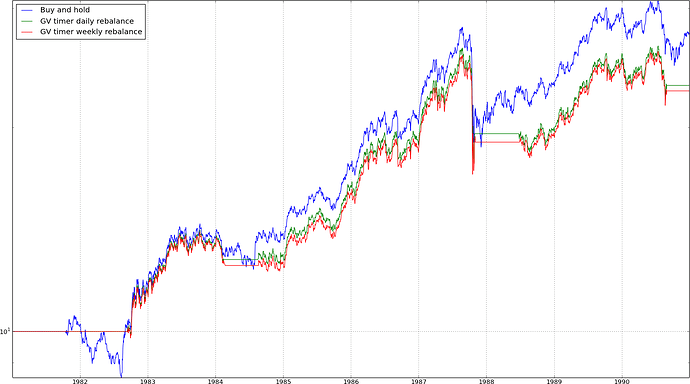
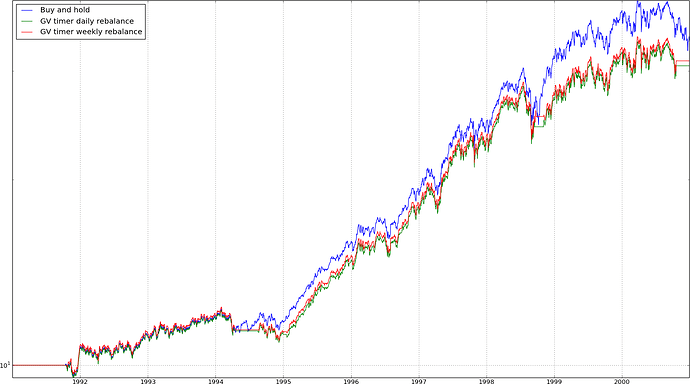
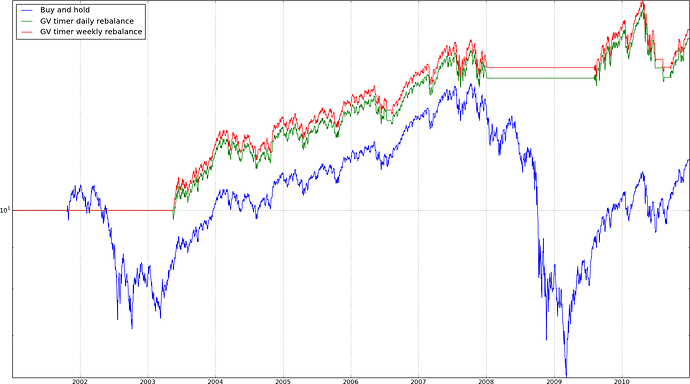
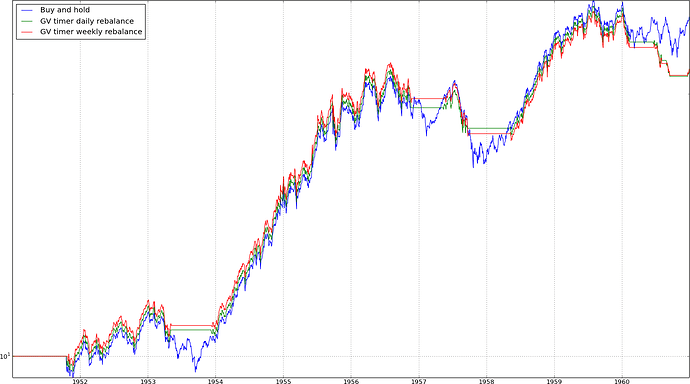
I have divided the 1951-2011 period into 6 chunks of 10 years and used the MAC to time the market. I have assumed no trading costs whatsoever.
The MAC outperformed 3 times out of 6 and underperformed 3 times out of 6. This is the definition of random.

I have backtested this using Yahoo finance S&P500 price series, ipython, pandas and matplotlib. I can share the code.

edit:sorry for the size of the pics, I can’t seem to edit the attachments.


geovtimer.py (6.98 KB)

aurelaurel,
The MAC-US switches to 10-year treasuries when out of the market. Your model goes to cash. To make charts smaller you have to reduce them to 70%.

This is a topic close to my heart and I think that this is a very important discussion.

The problem of how to rank an R2G and curve-fitting has multiple layers:

  1. On the relationship between model designers and people who use the model

1.1) WYSIATI humans vs absolutely rational econs
When evaluating a model, humans (as opposed to educated, thoughtful but unrealistic econs) (can only) use WYSIATI = what you see is all there is. (The term is borrowed from a very good read by D. Kahneman’s - Thinking, Slow and Fast).
In case of P123 this means, that people, who are interested in models, can only look at all the factors that are provided for pre-selection. The most striking stats are probably alpha by itself, the predefined “What’s important to you?” ranks on the R2G main page and the return graph. Luckily, people now become more sensible and/or cautious in evaluating models (for example liquidity and turnover after being burnt from high turnover small cap “ultra” alpha R2Gs).
Of course, every sub is different and some do a more thoroughful analysis than others. Nevertheless, on average, I assume that a tendency of WYSIATI holds for all of us when we evaluate any model.
Without taking an extreme liberal (expect subs to be educated rational econs) or conservative (expect subs to be helpless emotional, WYSIATI humans), one solution might be to nudge people in the right direction (this time, the term is borrowed from C. Sunsein and R. Thaler’s - Nudge). It is definitely not easy to decide which direction is scientifically desirable, but I think we can for example all agree on the importance of out of sample data over in sample data (as long as there is indeed a sufficient time frame of oos data available). I think that P123 could do more, for example by providing any R2G stats (alpha, Sortino etc.) as oos data. By providing the oos return ranking feature and providing the oos advice on the R2G main page, P123 has taken steps into the right direction.
I think Tom has also summarized some fairly valid points in being cautious when evaluating R2Gs:
“But, all R2G’s for the most part, may be curve fit, but poor o-s-s performance is as or more likely that deviations in performance come from a) the use or market timing and hedging, b) the small number of holdings, c) varying start dates and random fluctuations, d) the short times since inception and e) (often) the lack of proper benchmarks are much greater source of year to year variation.” We are all on a learning curve here and will find more and more factors that we can use as pre-defined settings on how to evaluate (future) R2G performance.

1.2) Building possibly bumpy models for robustness vs. smooth equity curve designing for “marketing”
Most R2Gs are designed to have a smooth equity curve or at least deliver alpha (/Sharpe/Sortino) on a very consistent basis (which is good at first sight and often good at second sight). Any deviation from the norm can quickly be implicitly judged as a flaw in the model. However, we usually have too few information to assess whether the currently presented model truly provides a lasting edge or whether it was built “to look well” (according to the WYSIATI stats). And who could blame subs (or anyone else evaluating a model)? If in doubt, you choose the model with the smoother equity curve / higher alpha, because both models could be equally flawed (unless the designers have provided extensive explanations (Oliver among others comes to mind …) - and the subs care about these additional information). Problem is, so far we only have a limited backtesting time frame. On the other hand, strategies that have worked over centuries (such as mean reversion in terms of value investing or technical analysis) sometimes had a bumpy ride along the way.
I can also empathize with Tom’s doubt that even if models were improved for robustness in terms of number of holdings and (potentially) fewer factors etc. no one would sign up. It just doesn’t look sexy on the backtest graph and for example too many holdings look tedious and costly to trade and bumps in the equity curve are a scary thing.
Possible cures to these trade-offs include (of course) more backtesting data, refrences to tests being performed with longer time frames, disclosure of the approach of designing the model and the number of rules. Maybe the last point is rather personal - I am more skeptical of absolute buy and sell rules than of ranking systems (buy/sell rules may be more prone to disregard changing relative relationships of factors) and more skeptical of 20+ formulae ranking systems (“stylized”) than of <20 formulae ranking systems.

1.3) Disclosure vs. secrecy in model building
Once you have built a great model, how do you convince people that it is truly great?
One such related, common discussion on P123 is about market timing. One can built her/his favorite model and then employ a market timing rule as a finishing touch which wipes out all the remaining dips of that specific portfolio. It looks great on the charts and stats, but does it work in the long term? On the other hand, there are many model designers on here that seem to do a very thorough analysis of their market timing models (Denny, geov among others) and can provide good reasons that these systems will work in the future. However, do they really need to disclose the exact rule they are using to convince everyone of its advantages? In the end, the designer’s ideas are proprietary and her/his valuable asset in designing models.
This sub-problem could be solved by more backtesting data, by separate (voluntary or mandatory) display of the universe, of buy/sell/market timing rules or graphs thereof (“signaling”) and by the reputation of the designer.

  1. On the meaning of curve fitting
    I think there are different understandings of curve fitting. Some condemn curve fitting as randomly choosing factors bottom-up to produce a smooth equity curve (viewpoint a). Others argue, curve fitting is exactly what investing is about - finding factors that work, and if they do, they do so for a(ny) reason (viewpoint b - I have exaggerated these two viewpoints for the purpose of clarification).
    I don’t think that these two viewpoints necessarily contradict each other. If we again take value investing as an example:

a) You condemn curve fitting by randomly trying out combinations of factors. Rather you study and reason to finally conclude that people are human and on average favor glamour stocks over cigarette butts. Top-down, you find that the price-to-book value might be a fairly sound proxy for identifying low-priced value stocks that reverse in the future.

b) You love “big data” and run tons of algos on different varieties of factors. Bottom-up, you find that the price-to-book value is an above-average predictor of future return.

Curve fitting in the bottom-up meaning is even more apparent in technical analysis. Many people argue that there is no sound theory behind technical analysis, yet professional investors run huge departments that do nothing else than valuing stocks and options by applying the principles of technical analysis. Finding a reason why this works (for example mean reversion, exaggerated fear) might be less apparent than using rigorous testing of a self-fulfilling prophecy that is more easily detected using a bottom-up approach (finding that it works simply because so many people believe in it).
So there is no good or bad curve fitting - it’s more a matter of technique and the process of building a model. It can be thoroughful either way. The model becomes more powerful if the factors can be both validated bottom-up (extensive testing) and top-down (reasoning).

Long story short - more oos data (robustness), more oos ranking factors (WYSIATI) and more rational designers and subs (by education and nudging) can improve the long-term design of models, the choice between them and the overall performance.

Best,
fips
Fama and French found a momentum effect: Fama and French article. There was no momentum effect for Japan but there was for North America, Europe and Asia Pacific.

To the extent that MA crossovers measure momentum, they can be expected to work. I guess crossovers measure change in momentum too and might also work (or not work) based on reversion to the mean.

As someone who studied some physics, backtesting with MA crossovers is curve-fitting pure and simple. It is not unlike adding sine-waves to create any curve you want (Fourier transforms). There is clearly a danger of overfitting.

Jim,

you are reading the right papers. I also find that Fama and French contribute valuable insights.

I am using parts of their research for example in my models RoT Bologna and RoT Munich.

As to momentum and technical analysis, yes, that’s curve-fitting at its finest. But then again, as Denny says, that’s what makes it work, too. People repeat these patterns and believe in it, making technical analysis a self-fulfilling prophecy.

Best,
fips

In my view MA crossovers are not self-fulfilling prophecies for three reasons:

  • If they were backtests would consistently show outperformance. That is not the case.

  • Self-fulfilling prophecies require wide consensus among all. That is not the case. People trusting MA market timing should account for a tiny part of total capital flows. And are easily cancelled out by those who swear by mean reversion. From all the successful investors out there I don’t know a single one who times the market with technical factors.
    Excellent understanding of micro and macro economics is what propelled the billionaires to the top.

  • Traders on average lose money. If technical analysis worked, they would on average make money.

Momentum is not the same as MA, since it cares about absolute return. A stock trading sideways will have no momentum but produce a horde of buy-high sell-low MA crossover signals.

Adding to Aurel’s point, momentum of an individual stock and momentum of the market as a whole are entirely different subjects that I have lumped together a little bit.

Moving Averages can be useful but not as a standalone decision tool. They can be effective in timing an entry (or exit) based on fundamentals that point in the same direction.

"Long story short - more oos data (robustness), more oos ranking factors (WYSIATI) and more rational designers and subs (by education and nudging) can improve the long-term design of models, the choice between them and the overall performance. "

I’ve said it before and I’ll say it again, eliminate the presentation of backtest results as “performance data” and you will get better models. More oos data is not useful unless it is going forward (live) with the whole world watching. Adding another 10 years of back data won’t help produce better models.

Steve

Well now. That escalated quickly :wink: I think it’s key to reason one’s thoughts and to use clear language.

From my experience and profession, I personally lean to the fundamental analysis. However, as life usually surprises us, the truth is not black and white. And that counts double for the stock market analysis.

Therefore, I like to take a step back and question the general (or at least my own) conviction. Just to broaden the horizon and to keep it balanced, there is for example also good evidence for the usefulness of technical analysis and momentum.

Here is a list in the order of Aurélien’s arguments (sorry, no finger pointing at you, Aurélien, just to keep a structure).

  1. Long-term momentum shows a consistent record of outperformance.
    In terms of technical analysis, Denny and Georg have also provided some evidence on broader overall market technical timing. To reiterate - I think it’s hardly possible for a strategy to provide Sortino on a monthly basis. Whatever you think of Buffett, I think we can all agree that he is no complete greenhorn in investing. It’s amusing to see that an experienced investor finally also extended his benchmark comparison from five years to seven years - a number that is sometimes referred to as a business cycle in economics (of course, estimates vary - I don’t want to dabble with the details here). Maybe we will witness him expanding his own benchmarking to “peak to peak” some time later in his Berkshire career :wink:

  2. As for self-fulfilling prophecies, there is no need for consensus among all. Rather, it is enough to have a consensus among most investors. Also, there is a difference between long-term momentum and short-term reversal. Stock market analysis is no exact science, but there is evidence for a short time frame for the tipping point. N. Barberis and R. Thaler provide an excellent start on that topic (and many other first leads on inefficiency).

  3. Trading in terms of high turnover is an overall problem and not specific to technical analysis. Average trader Joe using a common broker relying on very sketchy technical analysis tools loses money as does the value investor who gets cold feet the second he sees his cigarette butt to drop two more percentage points and who then sells too early. Professional (ultra) high frequency traders with glass fibre access to trading centres in NYC, London, Frankfurt etc., access to order books and huge volumes don’t usually don’t face the common investor’s problems.

Again, Aurélien, I just picked some of the points to shed light from a different angle on things. No offense inteded. Just saying that we all need to embrace the whole picture and that some strategies work (either because enough people believe in it or because too few people know what happening (and those gaps can be exploited)).

To add two more cents:

Mean reversion is pre-built within humans and can be exploited both by value investing and technical analysis). Needless to say it is very difficult to time either way. But the general notion of mean reversion is evident.

If markets were transparent, fricitionless and humans were econs, then strategies would slowly cease to exist as everyone is exploiting the differences between price and value.
However, markets are neither transparent nor frictionless and humans remain humans. If strategies tailor these characteristics, there’s a good chance that the underlying ideas might prevail at least for an above average period of time.

On the topic of performance presentation, I agree with Steve. My statement about “more oos data (robustness), more oos ranking factors (WYSIATI) and more rational designers and subs (by education and nudging)” is referring to more live oos data. More backtesting (in-sample) data is nice to have, but the emphasis for better models certainly lies on the designer and sub’s focus on forward oos data.

Best,
fips

Very true. OOS data should be the default. It will remove much of the incentive to game the system to showcase good past results. Incentives matter.

My background is fundamental investing. I had a great deal of success in my own porfolio using fundamentals only using a Mohnish Pabrai style system (which is modeled after Buffett), so it took me a long time to accept that momentum works. But I now think that momentum is statistically proven beyond a reasonable doubt statistically.

Proven to do what? That depends. Market timing momentum will generally reduce risk and risk adjusted returns. Often returns will be lower in a bull market. Stock picking momentum on the other hand works on average to pick winners from losers during most periods and over the long run.

Why does momentum work? Although it is difficult to prove and therefore difficult to know for sure I would like to make a case for a different reason for why momentum works.

Market timing momentum to reduce risk
Why does market timing using momentum reduce risk?
Once we establish that it reduces risk the question is why. It does not seem very likely to me that market timing momentum works because of sentiment. If it did then it would mean that investors are pulling out their money on the way down and putting money into the market on the way up. I think that the records indicate otherwise. There are records of the money flows. We know how much of the market is owned by mutual funds, how much by hedge funds, by banks, insiders etc. These categories own the vast majority of the stock market. We also know that the vast majority of these don’t actively time the market using momentum. We also know that during bear markets people were buying mutual funds on the dip but were selling even on the way up after the market bottomed which should work against momentum. Let me reiterate: the evidence indicates that the market overall does not rise and fall based on sentiment.

If you believe that market timing reduces risk (as I do) then you must believe that falling prices can sometimes be either a cause or a symptom of future falling prices.

Why would falling stock prices cause further falling prices if not for sentiment? Some reasons that come to mind are:

  • Margin Calls. This needs little explanation.
  • Reduced money in the economy caused by a falling stock market. This can be because traders’ have less money to spend or because financials such as banks have less money available to lend since the market value of their holdings goes down. Less money to lend causes less money in the economy (see below under credit).

Why would falling stock prices be a symptom of future falling prices?

  • Since credit (the money supply) is highly correlated with the stocks market as has been demonstrated by the recent QE I, QE II and QE III experiment in the US and by the QE experiment in Japan, then to the extent that a falling stock market is a symptom of credit tightening it can predict future falling prices.
  • Recessions are highly correlated with the stock market (who wants to buy businesses when businesses are not making money?)

I have seen evidence that almost all bear markets (defined as a severe correction of 20% or more) were correlated with either shrinking money supply (such as 1929, 1974, 1982, 1987, 2002 and 2008) and/or a recession which is a shrinking economy (such as 1929, 1937, 1974, 1982, 2002 and 2008). These dates are off the top of my head. There are probably more bear markets that I left out.

Why does momentum work to pick stocks?
Some putative suggestions:

  • Sentiment. Unlike the market as a whole, it is quite possible that sentiment does play a role in picking which stocks to buy. Portfolio managers do use momentum to pick stocks. Also, as the prcies of momentum stocks as a group go up the momentum traders get richer and they have money to put into buying more momentum stocks–until they don’t.
  • Dawning realization. Fundamental investors are human and have a hard time changing their mind. As the company starts picking up speed in growth investors keep readjusting their expectations of earnings upwards.
  • Window dressing. Most portfolio managers are very conscious of the stocks that are in their portfolios that get reported to investors. They therefore sell the lower performing stocks and buy the higher performing stocks before the end of the quarter to show investors how good their picks have performed in the past.
  • The bidding process takes time. Let’s say that everyone realizes that a company is worth more. People will buy the stock. But as long as the value is not clear, investors will not bid up the price to it’s full value right away. Buyers want to get the best deal possible for themselves. It takes months for a stock to get bid up to full value.

Why I think MA crossovers are a self-fulfilling prophecies: A hypothetical discussion.

Let’s assume for discussion sake that there are only a dozen investment newsletters and/or websites that use the 50 day and 200 day crossover for at least part of the author’s recommendations (the author may or may not disclose that). Let’s also assume that there is only a total of 100K subs to them (not a very big number for typical newsletters). Some of the newsletters/websites will have daily updates and some will only be weekly. If you don’t believe that the 50D/200D crossover is widely followed, just check StockCharts.com. The 50 day and 200 day are default overlays on every stock’s chart and there are hundreds of thousands of followers of StockCharts. It is also used on many other charting sites and is even frequently discussed on CNBC TV.

Now let’s imagine what happens when a crossover from low to high occurs. First, some of the subs to the daily websites will be very diligent and get the recommended signal that day, and will act on it the next day, some at the open, some with a limit order, & some with a market order. So maybe out of the 100K there are a few thousand subs buying hundreds of thousands of shares greater than the normal daily average. Other subs that aren’t quite so diligent won’t check the website or act on their email signal until a few days later. That becomes another thousands of subs buying hundreds of thousands of shares over each of the next few days.

Next, the weekly newsletters send out their signal recommendations, and again there are thousands of traders/investors buying hundreds of thousands more shares over the next few days. The stock has now risen over the last week or more, and that triggers some momentum traders to take notice. Thousands more shares are bought and the price continue to rise over the next few days or weeks.

However, there is no news out of the company or recommendations out of analysts to justify the increase in the stock’s price, and the profit takers start to sell shares. Momentum is broken and the price reverts to the mean.

Whether or not the price increase lasts only 1 week or many weeks it is totally due to the crossover that started it all. All that is required for the above scenario to happen is for 100K subs to be triggered to buy hundreds of thousands of shares purely because they follow a signal that they believe works (even if they don’t actually know what the signal is based on).

Now consider, the dozens of MA crossovers and TA indicators that use the same price/volume data to come up with a buy or sell signal. There are many that will trigger a signal within a few days or weeks and in the same direction as the 50D/200D signal. So we have another 100 thousand + people buying in the same time period. Any signal that triggers in the same time period, and in the same direction reinforces the other signals. It is undeniable that, at least in the short term, that these signals work. There is way too much money following them for them not to work.

One problem with any long term single like the 50D/200D is that there are a lot of short term signals that tend to short circuit the long term signals as soon as the profit takers or any other factor negatively effect the price. That is the primary reason why the long term signal fades out over a short period.

Aurélien,

You own charts above show the value of the MAC system’s predictive value. Instead of comparing the number of times the signals underperform or outperform, just look at the huge savings from the max drawdowns on your 6 charts. Even if there were no overall total performance gain from the signals, you can’t deny that just the savings from the max drawdowns shows that it is worthwhile. As long as the profit loss from the whipsaws doesn’t wipe out the savings from drawdowns, it is a win-win. There were plenty of drawdown periods in the 65 year history of the Georg’s MAC US system’s test to justify statistical significance.

Aurélien and Denny,
Here are the performance figures of the MAC-US from 1965 to 2014. MAC-cash did marginally better than buy&hold, which is also apparent from Aurélien’s charts. MAC-bonds did 3.5-times better than buy&hold. Terminal values are for an initial investment of $1.00. MAC was 68% of the time in the market, the other 32% of the time in bonds.


MAC-US performance 1965-2014.png

“Market timing momentum will generally reduce risk and risk adjusted returns.”
I think perhaps Chipper meant to say improve risk adjusted returns. In a number of tests I have found that moving averages generally reduce risk and improve risk adjusted returns, but not necessarily absolute returns. I think this is demonstrated in AureLaurel’s charts. As to why it works, I think it is simple herd mentality.

[quote]
“Market timing momentum will generally reduce risk and risk adjusted returns.”
I think perhaps Chipper meant to say improve risk adjusted returns. In a number of tests I have found that moving averages generally reduce risk and improve risk adjusted returns, but not necessarily absolute returns. I think this is demonstrated in AureLaurel’s charts.
[/quote]That is what I meant, thanks. I should have an editor :). [quote]
As to why it works, I think it is simple herd mentality.
[/quote]The herd was moving out of equities (as far as I can tell) even after the market bottom in March of 2009. Yet the market went up sharply against the herd. Why? Supply and demand seems like a plausible theory but the herd mentality theory falls short on this and on numerous other occasions.

Chaim and all,

Do you mean there was a net move out of stocks? Perhaps (probably) there were a large number of buy-backs fueled by low interest rates, simultaneously keeping the EPS up?

I’m asking. If true, this is the kind of thing that I just can not predict but makes a good story in hindsight.

Jim,

Yes, and no. The numbers that I have seen point to a net move out of stocks by mutual fund investors. But there could not have been a net move out of stocks overall in March of 2009 because that would have prevented the market from rebounding. Supply and demand and all that. The question is only where the money was coming from/going to, was it tactical allocation/herd following that caused the bear market and the rebound or was it the available supply of money (or lack thereof) that caused the market to crash and then to rebound.

Net buybacks were actually following the herd the most. Net buybacks were way down in 2009. Earnings were still shrinking (until at least June of 2009) and companies couldn’t afford it. Besides, CEOs who do buybacks during bear markets could risk losing their jobs even if the company has plenty of money. If EPS goes down they can just blame it on the crash.

If what I am writing is correct then bear markets can be predicted; but not always by following the herd.

There are a number of market events that are not explained by the herd mentality but is explained by the amount of money available to invest. Some examples:

  • What causes the market to rebound from the bottom? Not herd mentality. If you recall the herd was selling in March of 2009 when the market started rebounding. But there was more money oing into the system via the financial institutions that started having more money available to invest in equities due to QE and the Fed.
  • What causes the rebound from the bottom of all bear markets? Not herd mentality.
  • What caused the market top in March of 2000 (the peak of the dot com bubble)? The herd was jumping in, not out. Market sentiment was very favorable. The money supply theory explains this very well. The market peak of March 2000 coincided with the Fed tightening after the Y2K scare was over.
  • Where are all those people who know how to sell precisely at the market top and buy precisely at the market bottom? Can I join one of those funds :)? I have not found such a fund yet. Most market timers fall flat on their faces most of the time. The money supply theory explains this very well.
  • Why has the Fed’s QE and Japan’s QE been so highly correlated to the stock market? Is it just meaningless sentiment? The money supply theory explains this very well.

I can go on, but I think that I have made my point. The facts say that it is the amount of money available that drives the market; not that the sentiment. If anything sentiment is shaped by the market and lags the market. Moving averages may be useful as an indicator if you don’t know the money supply but it seems more like a coincidental indicator than a true cause.