I’m trying to compare my performance over the last three and four years to all available ETFs.
My first questions is simply about the number of ETFs in the Factset / P123 Universe.
Is 2,683 the true number of ETFs listed in the USA?
Does Factset have some criteria for getting on their list of ETFs (min. AUM, Exchange, listed for >1 year)?
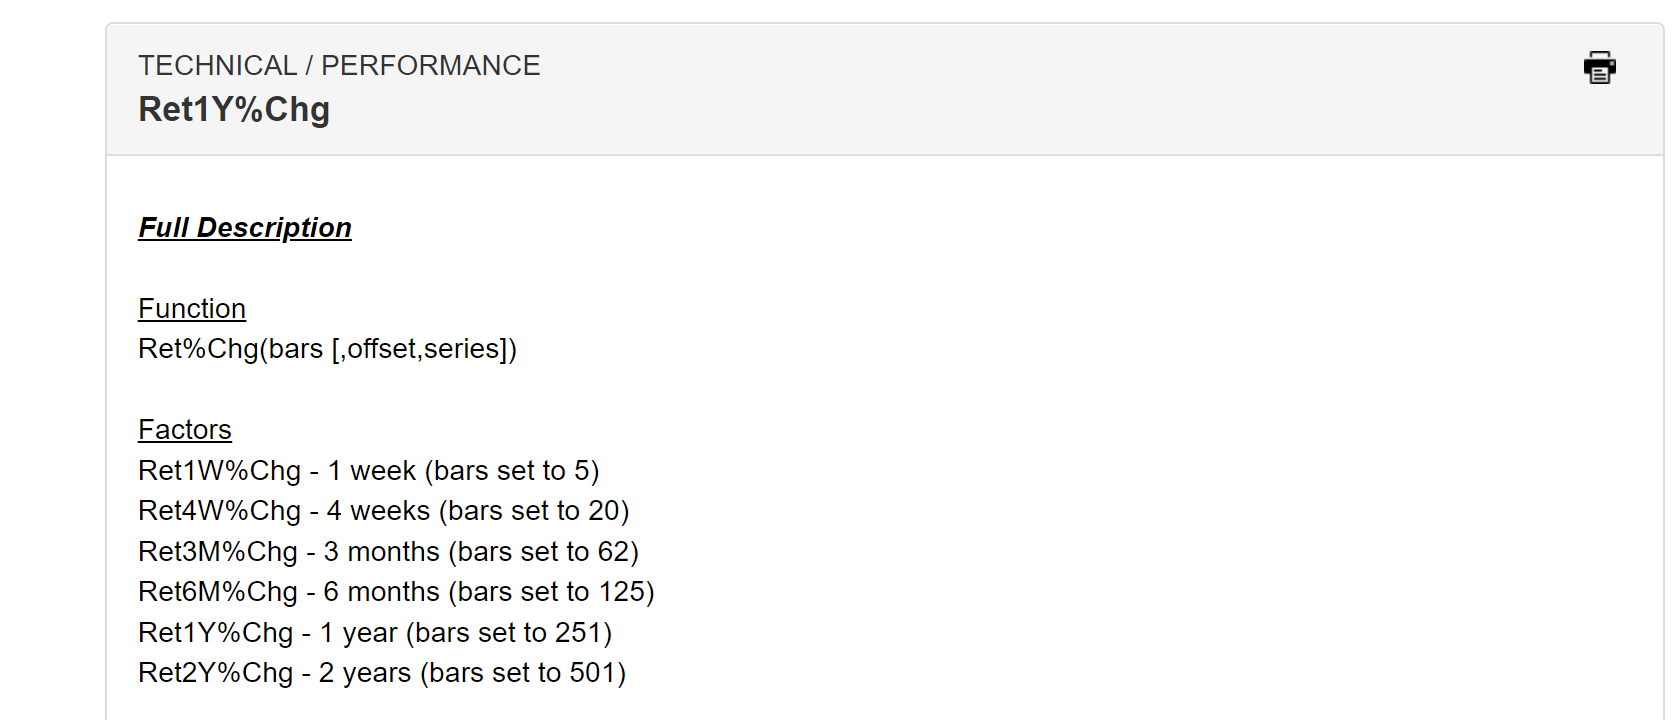
The second is about total return. I’m using the following rules to see my rank among ETFs. The reference says 251 and 501 is for 1 and 2 years respectively, so that is what I’ve done; but wouldn’t 502,753,1003 be correct?
ShowVar(@Ret1Y%Chg,Ret%Chg(251,0)) and Ret%Chg(251,0)!=NA
ShowVar(@Ret2Y%Chg,Ret%Chg(501,0)) and Ret%Chg(501,0)!=NA
ShowVar(@Ret3Y%Chg,Ret%Chg(751,0)) and Ret%Chg(751,0)!=NA
ShowVar(@Ret4Y%Chg,Ret%Chg(1001,0)) and Ret%Chg(1001,0)!=NA
It’d be nice to have official functions for 1,3,5,10 year total returns as those are quite commonly reported results (1 and 2 years is pretty useless for finding the best ETFs).
I hope this helps others see how they’re doing.
That’s the number of ETFs in our universe. It’s smaller than the number in the real world, but there’s no real rhyme or reason to what’s not in it. We need to classify ETFs into our taxonomy, and if it’s not in our universe but the search box resolves it then we probably just haven’t classified it yet. (You can drop a note to paul@portfolio123.com if you want to expedite a few particular tickers, and I’ll get it to you the next day or verify that it’s not in the database.)
You probably don’t want to compare to all ETFs anyway. You probably want to compare to some benchmark, and use a tracking ETF to do so. Using SPY as an example, it would look something like this:
SMA(50)>SMA(50,0,GetSeries(“SPY”))
The use of GetSeries is the important part, not the SMA. Any technical function with a series parameter can be pointed at any time series, including ETFs or aggregate series (put the name of the aggregate series in the quoted string).
For your second question, I personally like to use the #year constant. It stands for 251, and you can use it like this:
ShowVar(@Ret3Y%Chg , Ret%Chg(#year * 3,0)) and Ret%Chg(#year * 3,0)!=NA)
This is 753, and is easier to read when you return to the system after some time.
We are currently reviewing documentation, and I’ll take a look at the numbers that we recommend as part of that. Given the time frames, though, there will rarely be a significant difference between a 753 average and a 751 average.
1 Like
Thanks, Paul.
I like your use of
#Year.
It makes sense to me that if
#year is 251, then Ret2Y%Chg() function should have bars set to 502 (not 501) and Ret3Y%Chg should be 753, and onward (+251 each time) to 5 or 10 year return functions. Small differences that don’t matter too much, but over 10 years they matter a little.
I checked for iShares and Vanguard and it looks like you do have all their ETFs.
Why not just classify all ETFs that resolve in the search box with nulls in the taxonomy until you get around to classifying them. At least that way P123 users could see the fullest state of the ETF world reported by Factset. A full set of ETF data is worth $$$ and it seems like you are very close. It would also be nice to see AUM for each ETF.
Best