Hi all!!
Just a question;
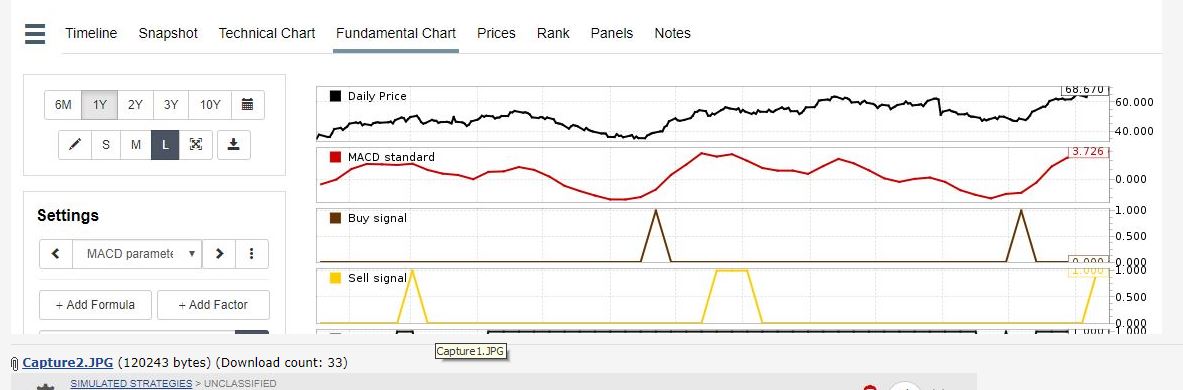
I found this Picture in the forum, and I would like to plot the buy and sell signals in the fundamental Chart too, but I don’t know how to start.
Anyone could help me?
Thanks!!
Hi all!!
Just a question;
I found this Picture in the forum, and I would like to plot the buy and sell signals in the fundamental Chart too, but I don’t know how to start.
Anyone could help me?
Thanks!!
The fundamental chart takes formulas and factors, so you can either use a true/false statement as a formula – the system will return a one if true, a zero if false – or you can build a custom formula to do the same.
I’d do the latter if you’re looking to use a rule system. It’s possible to put rules in a big bunch of custom formulas and then evaluate them together into a true/false. Put that evaluation in a custom formula, and you could just hook it up as a factor in the fundamental chart.
Of course, this is all a general/vague answer. If you’d like a hand actually implementing it, send me an email.
Thanks Paul, as soon I have time I will send you that email. ![]()