Hi
How do people calculate actual slippage (spread and market impact), using trading data, after the fact?
I want to see what mine is, based on real trading data, to then put into a simulation.
Hi
How do people calculate actual slippage (spread and market impact), using trading data, after the fact?
I want to see what mine is, based on real trading data, to then put into a simulation.
I recently wrote a small application with Claude to track this. It uses my broker’s API to pull transaction data and compare to the model estimates.
One of the main goals I hope to identify is the best order type/method for each stock.
Ultimately, I’d like for the app to create the order tickets via API (little leery to give write access) or a basket order file I can upload.
P123 allowing API access to DMs and group models would be useful.
Interested to hear how others approach this.
I am using this screener to get @impact and @spread: https://www.portfolio123.com/app/screen/summary/339719?st=1&mt=1
You have to supply the actual slippage for your trades and you will have provided the dollar trade amount here in the screen: ShowVar(@TradeDollarAmt, x) where x is the dollar trade amount of each trade.
Put that into a spreadsheet and ask Claude to give you the regression coefficients K and L for this equation: Slippage = K*@impact + L*@spread
The screen uses P123's default K and L to calculate slippage but after Claude calculates your personal K and L you can insert those into the screen to get the expected slippage with your trading method.
You might also ask Claude to give you a range for K and L and keep up the study until the ranges are small enough to suit you.
I also used Claude. We pull ticker close pricing with Tiingo and run an IBKR report. You could also calculate vs open.
Yes but what am I actually calculating?
Let's say the
Open is 100
High is 105
Low is 98
Close is 102
I paid 101.
What is my slippage?
Or do I need to think about it a different way?
So classically slippage uses the arrival price which is the price just before the trade(s) is (or are) placed. I say trades because a VWAP order has multiple child trades during the day.
So slippage is usually defined as (fill_price - arrival_price)/arrival price. Fill price being the average of all the child trades in a VWAP order.
For P123 you could use the open just before placing a VWAP order for the day if you place it just after the open. Also you could use the price before a single market order to calculate slippage.
Obviously for calculating your own slippage you would want to use the arrival price before your trading stated.
You may be able to get good answers using the average of high, low, and 2X close for a sim. You probably can, in fact. This may reflect the average arrival price when you place an order during the day.
I look up the price of the stock immediately before the order was placed and then compare that to the price I actually paid. Dividing the difference by the earlier price gives me the total transaction cost. The difference has to switch signs whether it's a buy or a sell order.
For example, yesterday I bought 13,304 shares of LCUT at $8.7354. The price was $8.58 before I placed the order. So I paid 1.81% in transaction costs.
I do that for hundreds of trades. I also write down the daily dollar volume, the median bid-ask spread over the last few weeks, and the stock's volatility. That way I can come up with a cost formula based on the data using simple regression tools.
So based on my trades, the formula for my transaction cost per trade is currently 0.275 * vol * (pov)^0.5 + 0.394 * spread, where vol = 100 * loopstddev("eval(avgvol(1,ctr)=0,na,(hi(ctr)-low(ctr))/close(ctr))",100), pov (percentage of volume) = dollar amount traded divided by mediandailytot(126), and spread = 100 * loopmedian("eval(vol(ctr)=0,close(ctr),spread(ctr))/close(ctr)",35). (The result is in percentages, i.e. 100 times the actual fraction.)
This won't work if you place orders before open. I wouldn't know how to measure slippage in that case. But if you place intraday orders, it should work fine.
I understand thankyou, how to calculate my slippage. It's based on the last price paid.
I now need to work out how to then translate to something I can put into a P123 simulation, which seems to be something different because I trade at various times during the day and the last price paid isn't in P123 and I
Need to decide the price for the transaction, e.g. Average of OHL and 2x Close
Put commission in (which I can do, appreciating it's different in the real world across different countries)
Put slippage in i.e. as I understand it, variance to 1) above
I would appreciate thoughts on this! I was thinking that because last price paid isn't in P123 I just compare price I paid vs Average of OHL and 2x Close, and input that as my slippage.
e.g. I paid 101, Average is 100, so I input slippage of 1% into a P123 simulation.
Thank you!
You can also use the advanced slippage option in a simulation, which calculates the slippage for every stock. If you just put in 1% slippage, you'll get the same slippage for a large cap as for a microcap, and then your system might be favoring microcaps too heavily and your real-time slippage will rise.
Always use that Average or next close; next open is unrealistic.
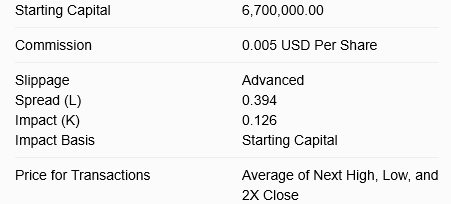
Here are the settings I'm using for Advanced Slippage:
If you're not using VWAP orders K should be significantly higher. Starting capital should reflect the actual capital you're devoting to your strategy multiplied by the ratio of the number of positions in the simulation to the positions in your real-life holdings.
Thank you, Yuval!
Entirely consistent with your post, I built a Claude Artifact that starts with your K and L values and adjusts them based on the member's data from their own executions. As you note with non-VWAP orders above, K and L values can change with different trading methods.
In Bayesian terms, it treats your K and L as an empirical prior and updates toward a member’s specific data. It builds directly on the extensive groundwork you’ve established so people don’t have to start from scratch when calibrating their slippage parameters.
Note: My setup is slightly different (though still grounded in Yuval’s core market impact framework), so I haven't used this Artifact much. It is fully modifiable, and Claude can readily help adapt and update it. You can do that with a free account. Because the data is handled directly by HTML/JavaScript in your local browser, your execution data remains private.
For modeling in a Portfolio123 backtest, I would suggest using advanced slippage with the following parameters:
Spread (L) = 0.2
Impact (K) = 0.35
Impact Basis = Starting Capital
Starting capital = $1M if that's what you're using.
Hey Yuval Thanks for this... I'm curious why in a previous post your Assessment was different for a $1M Portfolio or if the Values for Spread(L) and Impact(K) got flipped or something. What is the difference for a 6.7M portfolio between the two posts?
Good question, and it's hard to answer. I'm constantly tweaking my formulas depending on my latest results. The numbers I'm using now seem to fit a wee bit better than the old ones in my regression modeling. But there's very little difference.
OK. I don't understand the complex formula earlier but...if I do this would that more or less work?
Question: If I placed a Sell pre-Open using a limit order (as cannot use VWAP in many markets), and then changed the limit price as the price moved during the day, then what would be the "last fill"? Would it be the close from yesterday or the last fill just before I change the limit price?
I know as my portfolio hopefully grows, then the slippage will increase if I buy the same stocks. But I think I should recalculate the slippage maybe once a year to accommodate that. Because if the portfolio grows say 20% in a year, then it wont make too much difference to slippage I imagine.
What do you think of this approach?
I don't think you can use pre-open orders for measuring slippage. I don't do that myself and I haven't seen that being done in any academic studies on transaction costs.
You could do that, but if you're testing different approaches in your simulation and you keep the slippage fixed, you might end up favoring systems that are far more expensive to trade than your current system. I suggest playing with the advanced slippage numbers, measuring the actual slippage using those numbers (by looking at your transactions), and seeing if they match what you're paying. Once you find some numbers that produce results that you find reasonable, then just use those.
Correct. Different execution methods naturally have different slippage characteristics which begs the question: Which trading algo should I use?
If you're comparing two methods (e.g., VWAP vs. multiple limit orders during the day), the natural inclination is often a standard t-test or a fixed A/B split (which I was about to do). However, an adaptive approach like continuous Thompson sampling is far superior for minimizing cumulative regret—meaning you spend far less money and time executing the losing method while still gathering data.
Rather than tracking raw basis points (which vary wildly based on order size and volume), you can run continuous Thompson sampling directly on the execution parameter K to normalize for liquidity across trades.
A simpler binary version that is posted on GitHub is discussed here: Interactive Brokers Algo Optimizer App thread.
If you have a specific pair of execution methods you are comparing, Claude can easily generate a customized Python script or Artifact tailored to your data to update the posterior distributions after each batch of fills. Claude understands Thompson sampling very well and a member would not need me to help create a prompt. Or you could share this post and see what Claude thinks about it. Then tailor your own method.
In fact, Claude is writing some code for that now. I am still considering whether to take my own advice on using Thompson sampling, but regardless I will use P123's very nice slippage formula (thank you P123 and staff).
Note: Done the way I described above, it is actually a contextual bandit making this pretty advanced (which does not mean that Claude cannot get you up and running). Netflix uses contextual bandits when showing the artwork for a movie and using whether you click on it or not as the metric. So my parameters (e.g., male that like action flicks) are different than my wife's. In this case the volatility liquidity spread etc are specific to the stock.
This is one reason I see a lot of artwork that is different from when my wife is signed in and looking for a movie. .