Hello fellow P123 users:
I would like to start a discussion on robustness. Just what things can we do to design ranking systems and strategies that will work in the future generally as well as they have worked during testing. To get things going I will outline my current approach. I look forward to comments on what I am doing. And I equally look forward to hearing of things that others are doing to increase robustness.
Before stress testing in simulation mode, I do several tests using P123’s Ranking Performance. This saves time in simulation testing. This first post is going be long enough just looking at Ranking Performance, so I will leave my ideas for Simulation Stress testing for another post - perhaps someone else will get that started.
RANKING PERFORMANCE FOR ROBUSTNESS
I like to test ranking systems over 4 time periods and over subgroups of market capitalizations.
My preliminary test is to run a new ranking idea on the entire P123 history (2001march-present) using my 4K custom universe. This custom universe excludes stocks that I would never invest real money in by requiring minimum price and volume and a minimum market cap and I personally exclude OTC stocks. If a ranking idea does well on this, I go on to the following to test for robustness.
I see how it does on the 2,000 (approx) smaller caps (mktcap 25-1000) and the 2,000 larger caps (mktcap>1000). Almost every ranking system works better with small caps, but ideally I like to see that it still works, albeit not as well, with larger caps. Often the ranking system does a lot better with the 2K small caps than the 4K group, but sometimes it is about the same. This tells me if including the large caps “weakens” the ranking system, or if the ranking system is smart enough to produce equally good returns if given the change to put some large caps into the top buckets. This gives a heads up for what mktcap filters to use when I get to the strategy simulation stage of development.
Next I do time segmentations. I want to see if the system can do well in the 3 major market conditions for which we have P123 data. So I rerun the ranking performance tests for the following time periods:
2001 - Present (got to do well or I don’t bother doing further tests)
2001march-2003march (bear period with 3 bear rallies)
2003march-2004oct (rocketing bull – every long system does well)
2004oct-2007oct (“typical” bull with pullbacks)
I take a careful look at the bear period 2001march-2003march. At a minimum a system has to not do worse than the benchmarks (SP500 and Russel2000), but ideally it should make money on the short term rallies during the bear. I don’t pay much attention to 2003march-2004oct because we will rarely seem that type of extreme bull run and if we do it will only be after a major bear (which will ample advance notice that conditions are ripe for anther rocketing bull). I also look at the last 3 years (2004oct-2007oct). Once we get another year of data, I might divide this into 2004oct-2006oct and 2006oct-2008oct).
The two most important periods are 2001mar-2003mar and 2004oct-2007oct which give me a handle on a systems consistency over time.
LOOKING FOR RANDOMNESS
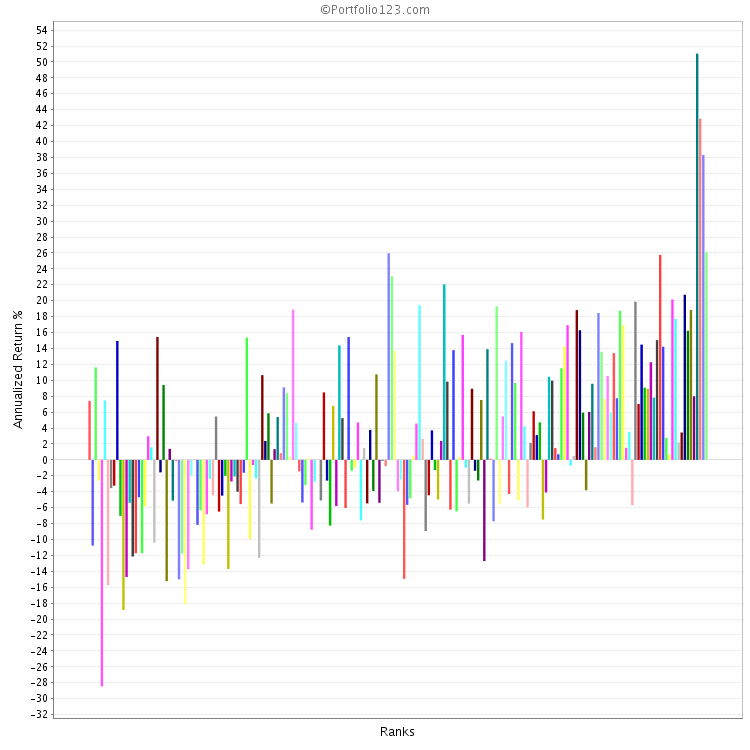
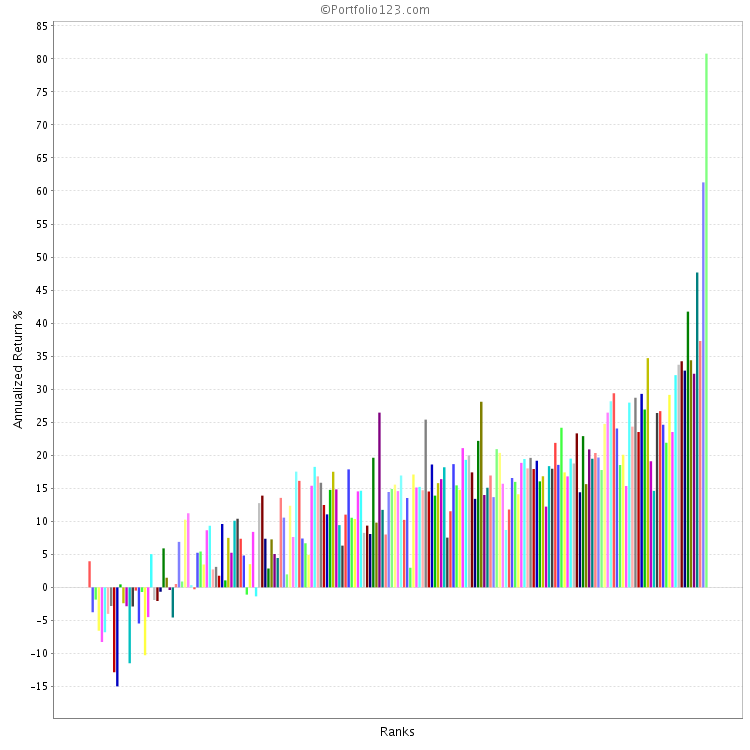
I also keep an eye open for randomness. At what point does market “noise” or “randomness” start to overwhelm the power of the ranking system I am considering? When doing ranking performance tests I like to see how the system performs with bucket sizes of 5, 10 and 20 stocks.
Using my 4K custom universe of liquid stocks, a 200 bucket test has 20 stocks per bucket. Generally this gives fairly smooth curve for the top 3 to 5 buckets (I only care about the top buckets). So to seek out the line where randomness appears, I use some smaller custom universes based on market caps:
4K_all = stocks meeting basic liquidity (also no OTC, no ADR)
I may or may not add ADRs back in. A ranking system should do well with or without ADRs so this is not a big issue for me when testing for Robustness using ranking testing).
This gives 20 stock to each of the 200 buckets.
2K_smaller cap (mktcap>25 and <1000) (same liquidity as 4K_all)
2K_larger cap (mktcap > 1000) (same liquidity as 4K_all)
These give 10 stock to each of the 200 buckets.
1K_micro cap (mktcap>25 and <350) (same liquidity as 4K_all)
1K_small cap (mktcap>350 and <1000) (same liquidity as 4K_all)
These give 5 stock to each of the 200 buckets.
Some ranking systems begin to show randomness affecting the top buckets when the size gets down to 10 stocks and many do for 5 stocks. This is especially true when one is looking at 1.5-2 year time periods (see my time periods above). Implications: if a 5 stock bucket does better than a 10 or 20 bucket over the full 6.75 years of P123 data, one needs to be aware if one will have to endure some short term periods of poor performance caused by randomness.
Personal perspective: Given my personal risk tolerance (or lack thereof), I consider it very important to know when randomness can be expected to overwhelm the native power of the ranking system. I get a handle on this from tests using segmentations of time and market cap. This helps me decide on the size of portfolio use when testing in simulations (and that is a topic for another post).
Comments? Could I be doing this differently to get better results, or to save time and effort? Am I missing something I should be looking at when doing ranking performance testing?
Brian (o086)