How was 2021?

Hi Jim,

The fact that IB here calculates stats using monthly data points explains the low standard deviation.
I am currently not using any effort to control risk. Except having 10%-20% cash at any time.

I use multiple strategies for two main reasons:

  • To have more positions and thus lower capital invested per stock (to minimize market impact)
  • To have better diversification (I select strategies so that each one has lower than around 60% correlation with all others - every single one)

Azouz,

Thank you. Very helpful. Especially, the above quoted portion.

Best,

Jim

Everything that has been stated by others above regarding the advantages individual investors have is absolutely true. It was mentioned above that individuals cannot beat the ‘pros’. Of course individuals as a group cannot consistently beat the very best of the pros. But what Yuval does, and I do, is to trade the small, illiquid stocks that the pros cannot trade. The people trading those stocks are mostly untrained individuals that dont have access to tools like P123. If you had to choose between fighting Tyson in his prime or some random dude on the street, which would you choose? I fully believe that somebody like Yuval that has spent the time to educate himself and learn how to use the tools available on the site, will consistently beat the stock indexes by a wide margin.

I started using P123 in 2004. At that time I knew very little about the markets. I spent a lot of time in the 2000s reading books and experimenting on the site to see what factors and rules actually worked. I still do research projects from time to time, but mostly I just use systems built on my prior research. My point is, I am not the same caliber of investor as Yuval or as many others on this site.

I have 9 accounts that hold p123 stocks and they all have other things mixed in, so the stats are not helpful. The better way to show my P123 returns is a screenshot of my P123 systems. Since 2004, I have manually entered every trade, so the returns are accurate. I currently have 8 portfolios running. They are sorted by 1Y return in the image. 3 of them are new this year, so they dont have 1Y stats yet. 2 of those are sector specific (banks and energy). For the 5 that have 1Y stats, the average was 53%. But 1YR doest mean much. Look at the Total Return vs the Bench Return - that is what is important.

As for survivorship bias, I can address that also. For as long as I can remember, whenever I decide to stop investing in a system, I switch it to ‘auto’ rebalance and move it to my ‘live at one time’ folder and let it run forever so I can see how it does. Most of them have commissions and slippage set. I dont think I ever deleted anything from that folder, but I cant say for sure. Another part of my process is to create a ‘baseline’ copy of every system I invest in. It is a copy of my live system but it runs on auto rebalance. I use that to see how my choice to override the system have worked out. The ‘live at one time’ folder also has those old baselines - that is why there are 80 systems in that folder - it is actually probably 50 or so unique systems.

Of those 80, there are 13 with negative returns this year. 7 of those are gold/silver stock systems (there are only 2 other sector specific systems). There are 5 with 0% 1Y returns - those are meaningless since they were turned off and didnt auto rebalance. If you take out those 12 systems, then the average 1Yr returns for my retired systems was 44.4%. Leave the gold systems in and the average is 37.9%.

I would rate myself as a horrible investor. At any given time, I am more likely to think the market will be going down rather than up. I could never do the ‘buy and hold’ strategy where I hold stocks after my retirement accounts are down 40%. I would sell and miss the rebound. So my strategy has been to hold P123 stocks with some sector ETFs mixed in and heavily hedge. Those hedges have been expensive, but they protect me from myself and have allowed me to beat the market since 2004 and never loose any sleep at night. I would not have been able to do this without P123.


junkyard3.JPG

Dan,

Thank you for sharing. I do this also. My main theme (I hope) has been that this is especially important for people who are new to P123 because it can be difficult to know for sure that a strategy works to begin with–let alone how volatile it will be out-of-sample.

I can tell that you are not using leverage.

One of the questions I have had is are the slippage estimates for micro-caps with poor liquidity accurate for the Designer Models?

I am not sure what type of liquidity you use. But stocks with $10,000 ADT have been discussed on the forum. Do you think the slippage is accurate for the Designer Models when the liquidity is that low? How much can one invest in such a strategy without significant market impact?

As far as I am concerned, an understanding of the true slippage of stocks with liquidity that low would be the main advantage of P123 showing us a traded portfolio.

Also would you consider running a small sample of your better preforming ports as sims (with the same rules as your port) and make comparisons (whatever you feel might be pertinent). I would be fine if you said you ran x samples and found little difference or an average of y% in the returns. I trust what you say and would appreciate any information on the subject.

I am not kidding when I say my holdings differ significantly. You have helped me with this question before. This would help to address questions about slippage also.

Thank you for sharing. And thank you again for helping me in the past with one of my main concerns: why are the holdings in my sim so different from the port? And does it really matter?

Jim

Hi Jim,
I have never started a designer model, but I did follow a few at one time and I had no issues with liquidity on those particular small cap models. The page below mentions the liquidity requirements and they seem to be adequate for most individuals.
[url=https://www.portfolio123.com/app/r2g/myr2g?view=models&st=8]https://www.portfolio123.com/app/r2g/myr2g?view=models&st=8[/url]
“Liquidity requirements: Stocks in your model ranked in the bottom 20% in terms of liquidity must average more than $150,000 in daily turnover.”

Most of my older ports used the rule AvgDailyTot(20) < 200000
In the last year or so I have reduced the liquidity requirements using rules like: AvgDailyTot(20) > 100000 OR LoopAvg(“Spread(CTR)”,20)/price*100 < 1.5 //avg spread < 1.5%
I have not had much difficulty trading these when buying $5-25k in each stock.

I’ll run sims for some of the ‘baseline’ ports I have and let you know the results. I’ll send you an email since I dont want to hijack this thread. There is no point in doing it for my live ports because I dont buy every stock they recommend. I expect that sims I run now will be very different then the results of those portfolios that are on auto rebalance. Some will be better and some will be worse because:
-They generally hold between 5 and 15 stocks. With so few holdings, any minor difference vs the sim can result in major differences in the results.
-The rules or ranking systems could have been tweaked at any time while I was trading them. So the older history would not have used the current settings.
-P123 had many changes over the years including changing data vendors.

There has been some diversion from the subject.

Pls show us something that is “independently tracked” which shows people making 75% or (100%+ that was mentioned) from buying small caps/micro caps in 2021. (like what Azouz has done.)

There are micro-cap and small cap mutual funds and ETFs as well as hedge funds that play in that space. I don’t think it is reasonable to expect members here just to believe what was stated before we can see some kind of proof.

Regards
James

I should add that designer models all use the variable slippage setting, which is extremely harsh on microcaps. If the daily dollar volume is less than $50,000, the slippage is a whopping 5% per transaction, and if it’s between $50,000 and $100,000, it’s 1.5%.

How’s this for “proof”? It’s a screenshot from Fidelity with the account numbers blacked out. All the figures are as of 12/31/21 and are annualized. The “Total” line is the pertinent one. Also I use some margin in the cash account. My margin debt right now is 14.5% of my total funds.


Yuval, Dan and Azouz too,

Thank you for the very significant amount of additional, good data.

Best,

Jim

Yuval,

Thanks for the screenshot and letting us know you trade in margin.

Without leverage, the return is closer 60% from my calculation. (the return is similar to your “crazy return microcap designer model”)

This is still 1/3 lower than the 100%+ return that was stated from trading small caps/microcaps with P123.

I will highlight again that there are hedge funds, mutual funds and actively managed ETFs that play in this space.

Regards
James


OK, here is performance from my bank(s) as well. Descriptions of each account/strategy in the pic filename. Blue rectangles hide account numbers. ** EDIT - first pic is incorrect, but cannot delete. Correct pic added at bottom.***


No. The return on my positions alone–without considering leverage or cash–was 70% in 2021. I never said it was over 100% in 2021. It was over 100% in 2020. I have never misrepresented my returns to anyone. I underperformed the market significantly in 2019 and have never hidden that fact.

I don’t want to rain on anybody’s parade and perhaps the results quoted here are real. But the stock-picking contest is the only mechanism other DMs that are truly verifiable. Someone can correct me if I’m wrong but there were close to 20 stock-picking entries in 2021, of which 9 were still around by the end of the year. The results are shown below (to today’s date).


These are the returns from last year Steve. I was the lucky winner
https://www.portfolio123.com/mvnforum/viewthread_thread,12652_offset,70

I appreciate Yuval, Azouz, Ryan and others sharing their brokerage statement proofs. None of them were obligated to. Maybe we can all learn from them :slight_smile:

I appreciate all of the new data. As far as pure volume of data nothing comes close to what Dan presented.

Before that we had the Designer models only (with some anecdotal stories). BTW Marc’s median model is performing at the benchmark he selected (with serious survivorship bias). Likewise, Yuval’s median model is performing at his benchmark. The average designer is doing worse.

Another fact that has been proven beyond any doubt whatsoever by the Designer Models is that, for the average user, in-sample sim results are negatively correlated with out-of-sample port results. For most situations, sims cannot be used to support a strategy. Not in isolation anyway.

That is the objective evidence we had up until now.

Surely there must have been other hard evidence upon which to make a decision about where to place your retirement funds? Well, P123 has a pop-up ad that suggests you can earn $1,000,000 at P123.

I totally agree that no one should have to show their brokerage account. But no one forced P123 to make a pop-up ad a very large part of the argument to join P123, either.

One could even say that a pop-up ad was THE SOLE BASIS for P123’s argument to join until now considering the Designer Model’s performance.

Now, I have new data that probably changes my opinion. I was probably going to leave in April before I got some new data in this thread. That was uncertain but it is absolutely true that I have no funded P123 models to share in this thread.

If I stay it will be largely because of the volume of data that Dan presented. BTW, he did that with no one asking him to and he obviously has an understanding of what constitutes real evidence. He has no pop-up ad that he might want to consider documenting.

IMHO, there is nothing wrong if anyone wants to see documentation of what has been almost the sole argument for joining P123 up until now. No one forced P123 to use a pop-up ad. Considering that they decided to go with the ad the only surprising thing is that they did not present some evidence for that a long time ago.

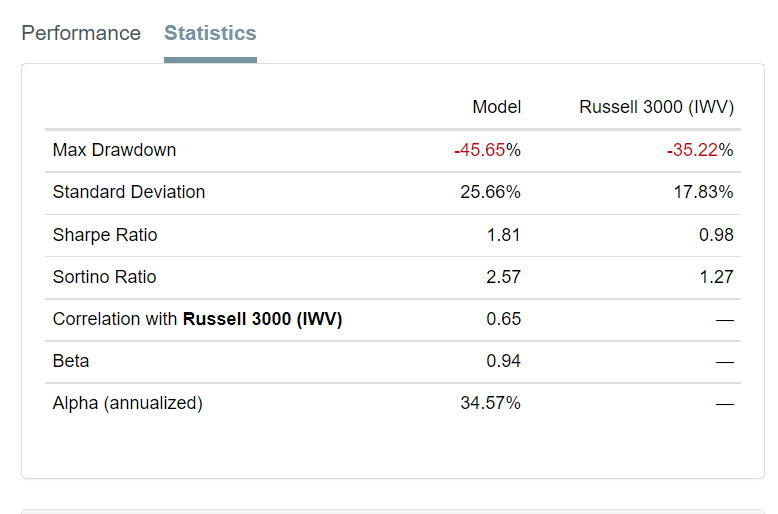
And some profession sites might have chosen to present something like Azouz did with volatility metrics and a Sharpe ratio if they were going to advertise a portfolio in a pop-up ad.

IMHO, it would not have to involve personal accounts but P123 might consider continuing to make a serious (professional) case for joining (and staying at) P123 as Dan has done in this thread. I do understand that when they were started, some thought the designer models would serve that purpose.

While not a shining example of how it should be, Zacks does make an attempt to validate its claims about Zacks rank without trying to imply they should not have to do so. But it would be true: They don’t have to do it. I don’t think there would be a Zacks today if that had been their approach, however. Certainly, I would not have visited their site more than once (if at all). As it is, Zack have gotten some money from me over the years. Largely based on some documented out-of-sample evidence.

Uh… Maybe that is an exaggeration. Zacks also markets to professionals and maybe the professionals funding Zacks operation don’t want to see any objective evidence that using Zacks’ data has the potential to improve their bottom line. Could be just me but I do not think so.

Best,

Jim

You are right on many points, Jim.

And many of us who have had some middling success with P123 do not know if the OOS results are going to last, so do not share. Also, AFAIK IBKR may be the only broker to compute Sharpe’s and Sortino’s on individual accounts.

For me P123 is also a data source to look at fundamental data, Not just a simulation engine. But equally good data is now available on many sites like TIKR or ROIC.AI. I wish we had more line items for marketing, SB comp etc.

To be fair, sites like Validea.com which also run algorithmic models have had marginal success with their strategies. Maybe there is value add in P123 adding such models?

Congrats to you and those that enjoyed great results last year. Value strategies are the place to be right now. I remember a year ago everyone here was lamenting that quant and value were dead. What a difference a year makes! Unfortunately, growth stocks (my specialty) are in a severe bear market and will probably remain that way for quite some time.

Inspector Sector,

Respectfully, you omitted at least one entry in the stock picking contest of 2021 (myself) as documented here, with a return of 18% and a sharpe of 1.33: (Probably because I named my port “Yearly Contest…”)

https://www.portfolio123.com/app/screen/summary/191518?st=1&mt=1

Incidentally, this proves that at least one value strategy was not “dead.” (More specifically, my strategy combined Low-Volatility and Reliable Dividends)…

Steve G

Hi Steve G - It doesn’t look like you followed the conventions that were asked for, and screens are easily modifiable :slight_smile: But anyways, 18% is a good achievement, so congratulations on a good year.

deleted.