Attached are some excel results that might provide additional guidance on sector selection. I have not used the quads for p123 yet. I was thinking to run a test like Jerome has proposed. I think some more work though could be done on quad definition as the range of results for a given sector for a given quad seems to vary a lot.
Sorry for the late response. I don’t have any specific evidence, only what I’m seeing in some of the models that I follow regularly. Attached are two models that have languished for a couple of years but are now showing signs of life.
It could be that it is the time of year, but “feels” more like an awakening than a seasonal thing.
Why put yourself through this? Instead of chasing Value which is a nebulous and fashionable thing, start with macro trends and you will have a much more pleasant investing experience.
These highly tradable (liquidity, low turnover) models are near the top of the heap for 1Yr % gain with gain > 30%. I have other macro trend models but I’m not posting them as Designer Models because the DM business model is busted. It needs to change.
Thanks. I am definitely looking into ideas where the port weights are adjusted automatically. And to be clear, I am open to the idea that some of my models will come back. I too see some early evidence that this could happen. Also, I do not claim to understand the macroeconomics of what is happening. That has not stopped me from posting multiple conflicting theories, as you know;-)
If you find anyone that claims to understand macroeconomics, then I suggest running for the hills because he is trying to get his hands in your pockets.
Macrotrends, what I am promoting is something different. It is pretty easy to identify massive growth areas such as the cloud, cybersecurity, healthcare, etc. They are no brainers. It’s a great place to put optimization and ML to work.
Hi Greg, Really nice study! Thanks for sharing this. I just glanced at it so far, but seems to advocate strongly for defensive sectors in the “slowing growth” quads 3/4 if we have confidence in our present macro diagnosis.
Again, really nice study - thank you for sharing. I’m actually going to have to learn some of your calcs. I didn’t know you could do conditional median and averages the way you’ve done. I’m still using Excel 2003, but seems like the way you’ve setup the calc works when I convert and open the file. That’s very useful.
Glad the spreadsheet was helpful. I don’t use the array function that often in Excel, so be sure to check the numbers; always nice to have another set of eyes. Note that the range for the “Industrial” formulas is shorter because there are fewer rows of data. Other than adjusting the range, it should be easy to add in other data series such as DWAQ for momentum by exporting from PortfolioVisualizer.
It would be nice if P123 provided the monthly returns for the SIMS, beyond just the latest year, as that would make it easy to analyze a SIM by quad (or other metrics). I couldn’t find this data. If someone knows how that would be great, otherwise it seems like that would be an easier P123 feature to add if there aren’t licensing restrictions and if others are interested.
Greg, I’ve learned much from this, including the non-market performance tips like the excellent excel tips and learning about the portfolio visualizer website for monthly data. The array formulas are new to me and something I’ve not worked with much, but very useful in this context. I have to be careful use them because of how it seems like I have to remember to enter the formula boxes and manually recalculate them if I change any data that precedes them - but very useful.
The worksheet has also been excellent to work with the data.
I think one thing that may be important with quads is the importance of being able to get the determination right in advance of it occurring, or as early as possible. I’m not sure I can do that with high confidence, so I did a few calcs where I lagged the quad determination by 3, 2, and 1 month, and that distinction seems to make a big difference. (When a transition to Quad 3 or 4 hit I’m doubt I’ll realize it on day 1, or even day 45). Most of the economic data is lagged and there’s often directional uncertainty as the time periods develop even after the data is released. I guess I feel like unexpected negative or positive “surprises” in the data might be behind return variances. For example: October new home sales just released today 11-26, so my data is quite a bit behind on that datapoint and I would not be able to make October or November allocation decisions based on it.
But anyhow, with that thought in mind I added some calcs to your excellent workbook and share it (attached below). I added SPY as well as doing quad lags for 3, 2, and 1 month to represent not catching the cyclical turns in real-time, but with a lag. My excel is old, so it wouldn’t calculate a few of calculations that you had, but I wanted to share what I had as I think it might be relevant in practical usage, especially if we have concerns about correctly calling quads in advance.
Again, thanks so much for sharing the data, and your calcs, and all that. I think I entered the array calcs properly, but please check if relying on. This was fun to work though and you set up an excellent template with great data to work with.
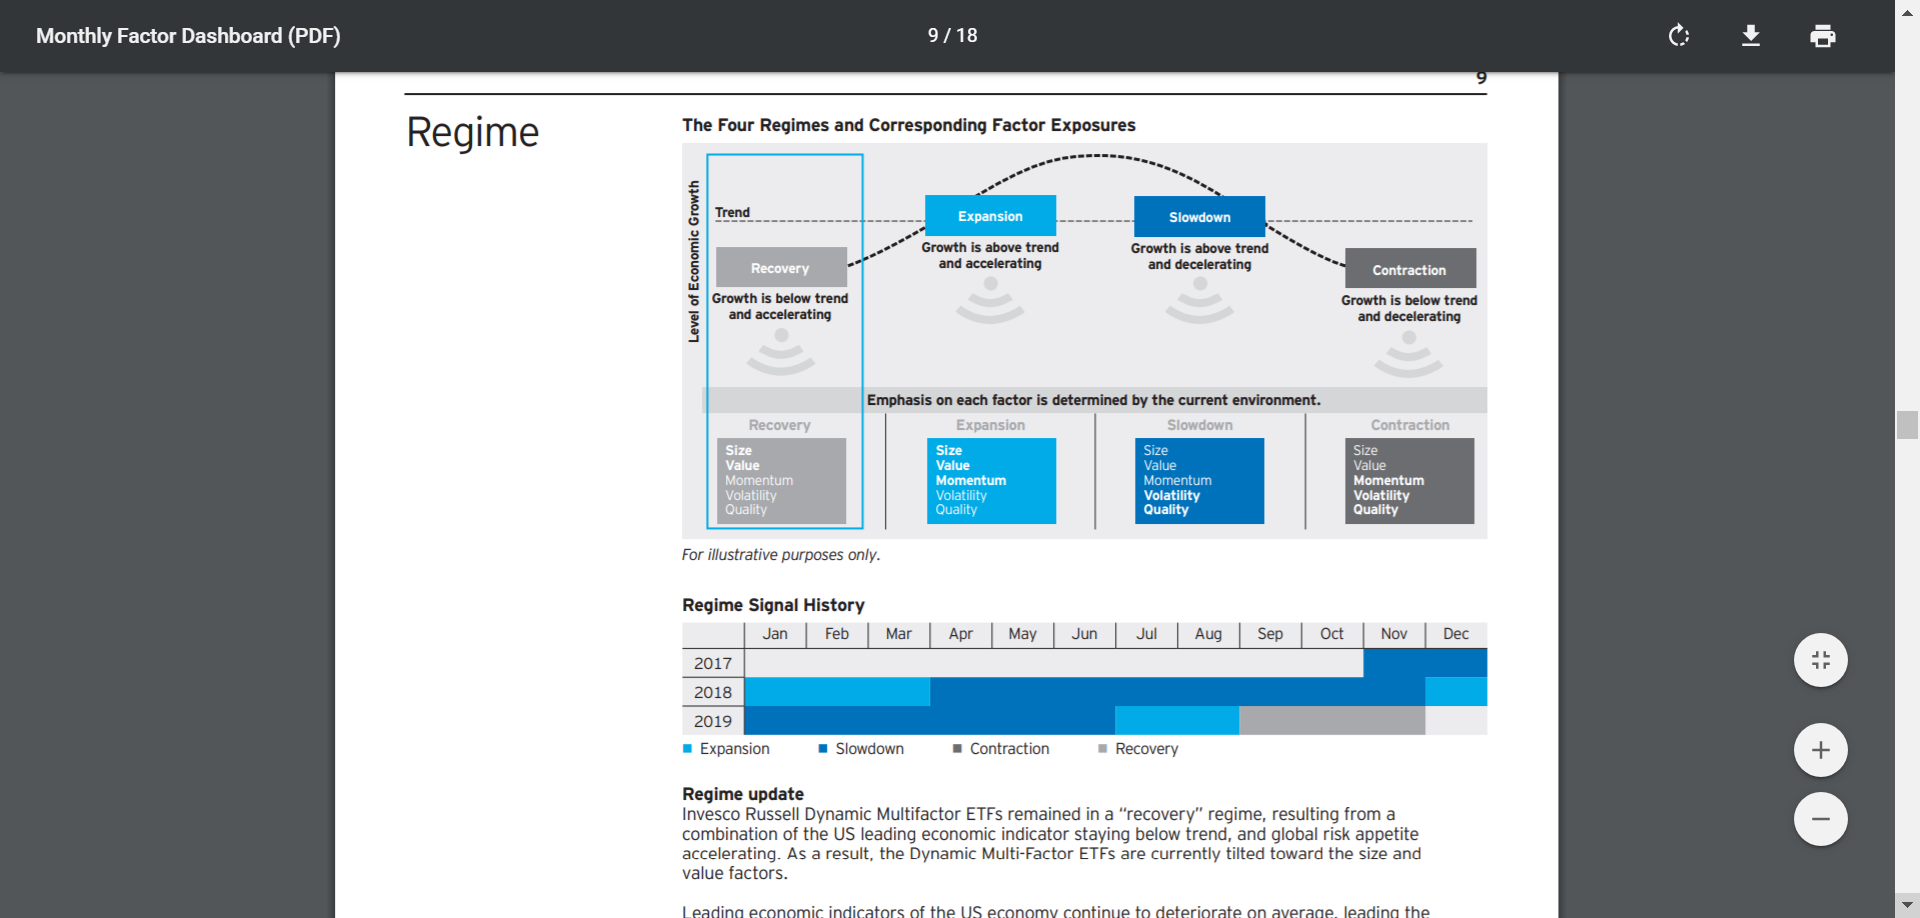
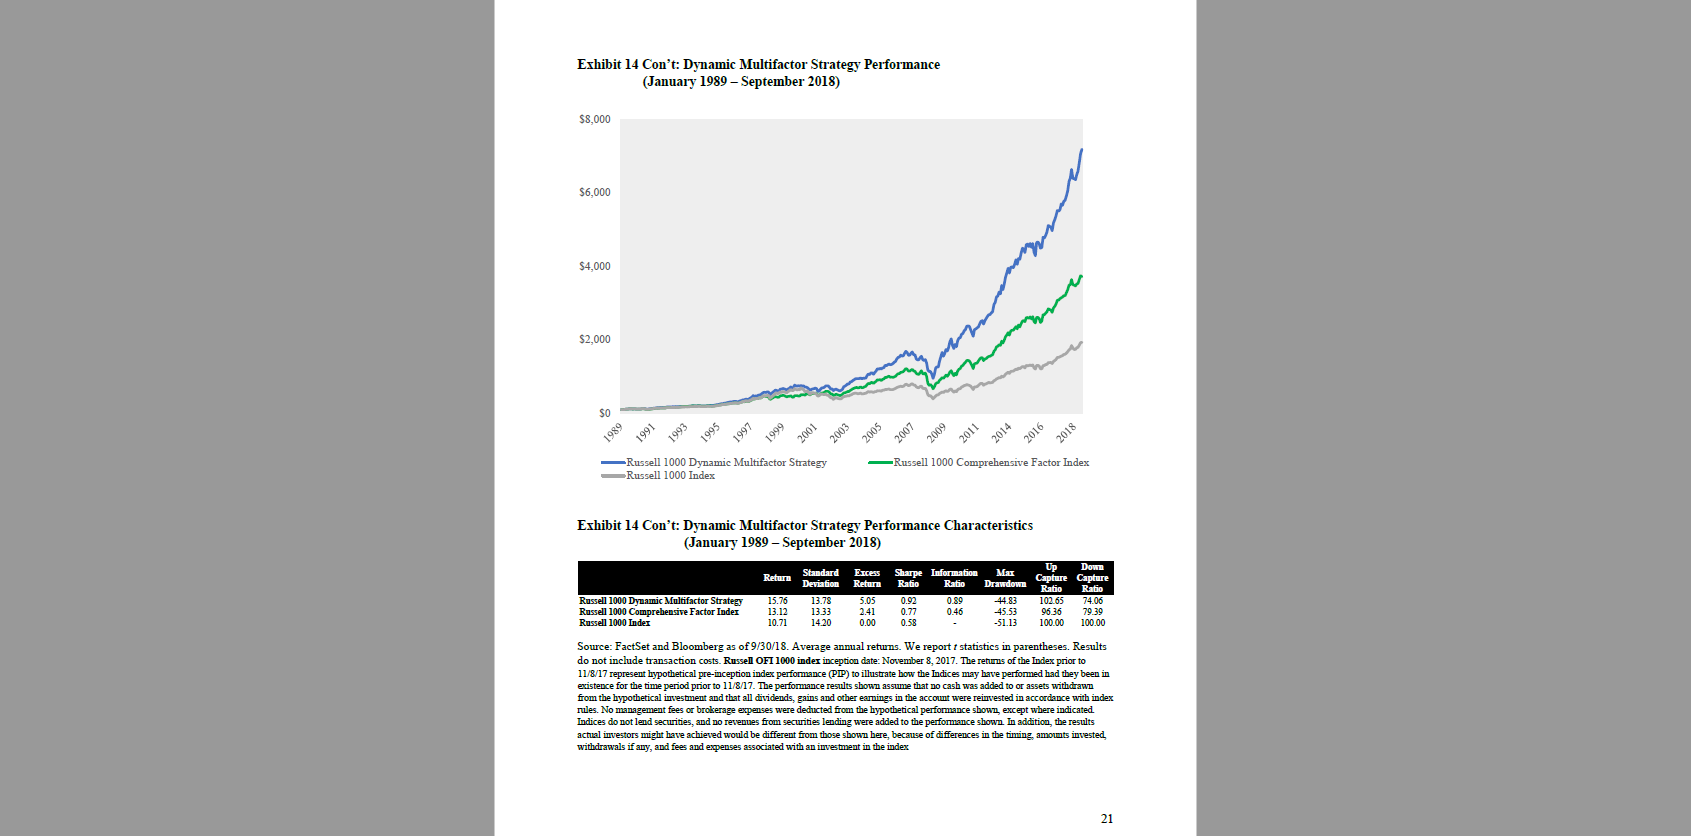
As an alternative to hedgeye, I suggest we can follow the rotation of factors in the OMFL (Russell 1000 Dynamic Multifactor ETF), its holdings rotate between Recovery (Size,Value), Expansion (Size, Value, Momentum), Slowdown (Low Volatility, Momentum) and Contraction (Momentum, Low Volatility, Quality) based on different economic conditions. The ETF holdings are available in the Invesco website. The ETF is currently in the Recovery Mode. I would personally add market timing to hold somthing like GLD/IEF in the Contraction stage instead of holding Momentum, Low Volatility, Quality stocks. This ETF has been extensively researched, I am attaching a research paper by London School of Economics/Oppenheimer Funds for reference.
ustonapc,
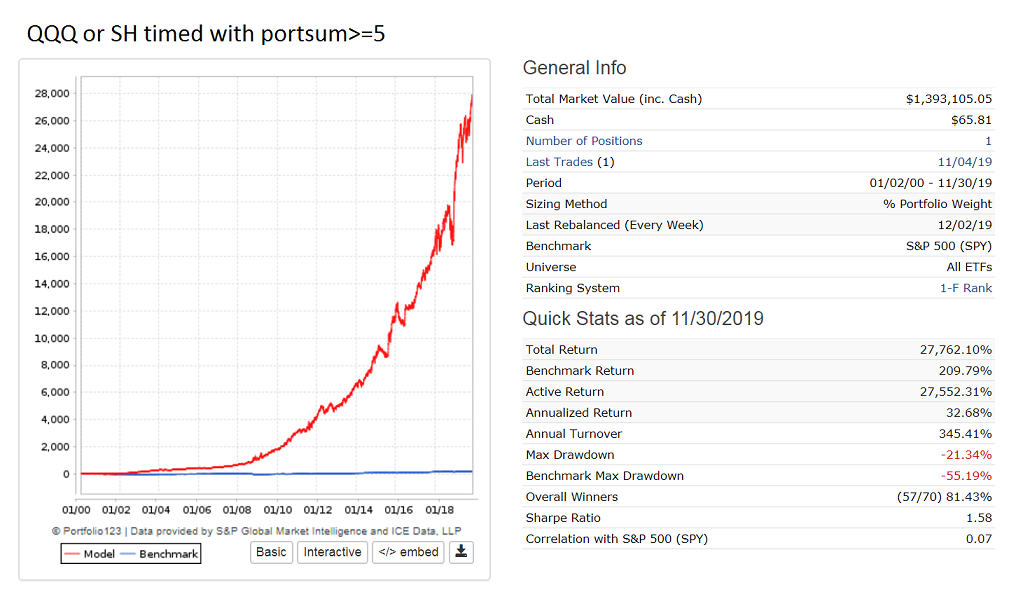
Use QQQ instead of OMFL which has only been around for 2 years.
A good market timer will return CAGR of 30%.
Here is one that switches between QQQ and SH.
ustonapc,
This model does not need a ranking system, it was an oversight - “1-F Rank” should have been removed in the simulation.
There is only one buy rule: eval($portsum5>=5,TICKER(“QQQ”) , ticker(“SH”))
and sell rule: nodays>=12
The model seeks to determine the optimum investment periods for equities by utilizing six different market timing strategies running on Portfolio 123, each designed to hold ETF SPY during up-markets. When the majority of them hold SPY simultaneously then the likelihood that equity up-market conditions exist should be high.
The six market timing models are contained in five portfolios (ports):
port1 = 2 ports: iM-(SPY-IEF) with Best(SSO-TLT) algo or iM-Composite Market Timer (SPY-IEF)
port2 = iM-(SH-SPY) Standard Timer
port3 = iM-Composite(SH-SPY) Timer with Standard & Composite Timer rules
port4 = iM-Inflation Timer (SPY-IEF)
port5 = iM-(SPY-IEF|VCIT) timed with S&P500 Momentum & VIX
The algorithm checks whether at any particular time any of the above ports holds SPY and returns “1” if so. Then the sum of such occurrences is determined by the following formula:
portsum = Sum of (2port1 + 1port2 + 2port3 + 1port4 + 1*port5)
The weight allocated to port1 and port3 is doubled because these portfolios each reference rules from two models. Thus, the possible maximum sum for portsum is equal to “7”, which would be the case when all 5 ports hold SPY at the same time.
A Portsum value greater or equal to “5” provided the best returns for this model as per optimization.
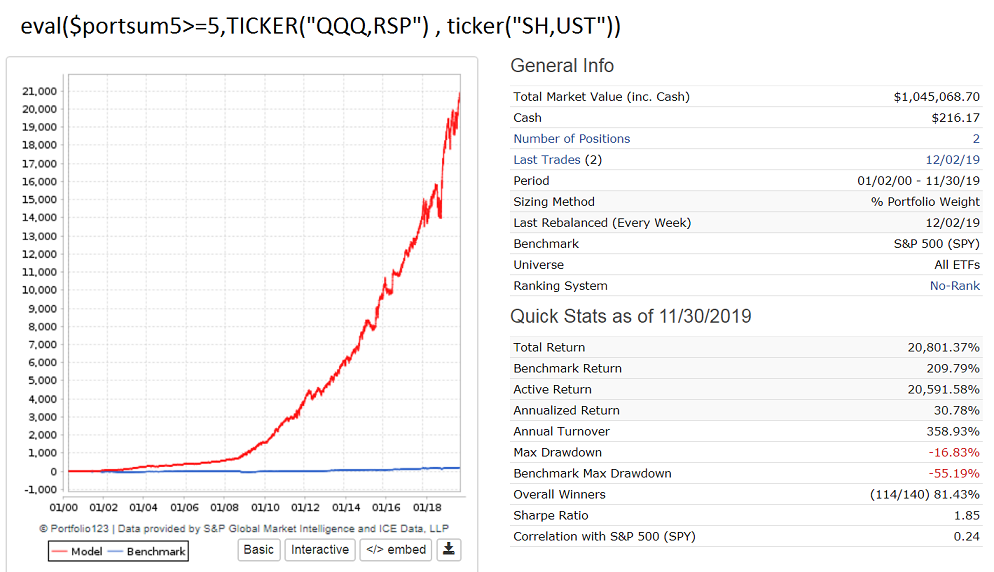
Below is the same model with more ETFs: eval($portsum5>=5,TICKER(“QQQ,RSP”) , ticker(“SH,UST”))
Still returns 30% with 0.1% slippage, but better Sharpe Ratio than QQQ-SH.