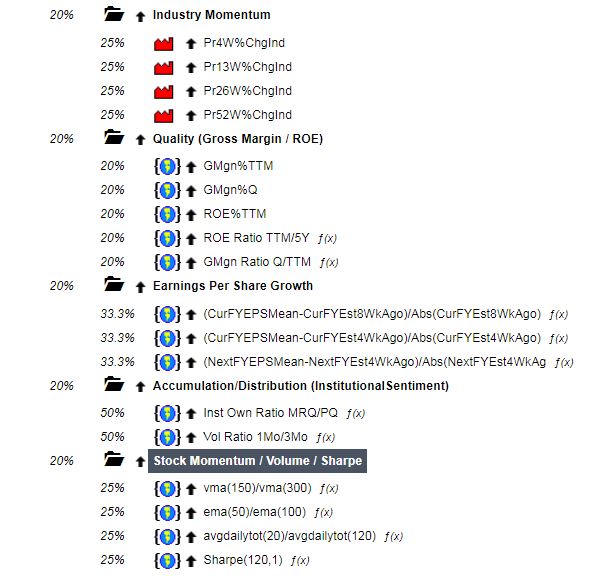
Andrea, you kindly gave us 5 out of 8 of your RS macro clusters (see attach).
Can you tell us the difference between “Stock momentum /Volume/Shape” (that you gave us) and “Stock Momentum”?
Fabio
Open a screen. Use “All Stocks” as your universe in the settings tab. Type
Universe(allfund) = 0 and FHist(“Universe(allfund)”,52) = 1
in a rule. Run the screen and you’ll see the stocks that fell out of the All Fundamentals universe in the last year. If you’re also looking for tickers that no longer exist, you can use the Advanced Stock Search and in the “Symbol” box type in ^19 or ^18 or whatever year you’re looking for. You’d then copy those to a list to see if those stocks were in All Fundamentals or not before they were delisted.
Perfect.
Andreas,
Thanks for sharing your system on this forum and Youtube, I have to say I like it so far!
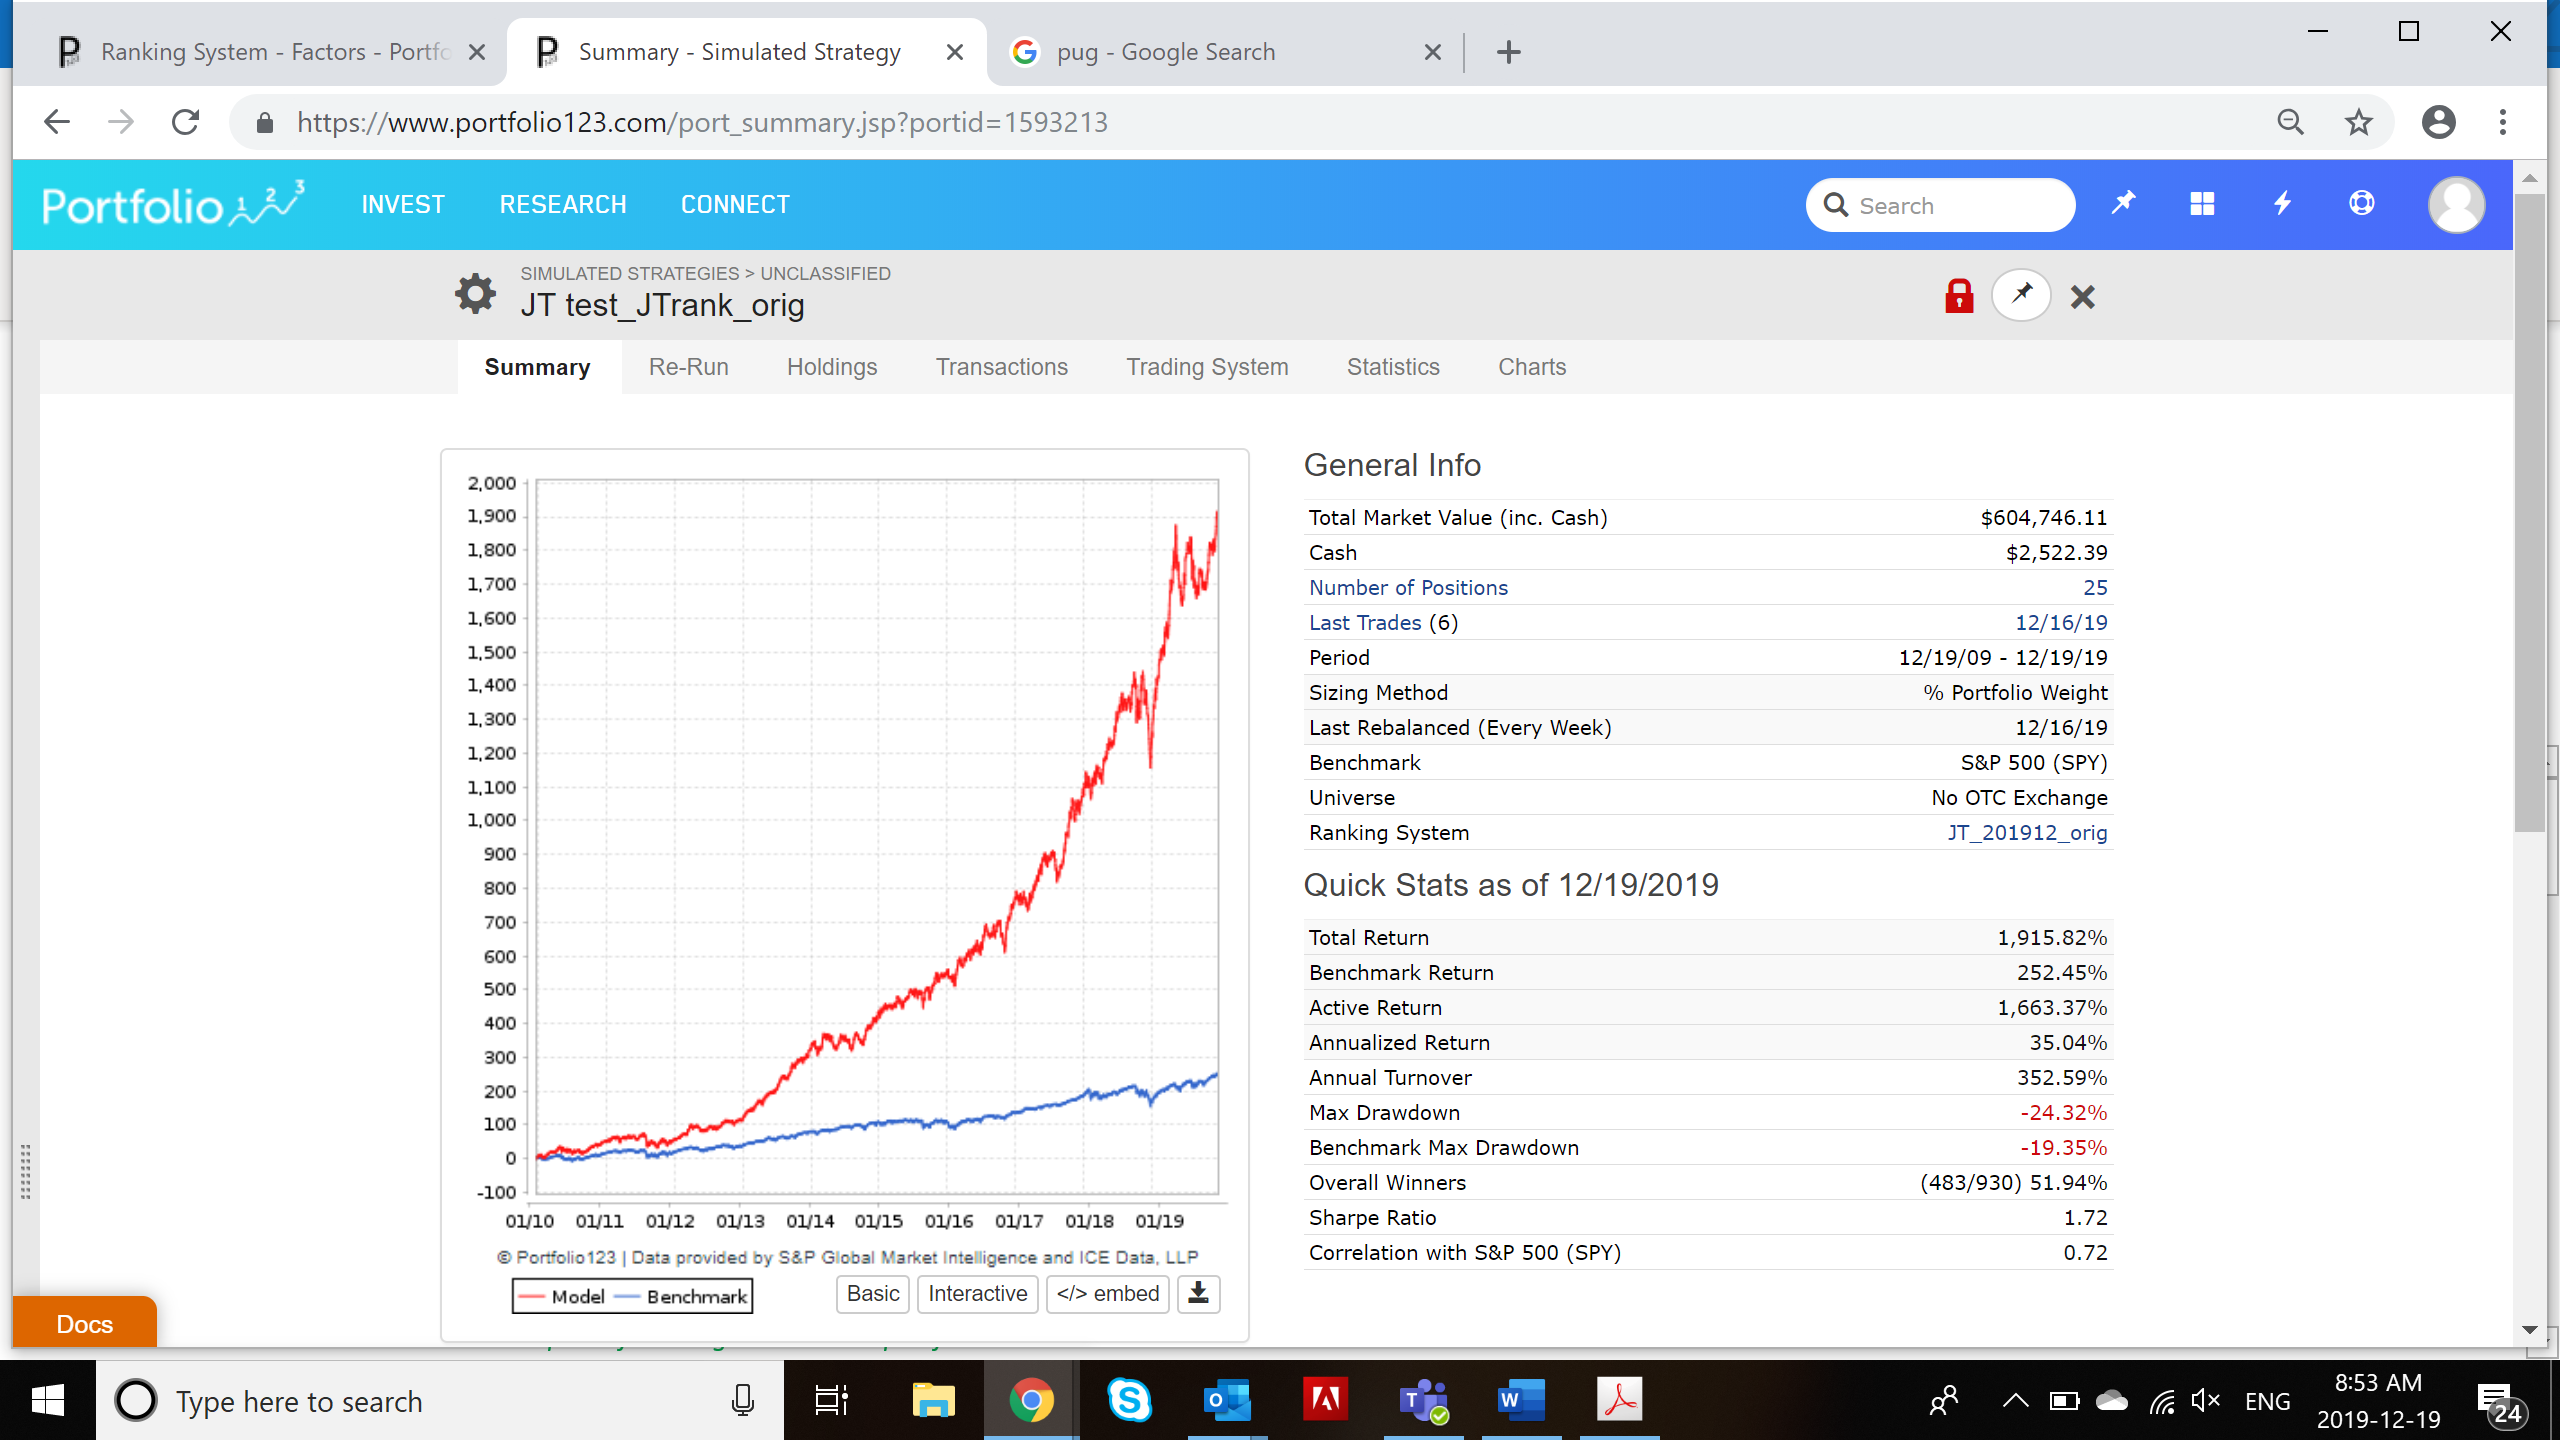
I’ve made some assumptions on your remaining RS nodes and buy/sell rules, but staying within your criteria of low volume small caps, here is what I’ve come up with (consider this ‘base case’):
Variable slippage, w/ market timing, buy rank>80, sell < 70, all RS nodes you provided are unchanged:
Very similar results, but slightly higher turnover.
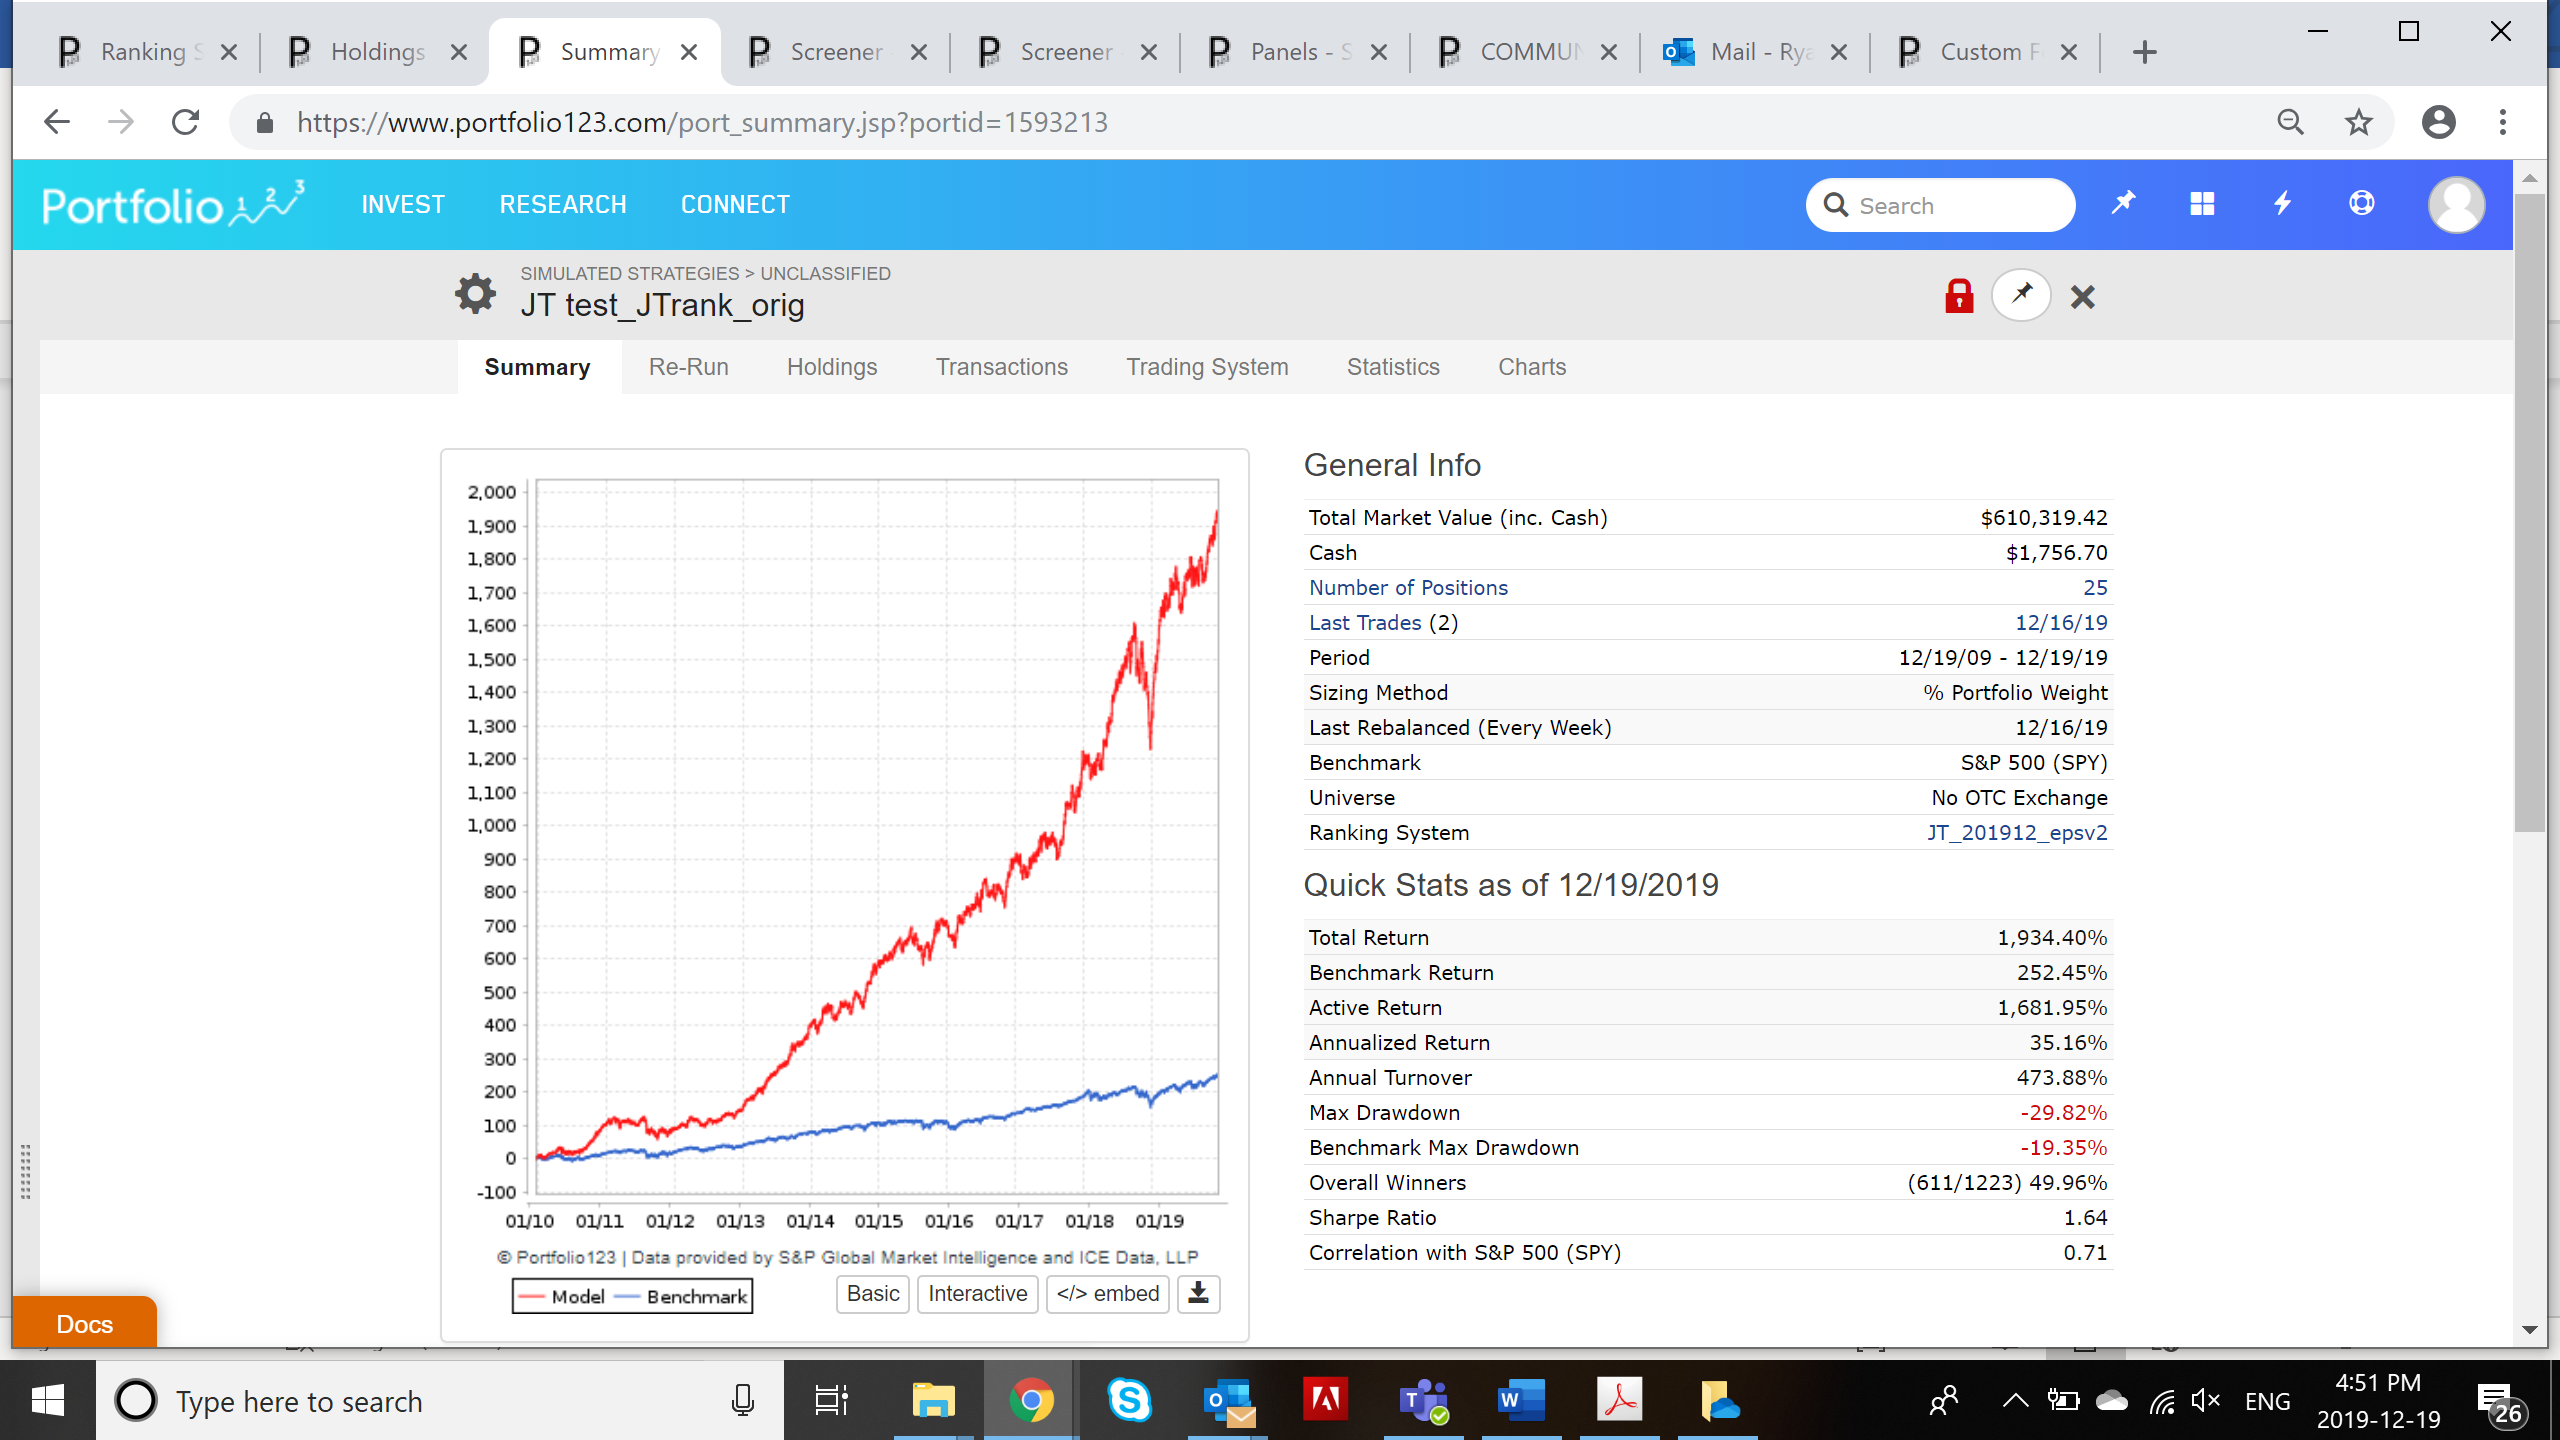
I have variations of a buy rule that screens for high ranking EPS, results vary for different time periods.
I’ve tried different tweaks on the ranking system with varying minor improvements, feel free to try some, sim results will vary depending on how our buy/sell rules differ, other elements of the ranking system, etc:
• EPS Growth
o Negative values can be problematic, the rule for TTM is nice as it screens out any -ve value EPS’s.
o For quarterly, can try this:
o (EPSExclXorQ - EPSExclXorPYQ )/max(0.01,abs(EPSExclXorPYQ))
• Quality
o Marc provided some suggestions on (a-b)/abs(b); I tried this as well, but with little impact.
o ROE% 5y AVG will result in NA for any companies less than 5 years old, which may skew results. On the other hand, this is also like a screen to give credit to any firms with a minimum 5 yr history. Could also tweak formula to rank NAs negative for this formula (haven’t tried this yet)
• Accumulation/Distribution & Stock momentum/volume/sharpe
o Can try using median volume instead of average volume in calcs. This will eliminate some of the outliers in average values.
• Rank industry/sector specific factors on “industry” or “sector” rather than “universe”
o Profit margins can vary by sector/industry, try ranking by sector/industry
o Same with EPS factors
Let me know if these work out for you.
Cheers,
Ryan

Hi Ryan,
I like the way you are using 25 stocks and variable slippage to help get realistic simulation results.
I’m concerned, however, about the No OTC Universe since it has a lot of illiquid stocks that are difficult to trade. Did you use a liquidity buy rule. Here is an example.
MedianDailyTot(10,0)> 200000 and MedianDailyTot(10,10)>200000and MedianDailyTot(10,20)>@adt and MedianDailyTot(10,30)>200000
This helps to avoid buying stocks that might temporarily have a decent volume in the past week or two but could become illiquid. This rule does not guarantee that there will be good liquidity when it comes time to sell, but it does help.
Brian
Hello Brian,
Yes, there’s a buy rule of mediandailytot(20)>100000.
Thanks for the tips on multiple volume rules.
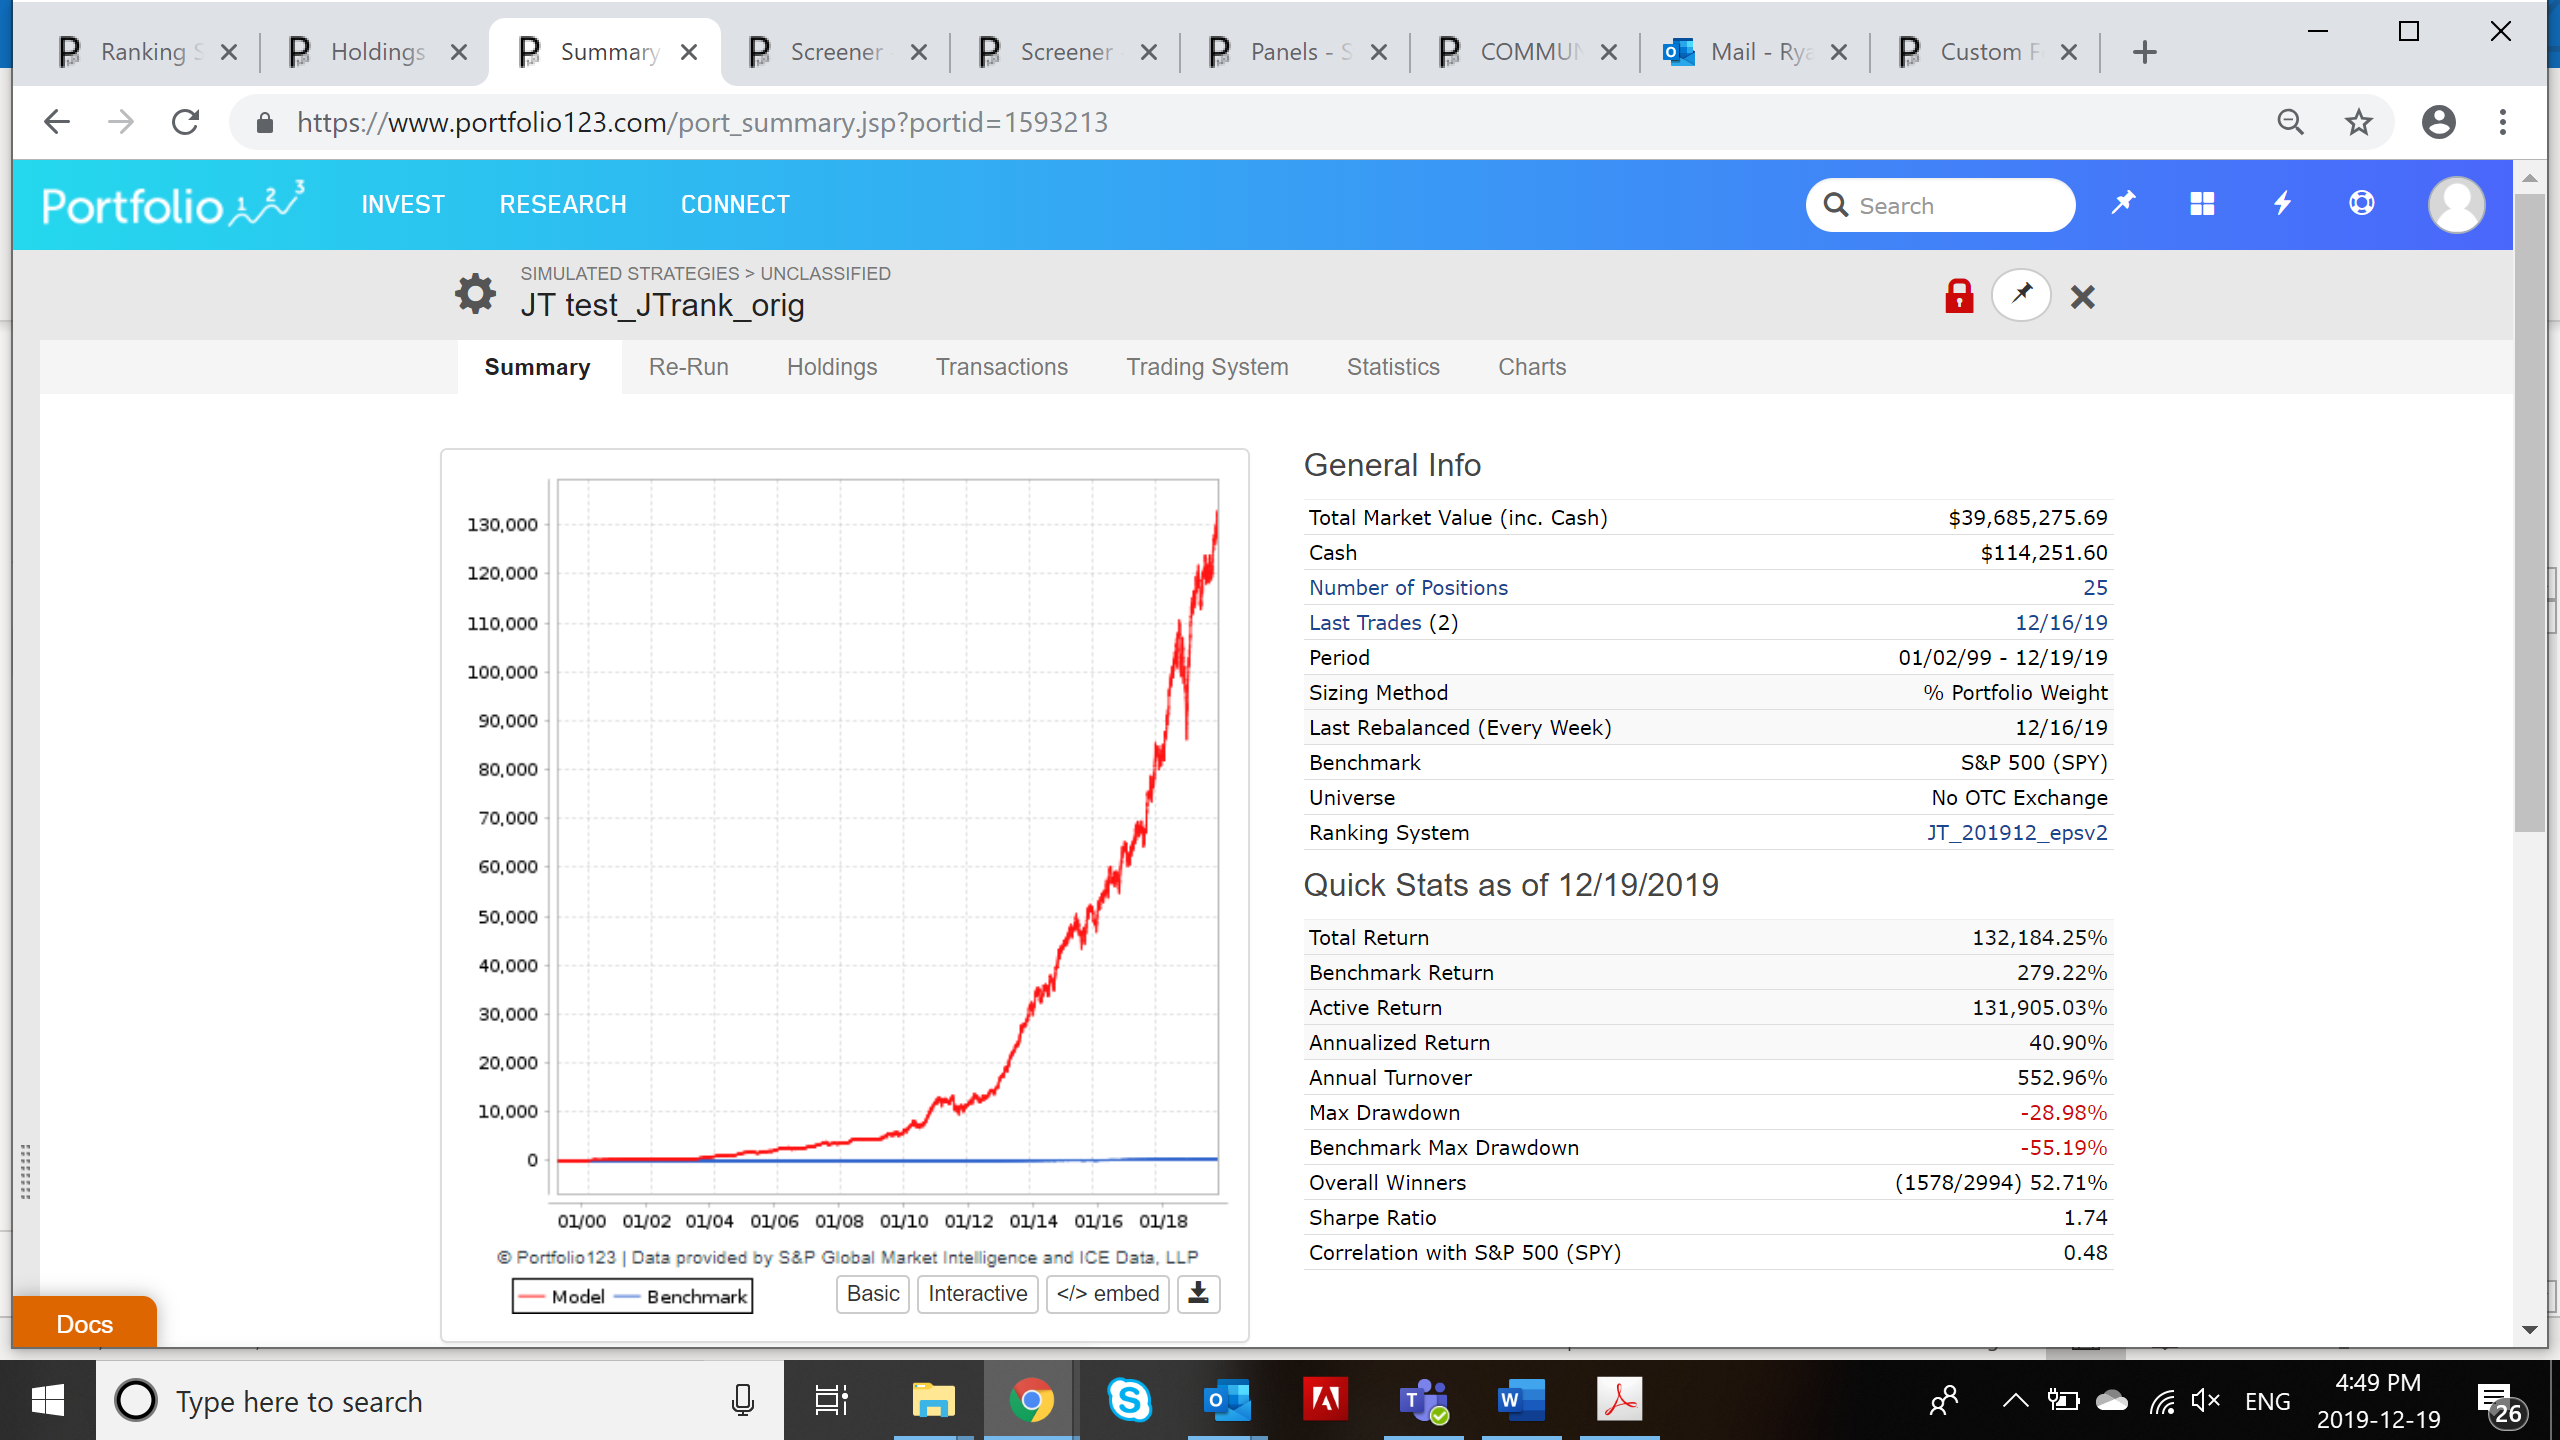
For comparison, if I add the multiple offsets as you suggested, there is some minor change. Performance drops slightly in the overall 20 year test, however is about the same CAGR in last 10 years, but a smoother curve :-). Turnover increases in both.
See screenshots below.
BTW, What is the rule “MedianDailyTot(10,20)>@adt”? Median volume must be greater than average daily volume for the given period?
Thank you Ryan!!!
Very, very good results, mine are just slightly higher!
Will put out more vidoes, got some stuff on big caps too, but much lower results, but decent capital curves…
Lets keep those strategies and look how they do in realtime.
My realtime results are here: https://twitter.com/GfI_Himmelreich/status/1076219796381937667
Unfortunetly not since 2011, but good enough ![]()
Best Regards
Andreas
One more question: Are you going to trade this Ryan?
Best Regards
Andreas
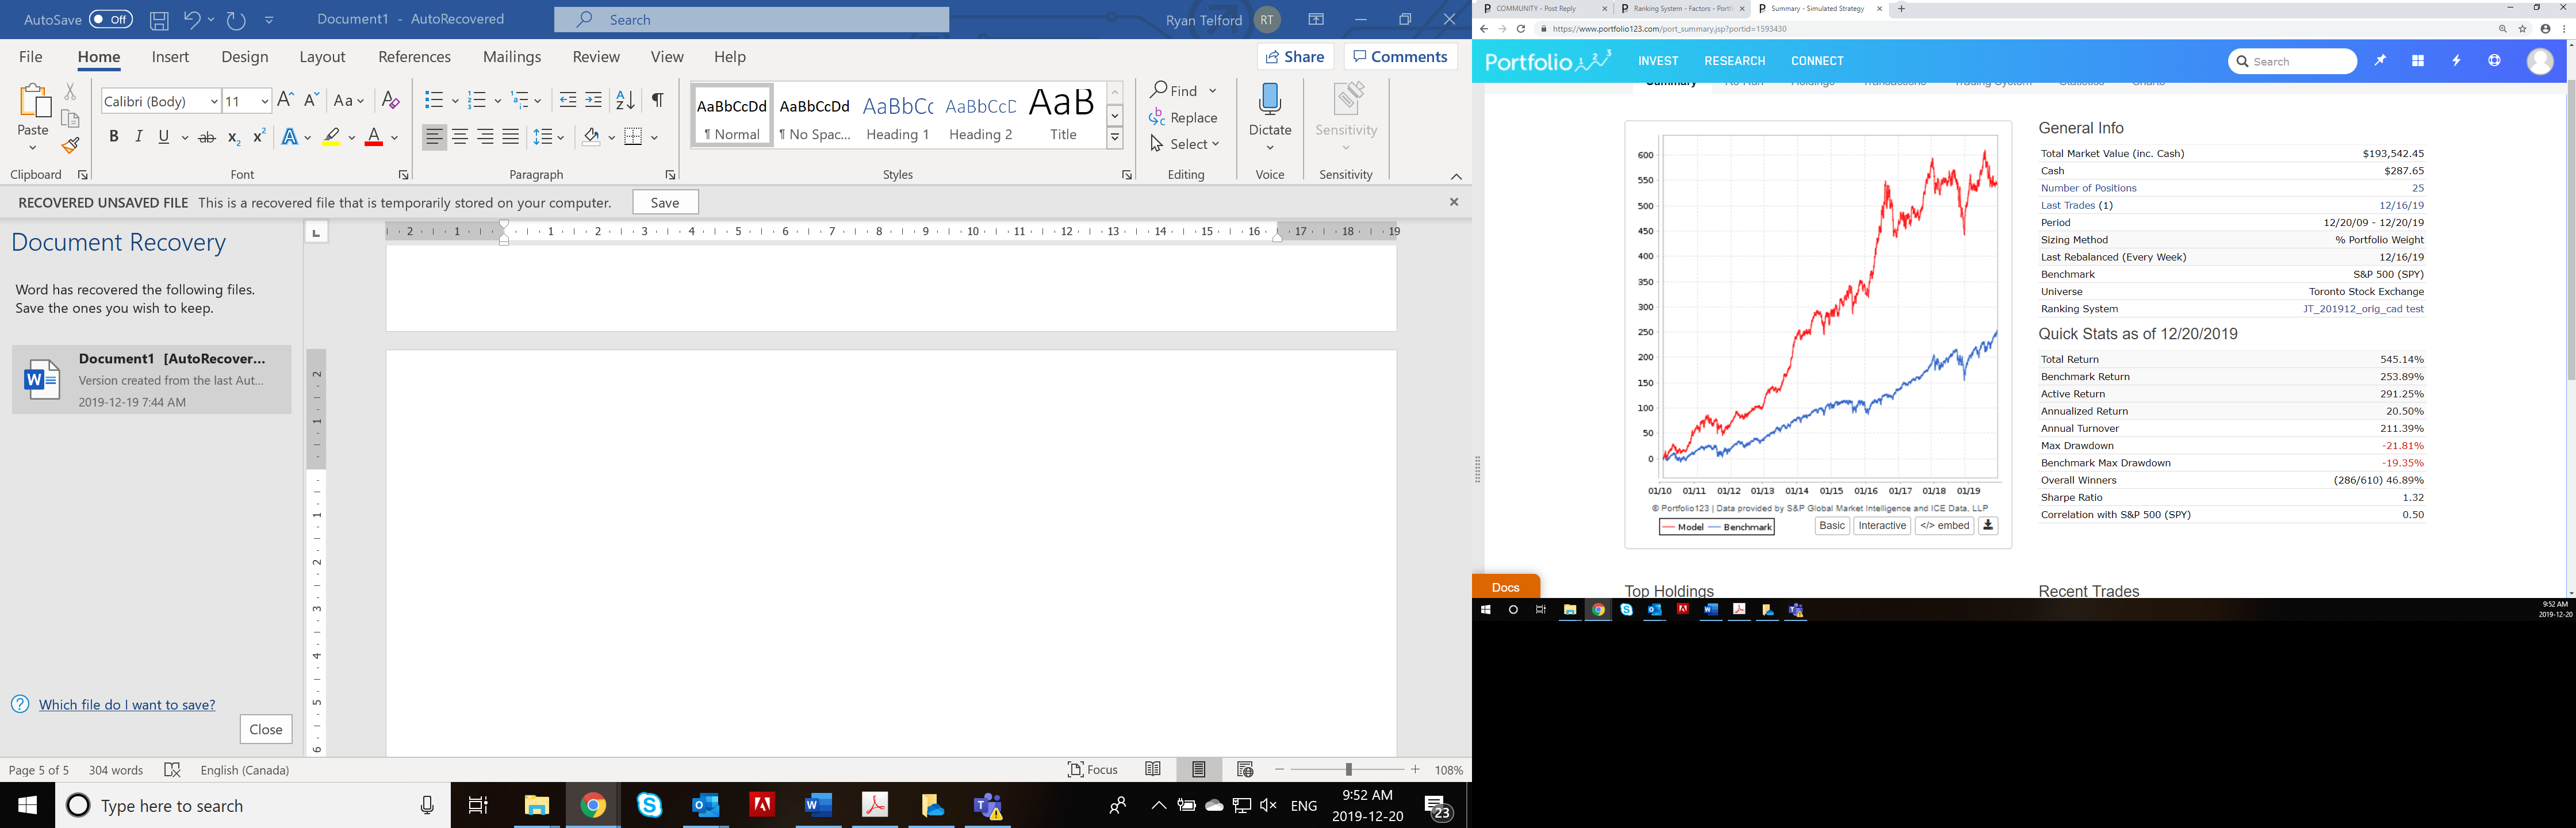
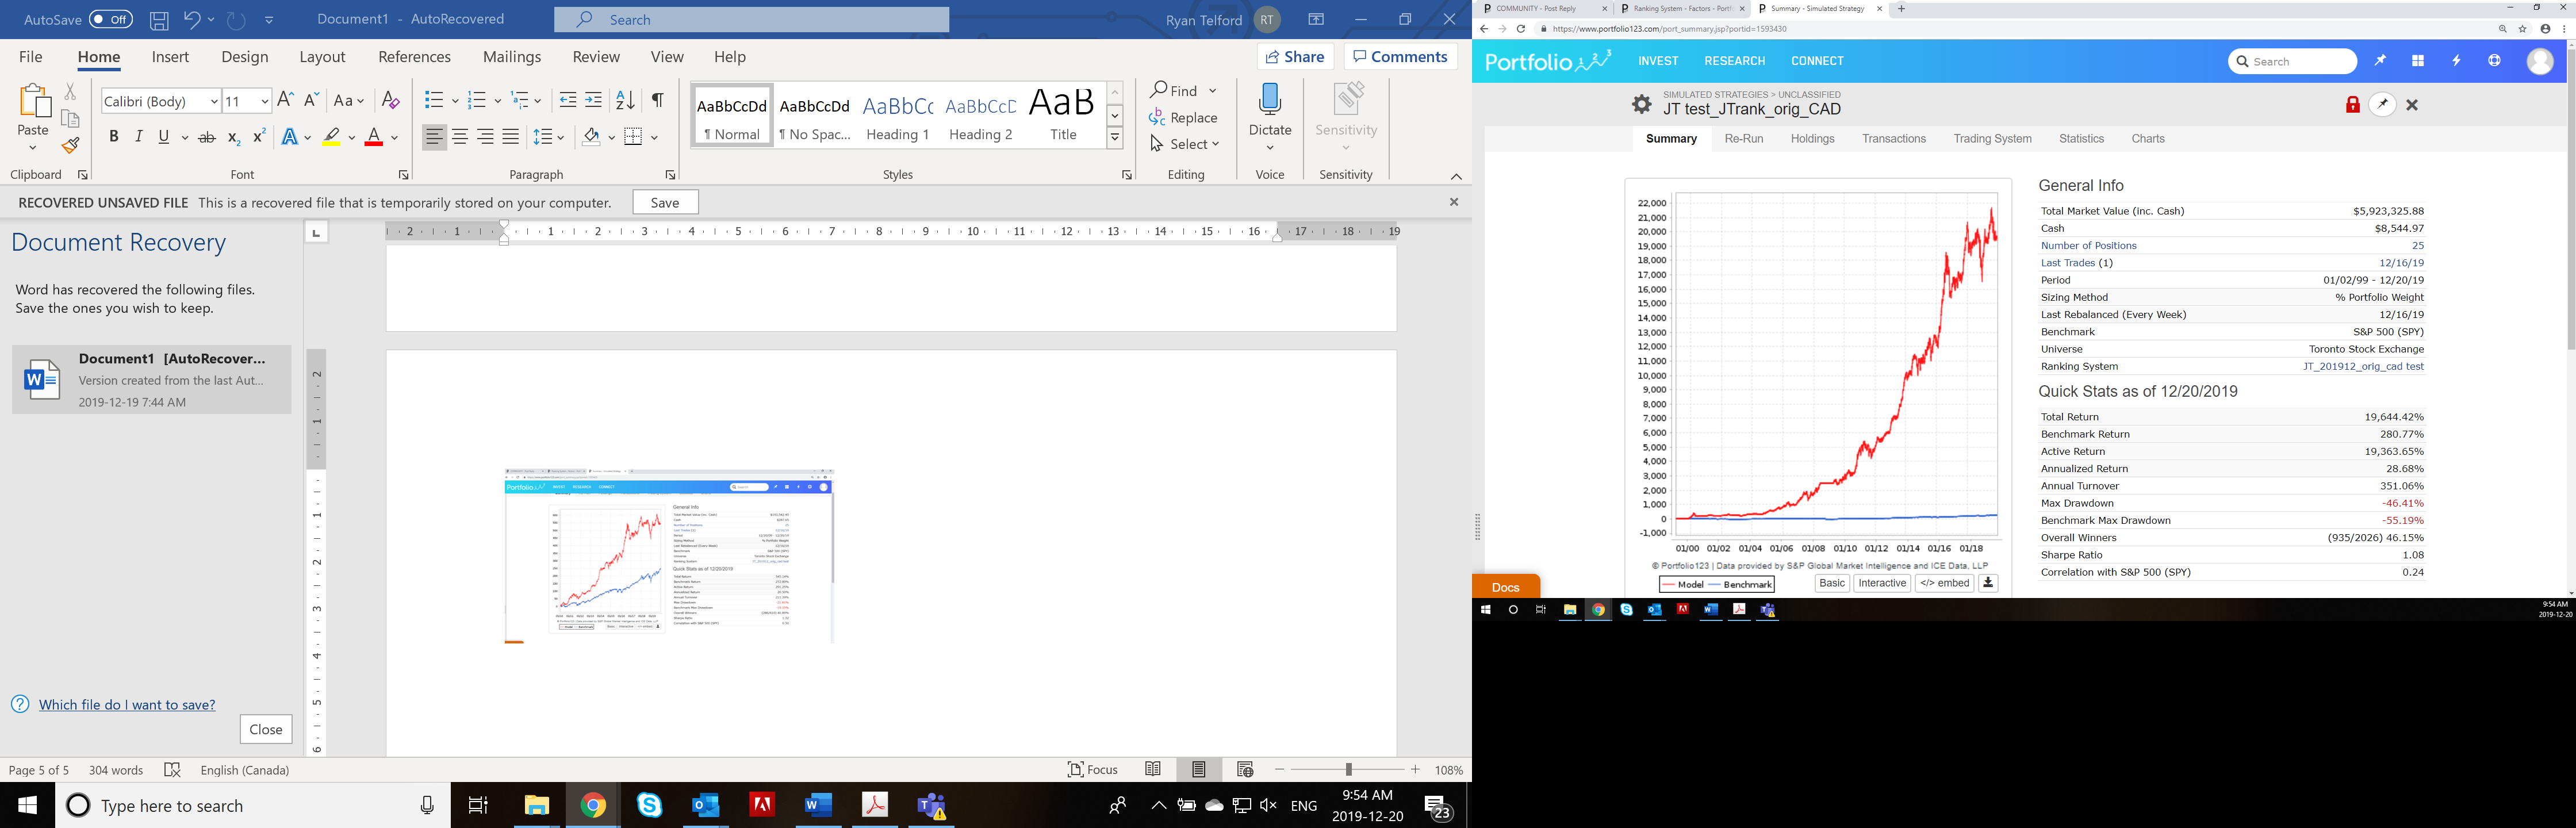
Hello Andreas, I’ve set up two versions of this port as a live system on automatic re-balance.
I’m also working on a Canadian version (where I’m from), but so far I can’t get the results like in the US versions yet. Getting about 28% CAGR (20 yr), but higher DD (with hedge). This sim also shows a very volatile last two years, overall performance is essentially flat. The Canadian market is very different than US, i.e. higher concentration of financials, energy/mining, resource etc. There are several P123 factors that are unavailable for Canadian stocks as well, i.e. short interest. I also find a higher proportion of small cap/low volume Canadian stocks are uncovered by analysts (which can be a good thing), but any factors relying on analyst estimates will provide a high proportion of NAs.
See 10 & 20 yr sims for the Canadian version attached, 25 stocks.
Not invested yet in the US versions yet, I’ll see how they behave in realtime/out of sample, it’s also a good way to ferret out any bugs, i.e. see the actual stocks being selected, some can be fantastic on one factor and an absolute dog on another. I’ve started doing this the last few months on other sims/ports, this is a very valuable tool and strategy I’ve only recently started using.
If I trade it, I’ll need to change brokers for this low volume account. My current broker doesn’t offer GTC orders.
Any tips on the buying w/ GTCs? My take is the best way is to put in an order 2-3% lower than Friday close, and wait a few days. Any tips/tricks would be great!
I’ll keep you posted with any developments.
Thanks for sharing your twitter progress, I’ll be sure to follow you.
Love your posts and videos, keep it up. And good luck going pro next year!
Cheers,
Ryan
Opps, to avoid confusion I meant to change @adt to 200000 as I did for the other items in the list. But since I introduced the confusion let me clear it up.
I put my liquidity rules inside a custom universe rather than as a buy rule. That avoids unintended consequences when I use a rankpos < x as a buy rule or > x as a sell rule. Here are the two relevant lines from my universe specifications:
SetVar(@adt,200*1000)
MedianDailyTot(10,0)>@adt and MedianDailyTot(10,10)>@adt and MedianDailyTot(10,20)>@adt and MedianDailyTot(10,30)>@adt
Using @adt is just a quick way for me to change the threshold in the multiple conditions in the second line.
I just realized it would make more sense to call the variable @mdt since I now use mediumdailytotal rather than averagedailytotal.
Brian
Cool!
Hi all,
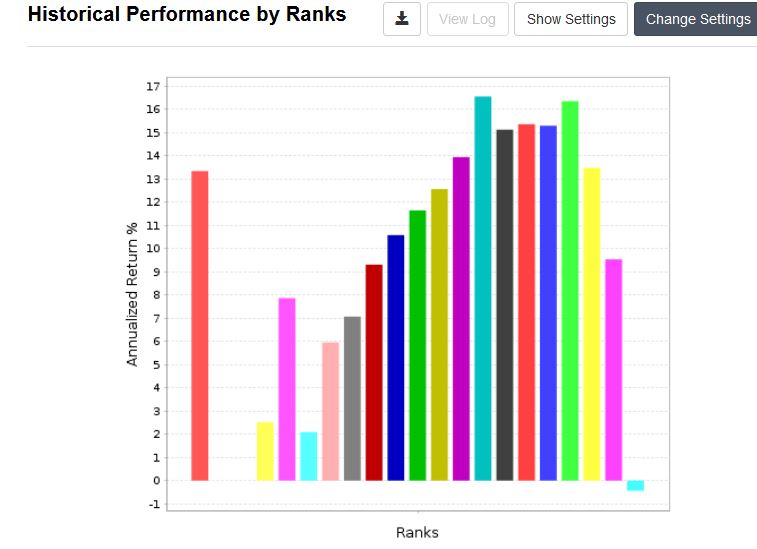
I just tried the upper formula of Steve, on an empty RS and the result is here attached. As I noticed this kind of istagramm many time in my RS, I am asking the forum how to avoid a sudden crash (probably in this case a too high ratio of NPMgn% is intolerable) when the quartile is high (>80-90%). Is there a solution to avoid the drop?
Hi Fabio,
I doubt there is a way to avoid a systematic drop-off as it depends on what you are ranking.
However, you could try to configure your ranking so that you “displace” the peak value conveniently to the right / left.
- See a solution here from Walter → https://www.portfolio123.com/mvnforum/viewthread_thread,12038_lastpage,yes#70737
- I remember this was also discussed in the past on the forum. E.g. search for “Question concerning ranking best results” on 3 Sept 2016
Caveat → I have never used a displaced ranking myself
Good luck
Jerome
Nicoletta - I would not use the formula in isolation as there are a lot of other factors to consider. (My point in the previous post was that earnings growth is not really sorting on earnings growth as you cannot grow earnings if there aren’t any.)
You should use it in conjunction with other factors. Use enough good factors and the top end roll-off that you see in the ranking performance should disappear.
Steve
I think you have to understand WHY the performance drops off.
Increases in profitability/margin can signal two things: an increase in earnings or a decrease in sales. A company with a huge increase in profitability is probably experiencing both. And a large increase in earnings with a large decrease in sales indicates a possibility of earnings manipulation.
Margin increases are extremely useful signs, but you have to read those signs the right way. And a higher-is-better system is probably a bad idea.
How about using the linear regression slopes in the ranking system.
LoopSum(“RoE%(CTR,ANN)(3-CTR)",7,0,1,1) / LoopSum("Sales(CTR,ANN)(3-CTR)”,7,0,1,1) [higher is better]
If RoE% has a steeper slope than Sales, this would indicate higher profitability. You don’t want higher Sales with lower RoE%.
Georg et al - I have a basic problem with LoopSum(“Sales(CTR,ANN)*(3-CTR)”,7,0,1,1).
Take two companies. Company 1 has annual sales as follows:
2, 3, 4, 5, 6, 7, 8
Company 2 is twice the size of company 1 and has annual sales as follows:
4, 6, 8, 10, 12, 14, 16
Both companies have the same sales growth profile, the only difference is that Company 2 has twice the sales of Company 1.
If you use the formula LoopSum(“Sales(CTR,ANN)*(3-CTR)”,7,0,1,1) the calculation for company 1 comes out as:
2*(-3)+3*(-2)+4*(-1)+5*(0)+6*(1)+7*(2)+8*(3) = 28
The result for Company 2 is:
4*(-3)+6*(-2)+8*(-1)+10*(0)+12*(1)+14*(2)+16*(3) = 56
The slope is twice as big for company 2 simply because the company has twice the sales to start with. The formula is correct but it does not meet the intent of what we are trying to achieve (in my opinion). Both companies are growing at an equivalent pace but Company 2 comes out 2x company 1 for this metric.
Putting the sales in the denominator doesn’t help as ROE%ANN is already a normalized figure.
There may be some value for having Earnings in the numerator and Sales in the denominator. I will have to think about that some more.
SteveA
Steve, Thank you for this example.
You have just shown us why “Sales” on its own is not a good indicator to select stocks by, and as Yuval and I found earlier “Sales” does not work well.
https://www.portfolio123.com/mvnforum/viewthread_thread,12038_offset,20
However, “RoE%” is a much better indicator, because replacing in your example “Sales” with “RoE%” will produce the result you want.
ROE should work much better. But when you say “works much better” you need to make sure you are testing against 7±year-old stocks only. This means creating a universe of stocks that has 7 years of data minimum, then run your ranking system on it. Otherwise the newer companies could be influencing your results. How? First of all there are IPO lockups that cause stocks to tank 6-9 months after IPO. Second, smallcaps have been underperforming for several years. So if you include these newbees in your universe, they are going to be placed at the bottom of your ranking system, assuming the formula comes out as “N/A”, making the RS look better than it should.
SteveA
Thanks a lot to all (SteveA, Yuval, Georg, and Jerome). It’s a plasure to write here and find experienced people that helps you.
It’s sure not my intention to create a RS with a single rule. I am seeking new way to improve my poor results, trying each factor and assembly the one with better results in an unique RS, and I just wanted to know if there’s a way to avoid the drop in the last decile that some parameters have.
As far as I understand the answer is no… no way to filter…unless to change the formula.
As Steve says “You should use it in conjunction with other factors. Use enough good factors and the top end roll-off that you see in the ranking performance should disappear”
Thanks again
Fabio